©Copyright 2018 GEOSCIENCE RESEARCH INSTITUTE
11060 Campus Street • Loma Linda, California 92350 • 909-558-4548
New observational data on the phenomenon of rapid bedrock erosion became recently available after the well documented events that affected the Oroville Dam in February 2017.
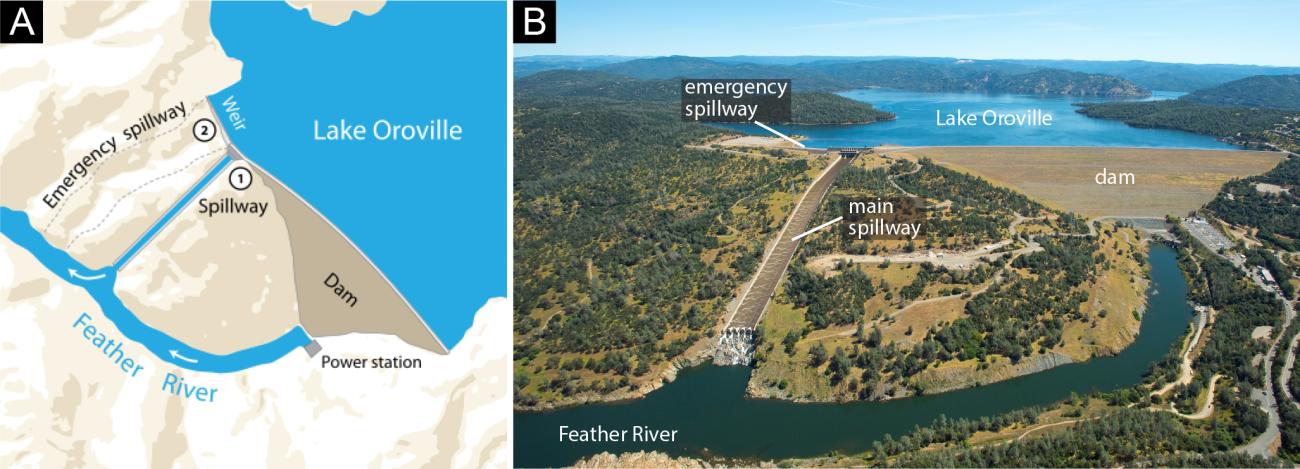
The Oroville Dam, located in northern California, USA, confines a large water reservoir (Lake Oroville) with a retention capacity of about 4 km3. The lake level is controlled through a main spillway, consisting of a concrete chute nearly 1 km long and about 50 m wide that slopes for over 200 vertical meters down to the Feather River (Fig. 1). An emergency spillway, designed to be active in cases of extremely high lake levels, is located to the side (NW) of the main spillway, and consists of a linear concrete weir separating the lake waters from the wide valley flank that leads down to the river bed (Fig. 1).
The Crisis in February 2017[i]
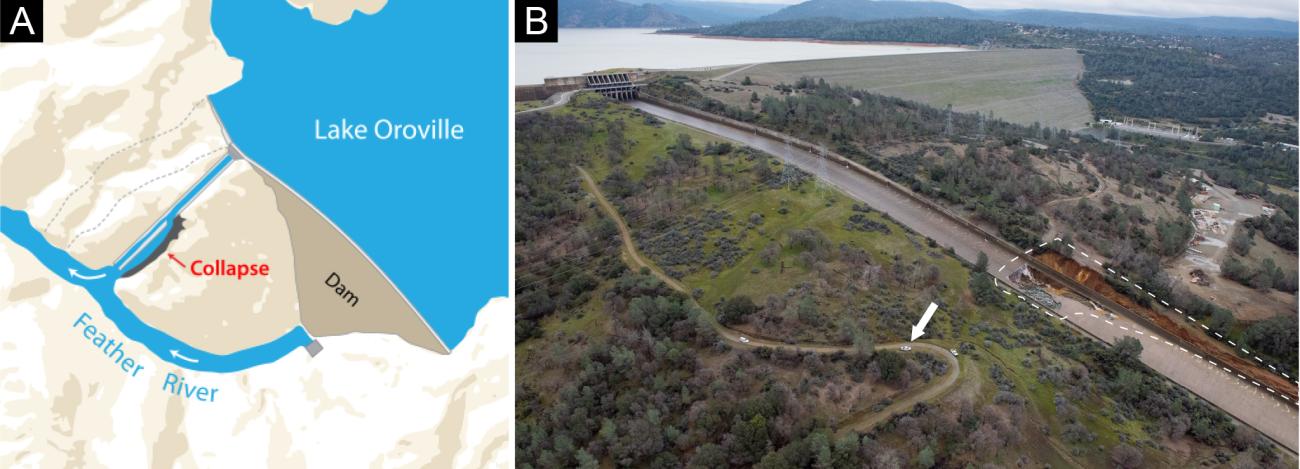
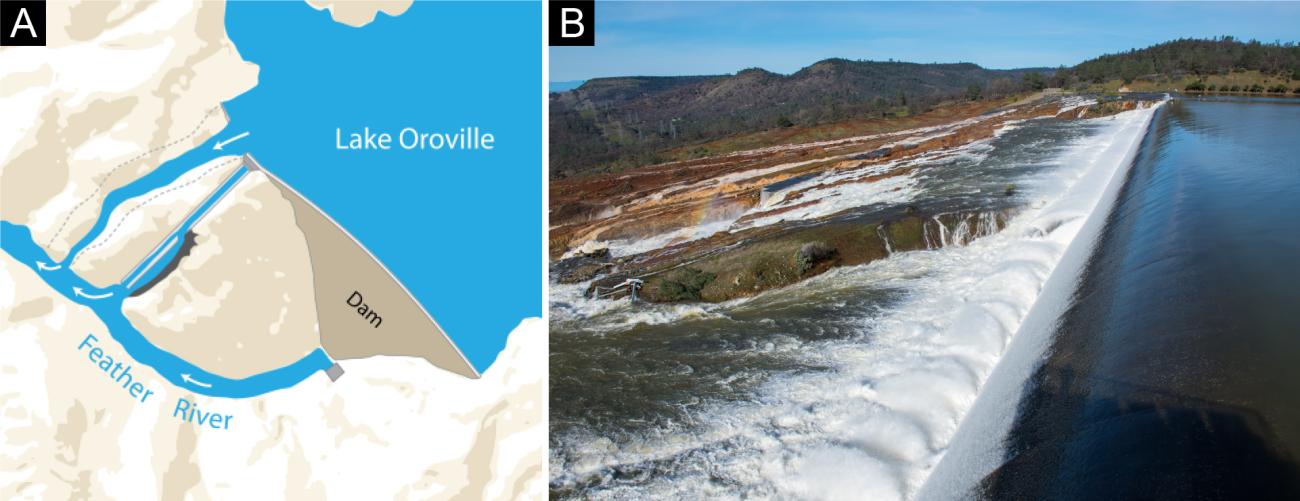
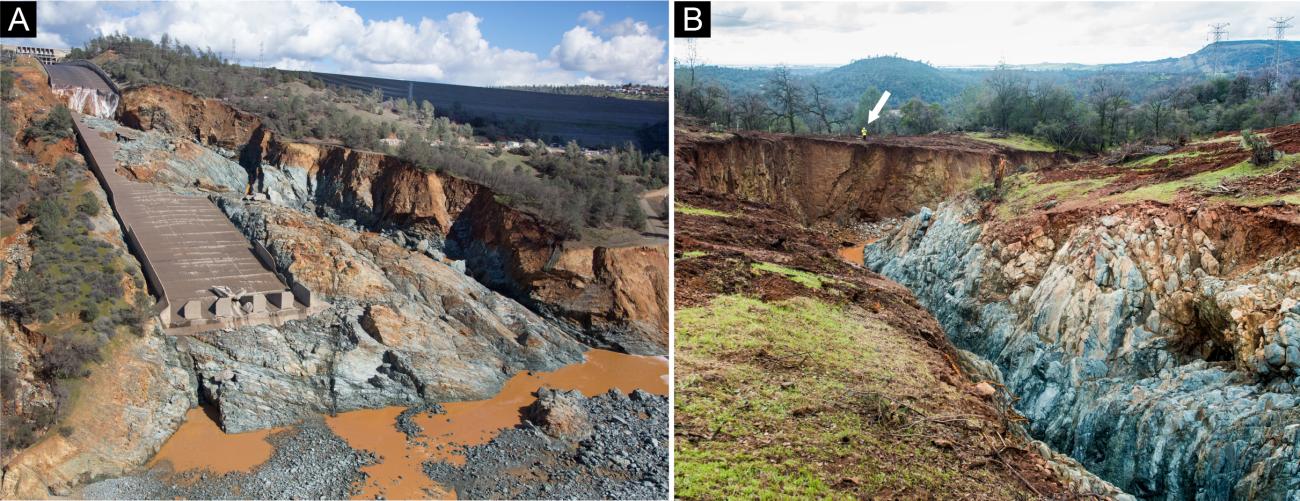
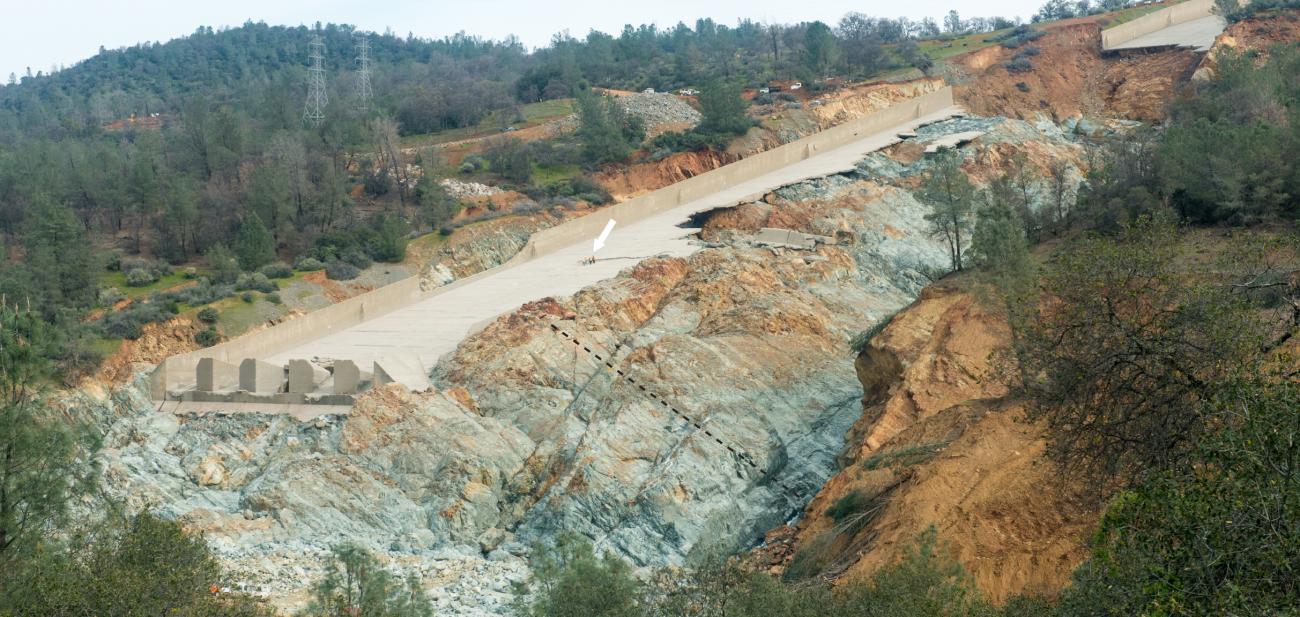
Exceptional rainfall in the Winter of 2017 caused significant inflow into the reservoir and required activation of the main spillway to control the lake level. On February 7, an irregular flow behavior was detected in the middle part of the main spillway chute. Water discharge was interrupted to investigate the cause of the anomaly, revealing that the concrete chute was severely damaged over tens of meters. A large section of concrete had been washed away and water had already created an erosional path to the left (SE) of the chute (Fig. 2). However, because of increasing lake levels caused by exceptional rainfall, discharge on the damaged spillway was reactivated on February 9, with outflow rates varying between of 1120 and 1820 m3/s. In spite of this renewed outflow, the lake level kept rising, reaching more than 901 feet on the night between February 11 and 12, and causing overflow at the weir of the emergency spillway for the first time in the history of the dam (Fig. 3).
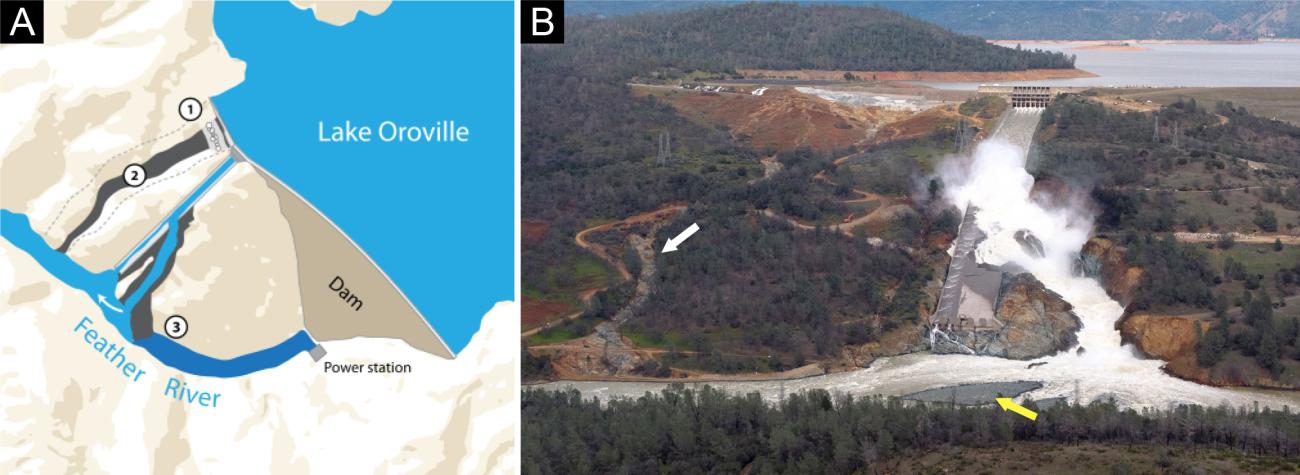
Erosion downhill of the emergency spillway occurred faster and more effectively than expected, with the threat of possible collapse of the weir and consequent catastrophic release of large volumes of water. This risk prompted a mandatory evacuation of the Oroville area (about 200,000 inhabitants), on February 12. Decision makers managing the crisis had to significantly increase the outflow rate at the main spillway (to 2800 m3/s) to bring the lake level below the threshold of the emergency spillway. This would imply further erosion and damage at the main spillway, but it was estimated that the new incision next to the spillway would deepen in a "controlled" manner, preventing sheet erosion or another lateral breakout towards the dam. The strategy worked, and on the night between February 12 and 13 the overflow at the weir of the emergency spillway stopped (Fig. 4). As the lake level kept decreasing, discharge at the main spillway was also gradually reduced until, on February 27, the outflow was finally halted to begin the subsequent phases of surveying, cleanup, and repair.[ii]
Remarks and Implications
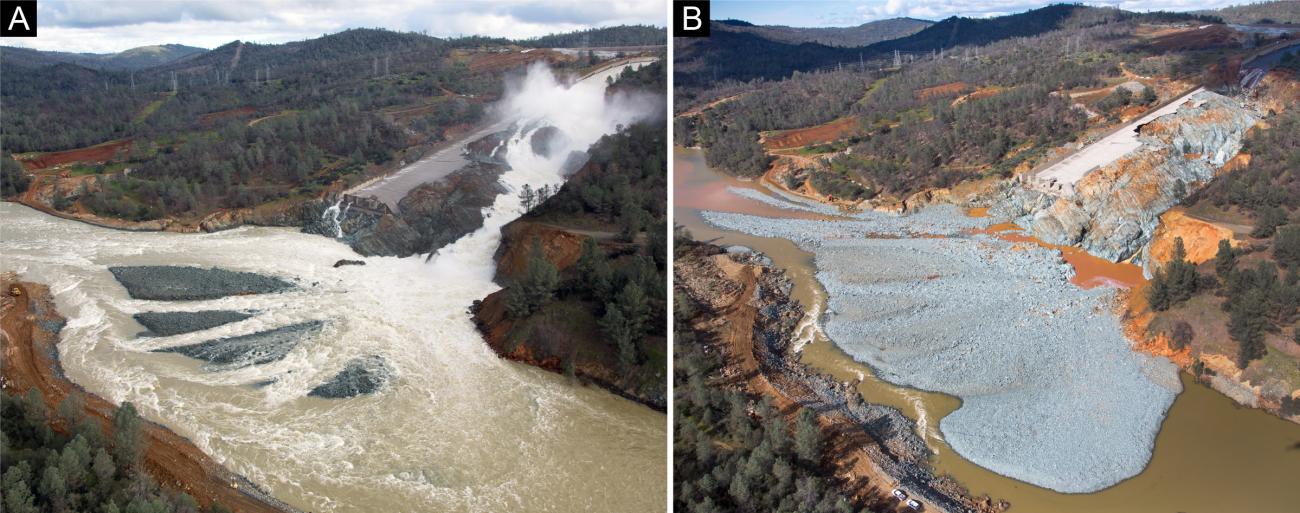
The extent of erosion attained in just a few days at the main spillway is remarkable. The concrete spillway chute was destroyed and torn away in its middle to lower section. Next to the chute, a canyon was incised, several tens of meters deep and several hundred meters long (Figs. 4B, 5A). Overflow from the emergency spillway removed soil cover and caused significant bedrock incision in just one day (Figs. 4B,5B).
The bedrock in the area affected by erosion is part of the Jurassic Smartville Complex, and consists of low grade metavolcanics of mafic composition, with sheeted diabase intrusions.[iii] The tabular nature of the volcanics and of the subsequent sheeted intrusions confers a distinctively layered aspect to the unit. Layers dip at a relatively high angle to the east, against the slope of the valley (Fig. 6). The planar discontinuities of the layering and some fractures favored plucking of blocks as the main mechanism of erosion under solicitation by hydraulic flow, as demonstrated by the abundance of planar faces on the angular blocks in the debris pile and on the jugged surface of the eroded bedrock (Fig. 7).
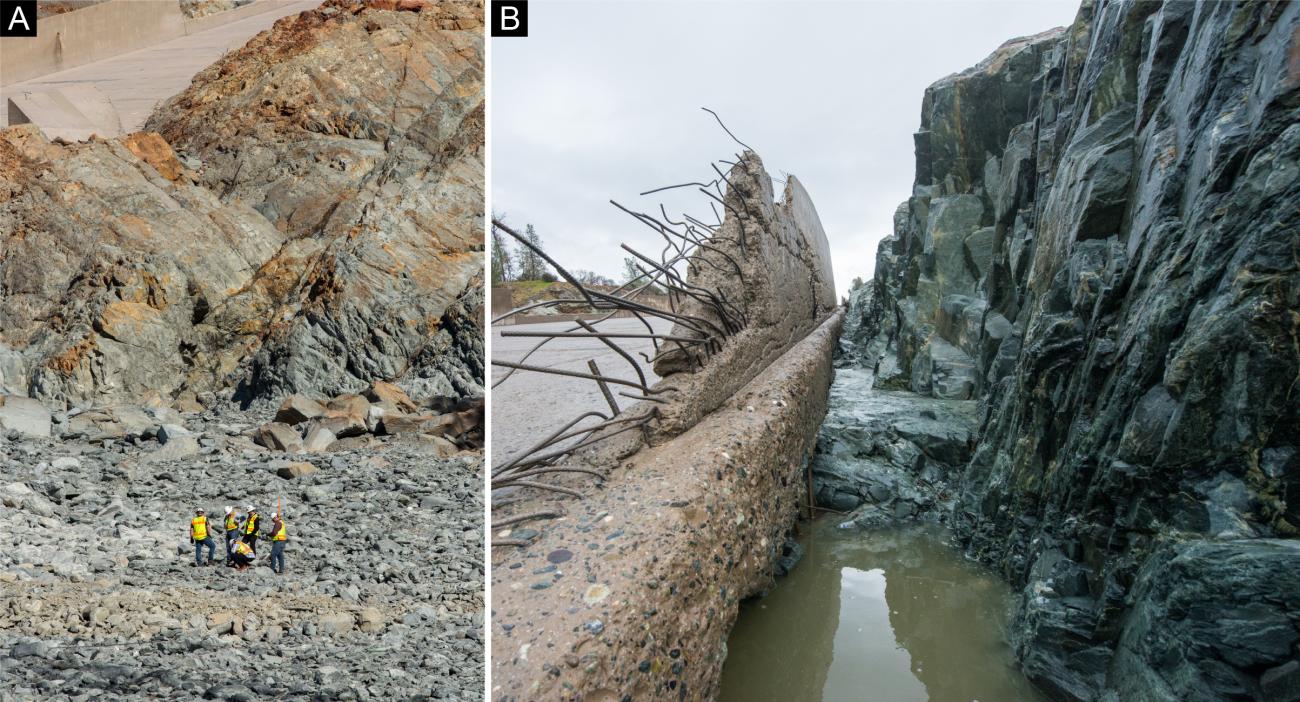
Weathered bedrock (yellowish brown color) is certainly less competent than the fresh lithology (bluish-green color), and spatial variations in thickness of this top level might have played a role in determining the points where extensive erosion was initially concentrated. However, significant fresh bedrock erosion took place both at the main spillway and downhill of the emergency spillway (Figs. 5-8).
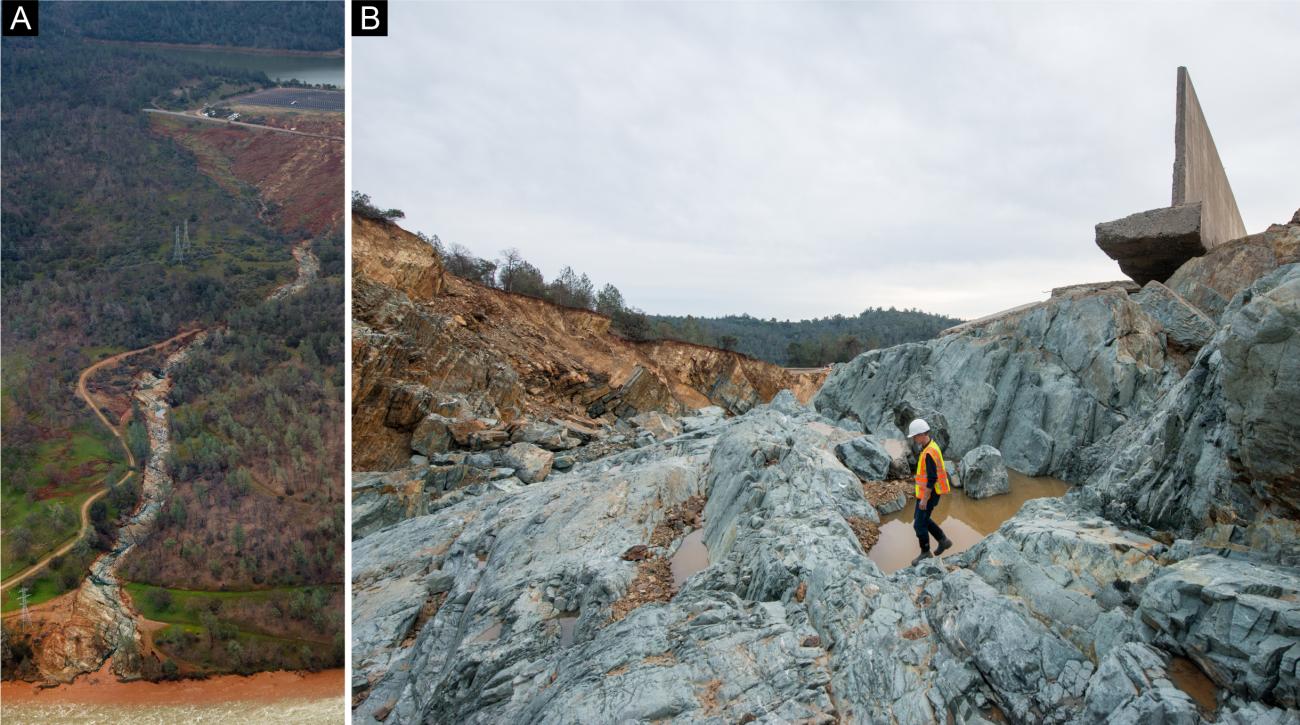
The debris generated by erosion at the main spillway (an estimated 1 million tons of material) accumulated at the foot of the new canyon, rapidly creating a system of coarse-grained, boulder-rich bars at the confluence with the Feather River (Fig. 9).[iv]
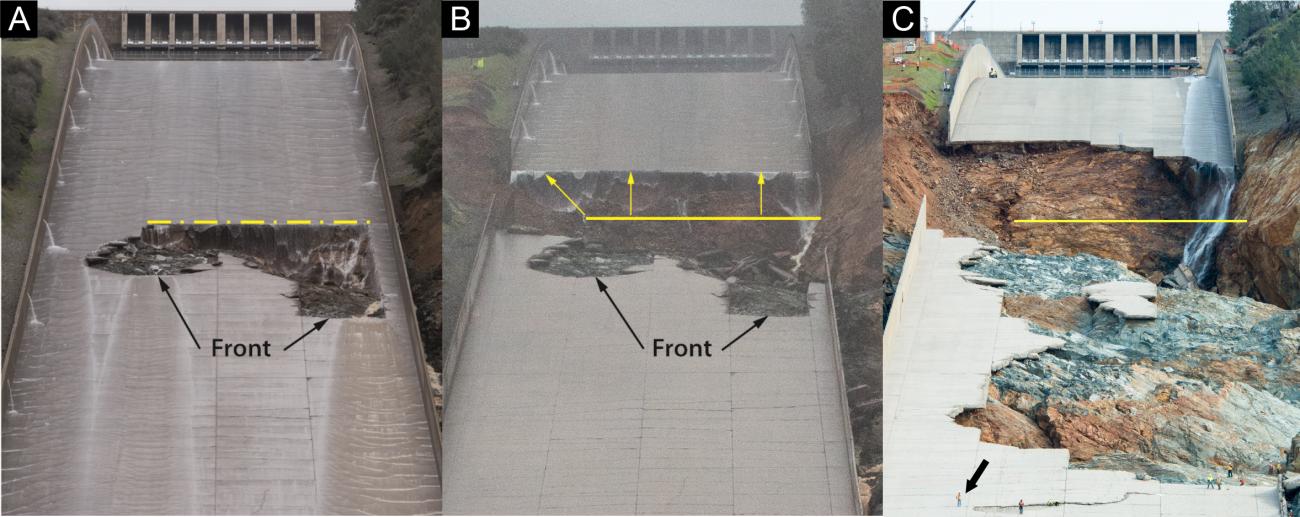
At the beginning of the crisis, there had been fears that the service spillway, initially damaged in its middle section (Figs. 2B,10A), would be affected by back-stepping erosion and collapse, thus attacking the dam itself. In fact, this happened at first (Fig. 10B), but most incision seems to have concentrated in the narrowed flow cross-section of the newly cut canyon next to the chute, with relatively minor headward propagation of erosion (Fig. 10C).
The initial cause of the damage at the main spillway, as well as the extent and mechanisms of subsequent erosion will be thoroughly investigated by engineers and geologists. Here appropriate technical and professional publications are to be expected.
The maximum flow or discharge rate attained in the bedrock incision at the main spillway – 2800 m3/s, reduced by the proportion of water that kept flowing over the chute – is comparable to smaller Icelandic glacial outburst floods (jökulhlaups), which have rates of 103 to 104 m3/s, and some orders of magnitude lower than a megaflood with rates of ≥ 106 m3/s.[v]
This event of observed erosion provides the rare opportunity to analyze the formation of a canyon and test models used to account for large-scale erosional features of the landscape. After all, the idea is still widespread that deep river canyons (e.g., Grand Canyon of Colorado) formed over prolonged geologic time by slow and gradual fluvial incision; in contrast, there are observational data that suggest the possibility of canyon formation during high-energy and rapid erosive events.[vi] Most importantly, the observation of bedrock erosion and formation of depositional bars over short time scales in a relatively localized area is a powerful miniature representation of what could be expected in the context of non-uniformitarian, large-scale water flows.
Endnotes
[i] An informative graphical and descriptive timeline of the events can be found in this report from the California Department of Water Resources: "Lake Oroville Spillway Incident: Timeline of Major Events February 4-25"; accessed on 09/20/2018.
[ii] Video clips showing the different phases of the crisis and the subsequent reconstruction efforts can be watched on the Oroville Spillway Incident YouTube page of the California Department of Water Resources.
[iii] Saucedo, G.J., Wagner, D.L., (1992). Geologic map of the Chico quadrangle, Regional Geologic Map 7A, California Division of Mines and Geology. Day, H.W., Bickford, M.E. (2004). Tectonic setting of the Jurassic Smartville and Slate Creek complexes, northern Sierra Nevada, California. GSA Bulletin, 116, 1515–1528.
[iv] For another example of rapid formation of coarse fluvial bars during flooding conditions, see Mosher, S.‐J., Martini, I. P. (2002). Coarse‐grained flood bars formed at the confluence of two subarctic rivers affected by hydroelectric dams, Ontario, Canada. In: Martini, I.P., Baker, V.R., Garzón, G. (eds.), Flood and Megaflood Processes and Deposits: Recent and Ancient Examples. International Association of Sedimentologists Special Publication 32, Wiley-Blackwell, Oxford, UK, pp. 213-231.
[v] See Baker, V.R. (2013). Global late Quaternary fluvial paleohydrology: With special emphasis on paleofloods and megafloods. In: Shroder, J., Wohl, E.E., (eds.), Treatise on Geomorphology, Fluvial Geomorphology, vol. 9, Academic Press, San Diego, pp. 511-527; Kotulla, M., (2014). Megafluten. Studium Integrale Journal 21, 4-11.
[vi] For a detailed discussion, see Ernst, M. (2010). Bildung eines Canyons in nur 3 Tagen. Studium Integrale Journal 17, 88-92.
Michael Kotulla, Dipl.-Geol.,
Studiengemeinschaft Wort und Wissen e. V., Baiersbronn, Germany
Ronny Nalin, PhD,
Geoscience Research Institute, Loma Linda, USA