All are aware that climatic changes occur in cycles measured in days, seasons, and years. A question more difficult to determine is whether climatic changes can occur over centuries. Evidence is reviewed which demonstrates that around 1450 AD, the northern hemisphere experienced a significant cooling which lasted approximately 400 years. Increase in the severity of winters, famine and disease, the advance of glaciers, the shortening of growing seasons, plus a host of other factors attest that this time period was cooler than our present time. In the mid-1800s this trend was reversed and the average mean temperature of the earth began to increase. The causes of this cooling are obscure and unknown. The most likely candidates are a decrease in sunspot activity or an increase in the amount of atmospheric pollutants, perhaps caused by volcanic activity.
Have climatic changes taken place over centuries? If so, what were the causes and effects?
INTRODUCTION
The changeability of weather is a phenomenon known to all who live on Earth. Daily fluctuations in temperature, moisture and wind represent the most rapid weather changes that we experience. Changes in weather patterns through the seasons, the annual cycles, as well as multi-annual cycles are generally predictable. Spring does, in fact, follow winter year after year. Climate is defined as the composite of all the components that determine weather in a particular area averaged over time (i.e., a number of years). A particular region can be defined by the dominant weather feature(s) which affect the environment to the greatest extent: polar, monsoon, desert, tropical, etc. While a climate is described in terms of certain weather features, the presence of anomalies such as an unusual rainstorm or high-velocity wind need not change one's opinion about the overall climate for a specific region. In other words, extremes in a particular weather factor can be included just as long as the measurable weather characteristics approximate some average value over long periods of time.
Long-term climate changes measured in decades or centuries are difficult to quantify. Reminiscences of old-timers who recount the rigors of winters in the olden days are often taken with the proverbial grain of salt. Yet such comments do indeed raise the question: Has the climate in different parts of the earth changed over the centuries? The answer appears to be yes, but the basis for this answer is complex and, of necessity, relies on inferential data. It is the purpose of this article to examine a postulated climatic change in recent history. More specifically we shall analyze a time spanned by the dates 1450 AD to about 1850 AD when, at least in the Northern Hemisphere, there appeared to be temperatures much cooler than at present, a time which some have named the "Little Ice Age."
As we examine this topic, it will be seen that evidence for a significant fundamental climatic change is substantial, but and perhaps more interestingly the specific reasons for this change are not understood. It is hoped that the reader will gain an appreciation for the very delicate balance that allows life on Earth to continue, and for the serious changes in this balance that could result from catastrophic events.
There are certain difficulties in attempting a historical study of climate because the most common instruments of today such as the thermometer, wind gauge, barometer and rain gauge are all of quite recent development or only relatively recently came into continuous and extensive use for climatic measurements. Therefore, in order to deduce the climate in past centuries, inferential data must be taken from records intended for other purposes. These include shipping logs, taxation schedules, settlement or community histories, crop production records and, interestingly, information from literature and art.
The name "Little Ice Age" implies that there was also a significantly larger ice age. Several large-scale ice movements are postulated to have occurred in the Pleistocene epoch. Evidence suggests that the polar ice caps extended significantly further from the poles than they do now. In the Western Hemisphere, much of Canada and a portion of the northern United States show evidence of glaciation: glacial soils, scouring marks and striations on rocks, moraines, and erratic boulders moved far from their site of origin. All these testify to the presence of a significant amount of ice and its large-scale movement.
The Little Ice Age is not characterized by similar amounts of polar ice so far south but rather by a period of several hundred years in which the winters were particularly severe in the Northern Hemisphere. In addition, other climatic features such as cooler summer temperatures, changes in the amount of rainfall and major shifts in wind patterns were observed. There were significant changes in the size of glaciers in the mountains.
The period just before the Little Ice Age 1100-1300 also presents a weather anomaly. It was characteristically different from the present day in that average temperatures were higher. Thus a more marked shift to a colder time is more visible in the historical record.
HISTORICAL INDICATORS OF CLIMATIC CHANGE
Let us first examine the effect of climatic changes as indicated by plants and animals. The cultivation of grapes for wine making was extensive throughout the southern portion of England from about 1100 to around 1300 (Lamb 1965). This represents a northward latitude extension of about 500 km from where grapes are presently grown in France and Germany. Grapes were also grown in the north of France and Germany at this time, areas which even today do not sustain commercial vineyards. The grape production in England was more than that of local farmers for their own use. The amount of wine produced in England during this period was substantial enough to provide significant economic competition with the producers in France. With the coming of the 1400s, temperatures became too cold for sustained grape production, and the vineyards in these northern latitudes ceased to exist. It is interesting to note that at the present time the climate is still unfavorable for wine production in these areas.
Estimates can be made as to the average temperature differences between the warm period and the centuries which followed. In this warm time, vineyards were found at 780 meters above sea level in Germany. Today they are found up to 560 meters. If one assumes a 0.6-0.7ºC change/100 meter vertical excursion, these data imply that the average mean temperature was 1.0-1.4ºC higher than the present. For the successful production of grapes a frost-free spring is required after the blossoms are finished. Additionally a warm summer and autumn are required to increase the sugar content. Harvesting should be accomplished before the first fall frost.
A further botanical evidence which suggests a climatic shift to a colder time is the lowering of the tree line by 70 to 300 meters in the Alps (Lamb 1977, p. 436). This observation is supported by the remains of peat deposits and forests at higher elevations than they presently occur. A similar 100-200 meter lowing of the tree line also occurred in Northern Germany. Iceland experienced a 300 meter lowering of the tree line to the present day levels (Lamb 1977, p. 228). Birch tree trunks are still being expelled at the termini of Icelandic glaciers. In addition, the decrease in temperature resulted in lower-altitude requirements for fruit-and-grain crop production areas and an extension of 20 days for the average grape ripening time.
Human remains in Norse burial grounds located in Greenland have been found which are now in permanently frozen soil. This suggests an average local temperature at the time of Norse occupation 2-4ºC higher than at present. Additionally, the finding of plant roots at this same level supports this supposition, since the permafrost layer provides a barrier to growth. There is evidence that American Eskimos occupied areas in the north of Greenland, on Ellesmere Island and the New Siberia Islands. At these locations, large dwellings made from driftwood have been found. There is also archeological evidence of large villages that were developed for whaling and fishing. These settlements eventually were forced south by climatic change until they came in contact with Viking colonies in southern Greenland. Conflict occurred, and the Viking colonies eventually died out in the 1400s (Lamb 1977, p. 248). Communication with Europe was abandoned in 1410 and not re-established until the 1720s. Europeans did not recolonize there until the 1800s. The excavation of Viking colony sites on Greenland has shown the presence of corn pollen, which implies cultivation of this crop. Historical records predating the Little Ice Age also suggest that grain was grown in the Viking colonies, an occupation not attempted again in this region until the present century (Lamb 1977, p. 257).
Grain growing in Iceland was given up in the 14th century. In 1695 sea ice completely surrounded Iceland except for one port. Even from the highest mountains, open water could not be seen in all directions (Figure 1h) (Lamb 1977, p. 453). This and later sea ice flows resulted in the island getting its present name.
Glaciers can provide a record of long-range weather conditions. Glaciers begin their life in snowfields at high elevations. The compacted snow flows by gravity to form a river of ice. At the lower elevations the ice at the terminal end of the glacier breaks off (calves) and melts away. If the average temperatures become warmer, there will be a transition in which the rate of melt is greater than the rate of formation, and the glacier will diminish in size and recede to higher elevations. The opposite transition will occur if average temperatures become cooler, provided the moisture supply is maintained.
While it is not possible to look back into history and say that the cooling trend began in a particular year or even decade, certain phenomena can act as harbingers of these trends. Glacial advances in Europe began about the mid-13th century. Habitable structures which were once at high altitudes in the Alps were destroyed by glacial activities. Extension of glaciers continued into the 16th century. For example, a glacier blocked the Saas valley, including its river, in 1589 and eventually formed a lake (Lamb 1977, p. 9). Ponded water from the river soon broke through the ice and caused flooding. Similar events were repeated in this area numerous times in the next two centuries. In the late 1500s, land and property were destroyed in Chamonix (France) by glacial action.
Glacial advances in North America occurred from 1711-1724 and 1835-1849 (Lamb 1977, p. 453). Increase in the amount of Arctic sea ice resulting from calving of more northern glaciers also was observed. Once-productive Icelandic farms were covered by advancing glaciers. So serious was the climatic change experienced by Icelanders that Denmark, the parent country, considered evacuating all the islanders and re-settling them in Europe.
The change in climate during these years can also be deduced by the economic conditions in the affected lands. Such perturbations can greatly affect crop production and animal husbandry. The availability of varieties of seed with tolerances for extremes of cold or heat, wetness or drought as are found in the present day was, of course, unknown centuries ago. Thus it is possible to detect climatic changes by measuring productivity or its absence famine.
Warm climatic conditions are generally accompanied by a tendency towards dryness resulting from reduced rainfall and increased evaporation. If seasons are cooler than usual, rainfall increases (cooling favors increased condensation of moisture-laden air), and there is also a reduced level of evaporation after the rain has fallen.
In the middle of the Little Ice Age (ca. 1700), there was famine in the higher elevations of Scotland (Lamb 1977, p. 11). Each grain crop requires several conditions before a successful growing season and harvest is possible. Minimum temperatures are necessary for seed germination. Higher altitudes are more susceptible to adverse climatic cooling. Frost will occur later in the spring and earlier in the fall causing a shortened growing season. Increased cloud cover and cool weather retard the growing process and prolong the ripening of the grain. In addition, if the summer remains wetter than usual, grain crops may not be able to mature by drying out. If an early frost comes, the still-moist grain will suffer damage. Thus, a cooling trend can affect the growing plant in several ways, compounding the possibility of crop failure.
Using a variety of indicators, Lamb (1965) has synthesized a temperature profile of the average mean temperatures in England from about 1100 AD to the present (Figure 1a). This estimate was based on a wide variety of data such as economic values of produce and severity of winters recorded in historical records, to list a few (Figure 1b,c). For example, in the years of the Little Ice Age the price of grain increased over five times, imposing an obvious hardship on the poor (Figure 1d).
It is estimated that in the coldest decades of the Little Ice Age the growing season was shortened by 3-4 weeks (Manley 1957). This may represent an approximate reduction of 20% of the total growing season which would range from May to September in the northern latitudes. Significant crop production differences result from small temperature changes. In Iceland in the late 1950s the mean April-October temperature was 7.6ºC, resulting in a 4.33 metric ton/acre hay yield. In 1966 for the same time period, the mean temperature was 6.8ºC and the hay yield was 3.22 tons/acre.
Exceptionally grim reports of mass deaths are frequent in the literature of this time. There were population decreases in large portions of Europe. While diseases such as bubonic plague (Black Death) definitely had their effect, the generally weakened health of the people in years of poor harvest must certainly be considered. In fact, population declines attributed to low food levels began 40 years before the plague arrived (Lamb 1977, p. 455). Support for climatic difficulties affecting the lives of people can also come from a variety of other sources. For example, the number of days that prayers for rain were offered increased during this time in a certain city in Spain. Crop production values and census data for domestic animals likewise imply harsh conditions. Tax receipts indicate an increase in the number of abandoned lands and villages further suggesting an unusual occurrence (Lamb 1977, pp. 459-473).
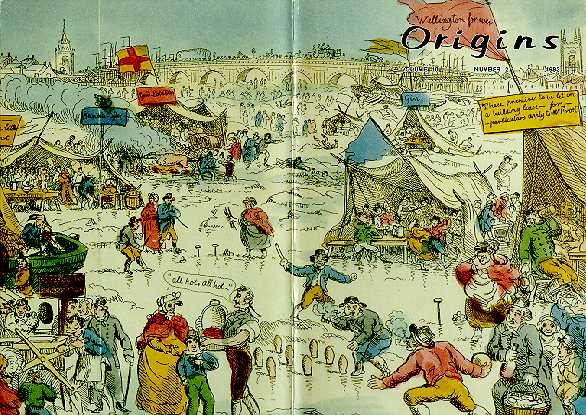
During this time of exceptionally severe winters, the Baltic Sea and major rivers such as the Thames froze over (see cover picture) (Lamb 1977, p. 570). It is also interesting to note that in the paintings produced during this time, the percentage of open sky decreases and the cloud cover increases, suggesting that the contemporary artists were inadvertently recording the effects of the Little Ice Age (Lamb 1967).
FIGURE 1a. Estimated mean yearly temperatures based on a variety of climatic, political and social indicators. Redrawn from Lamb 1977.FIGURE 1b. Winter severity and summer dryness for northern Europe. Redrawn from Lamb 1977, p. 440.FIGURE 1c. Weather patterns as a function of winter severity as measured in Paris and London. Redrawn from Schneider and Mass 1975.FIGURE 1d. Average price of wheat expressed in gilders. Redrawn from Lamb 1977, p. 440.FIGURE 1e. Record of changes in 180 values preserved in ice core from Camp Century, Greenland. Redrawn from Schneider and Mass 1975.FIGURE 1f. Average tree-ring widths of bristle cone pines from the White Mountains, California. Redrawn from LaMarche 1974.FIGURE 1g. Changes in carbon-14 abundance in wood samples as a function of sunspot number. Redrawn from Eddy 1977.FIGURE 1h. Variation in amount of polar ice seen from Iceland. Redrawn from Lamb 1977, p. 452.
PHYSICAL INDICATORS OF THE LITTLE ICE AGE
We have now looked at the economic and social records that imply the presence of the Little Ice Age. I shall next examine a variety of physical evidences that also seem to promote this idea.
Plants incorporate various atoms (carbon, hydrogen and oxygen) from their surroundings into their structure. Once incorporated, these atoms no longer exchange with those in the environment unless decay sets in. Thus the chemical composition of a plant can give a fingerprint of the climatic conditions under which it grows. In the natural world there are different isotopes of carbon, hydrogen, and oxygen. These isotopes vary in their weight as well in their relative abundance. The ratio of incorporation of these various isotopes into the plant is a function of temperature (Libby and Pandolf 1974). As can be seen in Figure 1e changes occur in the years of the Little Ice Age. It is also interesting to note the increase in concentration of 14C during this time. This later observation may provide a clue as to the cause for the Little Ice Age.
Additional isotopic evidence in ice cores from Greenland also suggest a cooling during this time (Figure 1e). In water the most abundant form of oxygen has a weight of 16. The rarer form oxygen 18 is present in only small amounts. If one measures the change in the 18O/16O ratio in the water of the ice, changes occur that correspond with theoretical predictions about rates of incorporation with respect to temperature (Libby 1972).
Tree rings also provide supportive evidence for the Little Ice Age. The width of a ring measures how favorable the climate is for growth, i.e., the wider the ring, the more favorable the conditions; the narrower, the less favorable for growth (LaMarche 1974). Figure 1f shows that in the warmer and more favorable years the width increased, while in the years postulated for the Little Ice Age the width was reduced. A subsequent recovery is shown in the last century.
Similar studies of a coral which exhibits yearly growth bands again yielded isotope data suggesting that average mean water temperatures during the Little Ice Age did indeed decrease by about 1ºC (Druffel 1982).
POSSIBLE CAUSES OF THE LITTLE ICE AGE
While it is relatively easy to find evidence for a general cooling trend, it is more difficult to define the cause(s) for this phenomena. More likely, it is the result of several factors. Before we examine these, a brief discussion of the energy structure of Earth is necessary.
The sun, obviously, is the source of energy for this planet. Fluctuations in the amount of energy absorbed by the Earth will cause variations in the total amount of heat retained or lost. Particulate matter in the atmosphere which blocks some of the incoming energy has been observed to promote a cooling trend for short periods of time. This particulate matter until the present century was largely a result of volcanic activity. Recent industrial pollution is proposed as a cause of the recent cooling trend that began in the 1950s. The explosions of volcanoes in the 19th century have been correlated with a subsequent coolness in the weather in the following years. The explosion of Tambora in 1815 which catapulted 150 cubic kilometers of rock dust is given credit for "the year without summer" in 1816. The explosion of Krakatoa in 1883 presumably lowered the mean earth temperature about 1ºC for several years (Rampino and Self 1982). The presence of this particulate matter may increase the amount of precipitation, because the ejected material acts as condensation nuclei around which water droplets can form. Without these nuclei the air becomes supersaturated.
In addition to particulate matter being ejected, perhaps even greater absorption of the sun's rays is due to absorption by ejected sulfur compounds (Pollack et al. 1976). These sulfur compounds eventually form fine droplets of sulfuric acid which may remain suspended for years in the upper atmosphere, forming large clouds which reduce the penetration of the sun's energy. Because of the ejection of an aerosol into the upper atmosphere by the volcano El Chichon which exploded in Mexico in 1982, several meteorologists predicted a winter colder than usual for 1982 (Kerr 1982). Whether the action of volcanoes is responsible for a cooling that lasted several hundred years is debatable. It seems unlikely that a single volcanic event would be great enough to cause such a cooling effect. History does not record such a single large event but does record many smaller events which occurred in various parts of the world at frequent intervals.
After the cooling event has begun, it can, to some extent, become self-perpetuating. With increased snow cover the amount of energy absorbed by the earth is reduced. Up to 80% of the incoming radiant energy normally captured can be lost due to the reflectivity of the snow and ice (Lamb 1977, p. 285). This is a significant loss of potential heat, further exacerbating the cooling effect. The polar latitudes are a constant area of heat loss for the global system. In summer the amount of heat absorbed is not equal to the amount lost during the winter. Were it not for an equal overbalance in the equatorial regions where heat gain is 2.5 times greater than heat loss, the Earth would become increasingly colder. The mixing of the excess equatorial heat with the overall heat deficit in the northern latitudes promotes a stable environment that can be maintained even in latitudes where there is net heat loss, e.g., the temperate zones.
The presence of large bodies of water such as oceans tends to balance the cooling trend on the land masses. As the air and water temperatures cool, less moisture is evaporated into the atmosphere resulting in less rain or snow. If precipitation is less, a relative increased melting of previously fallen snow can take place.
Warming of the atmosphere can result from an increase in the CO2 levels. The effect of CO2 on climate is a topic of considerable interest at the present time (see Revelle 1982 as an example of support; Madden and Ramanthan 1980 for negative evidence). Briefly, as the sun shines on Earth, unabsorbed light waves are reflected back into the atmosphere in the form of longer wavelength energy. The CO2 in the atmosphere absorbs some of this infrared radiation, resulting in increased molecular motion or heat which in turn causes a warming of the atmosphere and ultimately the earth itself. This "greenhouse effect" has provoked some to become alarmists fearing that warming due to increased CO2 in the atmosphere as a result of burning fossil fuels will cause the polar caps to melt, thereby raising the average level of the oceans and also increase the area of deserts. It might be suggested that the Industrial Revolution's intensified burning of coal and wood increased the atmospheric CO2 sufficiently to hasten the end of the Little Ice Age.
Another theory for the cause of the Little Ice Age centers not on the atmospheric restriction of the amount of energy flowing into the earth, but on the concept that the sun itself is variable in its energy production. It is estimated that a fluctuation of only a few tenths of 1% in energy output would be sufficient to produce significant changes in climate (Budyko 1969). An interesting coincidence held meaningful by many is the absence of sunspot activity through most of the latter and most severe period of the Little Ice Age (Eddy 1976). While accurate astronomical records are increasingly difficult to obtain as one moves back in history, there is yet a convincing amount of data which allows one to have confidence in the historical sunspot record.
At present sunspots large areas of reduced surface temperature and increased magnetic field strength increase and decrease numerically through an approximately 11-year cycle. These changes in solar magnetic field also affect the rate at which 14C is produced on earth and may provide a retrospective record of variations in sunspot activity (Figure 1g). Observations from the 1700s to the present have established a remarkable regularity in sunspot activity. Over the years there have been numerous attempts to correlate these cycles with weather cycles. While sunspot/weather analysis has not produced a consistent correlation, it is widely accepted that sunspot activity does indeed influence the weather. However, an interesting near absence of sunspot activity is found in the early decades of the 1600s extending into the first decade of the 1700s. This time corresponds remarkably with the coldest period of the Little Ice Age.
CONCLUSIONS
In conclusion there is ample evidence that a significant cooling occurred for several centuries starting around 1450 AD. This cooling caused significant changes in the distribution of plant and animal life and in the way man responded to the environment. The causes for this cooling may have derived from a combination of changes in the energy output of the sun and changes in the atmosphere of the earth which resulted from volcanic activity that reduced the amount of energy absorbed.
This uncertainty as to the cause for this cooling which so markedly affected life should warn those who demand that the Earth responds only to massive (forceful) events. Very subtle changes in the factors determining climate during the Little Ice Age occurred. One wonders how much greater they need be to cause a true ice age.
LITERATURE CITED
Budyko, M. I. 1969. The effect of solar radiation on the climate of the earth. Tellus 21:611-619.
Druffel, E. M. 1982. Banded corals: changes in oceanic Carbon-14 during the little ice age. Science 218:13-19.
Eddy, J. A. 1976. The Maunder Minimum. Science 192:1189-1202.
Eddy, J. A. 1977. The case of the missing sunspots. Scientific American 236(5):80-92.
Kerr, R. A. 1982. El Chichon forebodes climate change. Science 217:1023.
Kukla, G. and J. Gavin. 1981. Summer ice and carbon dioxide. Science 214:497-503.
LaMarche, Jr., V. C. 1974. Paleoclimatic inferences from long tree-ring records. Science 183:1043-1048.
Lamb, H. H. 1965. The early Medieval warm epoch and its sequel. Paleogeography, Paleoclimatology, Paleoecology 1:13-37.
Lamb, H. H. 1967. Britain's changing climate. Geographical Journal 133:445-468.
Lamb, H. H. 1977. Climate Present, Past and Future. Volume 2. Climatic history and future. Methuen, London.
Libby, L. M. 1972. Multiple thermometry in paleoclimate and historic climate. Journal of Geophysical Research 77:4310-4317.
Libby, L. M. and L. S. Pandolf. 1974. Temperature dependence of isotope ratios in tree rings. Proceedings of the National Academy of Sciences (USA) 71(6):2482-2486.
Madden, R. A. and V. Ramanthan. 1980. Detecting climate change due to increasing carbon dioxide. Science 209:763-768.
Manley, G. 1957. Climatic fluctuations and fuel requirements. Scottish Geographical Magazine 73(1):19-28.
Pollack, J. B., O. B. Toon, C. Sagan, A. Summers, B. Baldwin, W. Van Camp. 1976. Volcanic explosions and climatic change: A theoretical assessment. Journal of Geophysical Research 81(6):1071-1083.
Rampino, M. R. and S. Self. 1982. Historic eruptions of Tambora (1815), Krakatau (1883), and Agung (1963), their stratospheric aerosols, and climatic impact. Quaternary Research 18:127-143.
Revelle, R. 1982. Carbon dioxide and world climate. Scientific American 247(2):35-43.
Schneider, S. H., and C. Mass. 1975. Volcanic dust, sunspots, and temperature trends. Science 190:741-746.
COVER PICTURE An artist's depiction of "Frost Fair or Rural Sports on the River Thames, February 5, 1814." Such frost fairs on the Thames were significant social events during a time of climate cooling known as the Little Ice Age (see pp. 51-65). This photograph and others in the article are taken from Print Box 980 and are reproduced by permission of the Huntington Library, San Marino, California.
A poetic celebration of a cold winter during the Little Ice Age.
A poetic celebration of a cold winter during the Little Ice Age.
Newspaper reports of activities while the Thames was frozen.