VISUALIZING BARAMINIC DISTANCES USING CLASSICAL MULTIDIMENSIONAL SCALING
Todd Charles Wood wood@bryancore.org Center for Origins Research and Education Bryan College, Dayton, TN 37321
WHAT THIS ARTICLE IS ABOUT
Baraminology methodology continues to mature, and in this article, the multivariate technique of classical multidimensional scaling is introduced to baraminology. The technique is applied to three datasets previously analyzed in baraminology studies, a Heliantheae/Helenieae (Asteraceae) dataset, a fossil equid dataset, and a grass (Poaceae) dataset. The results indicate that classical multidimensional scaling can confirm and illuminate previous baraminological studies, thereby strengthening identifications of baraminic units.
Although Frank Marsh introduced the term baramin in 1941, the concept and its application to creation biosystematics was not developed further until its revision as baraminology in the 1990s. By releasing creation biosystematics from its dependence on interspecific hybridization, baraminology explicitly allowed and encouraged the development of novel baraminology techniques. In 1992, Wise published the first baraminological study on turtles explicitly aimed at detecting discontinuity (Wise 1992). In 1998, Robinson and Cavanaugh introduced a technique based on the baraminic distance, a simple measure of organismal similarity. They applied the technique to catarrhine primates (1998b) and felids (1998a). More recently, Cavanaugh developed the multidimensional projection technique Analysis of Patterns (ANOPA), which has been utilized in several baraminological and systematic studies (Cavanaugh & Sternberg 2002; Cavanaugh & Wood 2002; Cavanaugh et al. 2003; Wood & Cavanaugh 2001; Wood & Cavanaugh 2003).
Baraminic distance and ANOPA both utilize coded sets of characteristics that describe taxa of interest, such as could be used in a cladistic analysis. Baraminic distances are the number of characters in which two taxa differ, expressed as a fraction of the total characters analyzed. Baraminic distances between taxa can then be correlated by linear regression, yielding both a correlation coefficient and a probability. Significant positive correlation indicates taxa which are very close in character space, while significant negative correlation indicates taxa very far apart. Robinson and Cavanaugh (1998b) proposed that significant positive correlation indicates taxic continuity and significant negative correlation indicates taxic discontinuity.
Analysis of Patterns, in contrast, treats characters as separate spatial dimensions, with each taxon represented as a point in n-dimensional space, where n is the number of characters. ANOPA calculations then project the n-dimensional taxic pattern onto three dimensions, much in the same way that light projects shadows of three-dimensional objects onto two-dimensional surfaces. The three-dimensional taxic pattern of subtribe Flaveriinae is a trajectory structure, implying that the taxa belong to the same baramin (Wood & Cavanaugh 2003). The 3D ANOPA analysis of results on a dataset of fossil equids matches closely the inferred phylogeny of family Equidae and correlates with the stratigraphic appearance of the taxa (Cavanaugh et al. 2003), strongly implying that the equids belong to a single baramin.
Statistical baraminology methods have the potential to overcome limitations of other creationist systematics techniques. Marsh’s hybridization-based method (Marsh 1947), although adopted and applied by German creationists (Scherer 1993), cannot be applied to asexual or fossil organisms or to organisms that are not known to hybridize (Scherer 1998). In contrast, statistical baraminology methods have been successfully applied to fossil equids as noted above (Cavanaugh et al. 2003). Further, studies of groups with few known hybrids, such as the felids, have been conducted (Robinson & Cavanaugh 1998a) and are currently underway. As a result of these developments, creationists can apply their own systematics methods to the full diversity of life for the first time in history.
Statistical baraminology methods also have their drawbacks. For example, Robinson and Cavanaugh (1998b) found significant, positive baraminic distance correlation between humans and primates when using molecular data. This violated their proposal that significant positive correlation indicated taxic continuity. Wood (2002) found a similar phenomenon when analyzing morphological and molecular datasets of the grasses. Significant negative correlation could be detected only with the morphological dataset but not with the molecular dataset of the same taxa. Wood interpreted his results and those of Robinson and Cavanaugh to indicate that discontinuity and continuity should be detected holistically, without an overrepresentation of a single type of characters (e.g., molecular).
Even with morphological character sets, ambiguous patterns of negative and positive correlation have been found. Cavanaugh et al.’s (2003) analysis of a fossil equid dataset revealed positive correlation that linked Hyracotherium to Equus through two other taxa (Hyracotherium is positively correlated with Mesohippus, which is positively correlated with Parahippus, which is positively correlated with Equus). Hyracotherium and Equus share significant negative correlation when compared directly. Cavanaugh et al. reasoned that contradictory correlation patterns (such as two taxa that could be positively and negatively correlated) could arise from a group of taxa that adopted an unusual shape, such as a line, in biological character space.
One approach to explain anomalous results of statistical baraminology methods is to utilize different methods on the same set of taxa. As Wood and Murray (2003) have argued, a plurality of methods applied to a single group should converge on the same baraminic identification and therefore provide consilient support for the baraminic membership. In practice, many modern baraminological studies have relied on multiple methods (Cavanaugh et al. 2003; Robinson 1997; Wood & Cavanaugh 2001), most notably ANOPA and baraminic distance correlation.
Because of the importance of methodological diversity, the development of novel baraminological methods should be encouraged. In this article, I apply the standard technique of classical multidimensional scaling (also called principle coordinate analysis) as a statistical baraminology method. Multidimensional scaling converts distance data for a given set of points into a set of k-dimensional coordinates, where k is a predetermined dimensionality. When applied to baraminic distances, a three-dimensional set of points representing the taxa can be generated and visualized using 3D viewing software. By revealing three-dimensional patterns, multidimensional scaling resembles 3D ANOPA. Whereas ANOPA calculates 3D patterns directly from character data, multidimensional scaling requires baraminic distances to summarize character data. As a result, multidimensional scaling can serve as an independent verification of 3D ANOPA patterns, while also providing a novel means of visualizing baraminic distances.
METHODS
A full presentation and explanation of multidimensional scaling is beyond the scope of this paper. For a detailed discussion, see Cox and Cox (1994). Briefly, given a set of n objects, between each pair (r, s) of which is a measurement of dissimilarity δrs, multidimensional scaling seeks a k-dimensional set of points, each of which corresponds to one of the n objects and between which the distance in Euclidean space drs is very close to the dissimilarity δrs. Classical scaling begins with Euclidean distances as dissimilarities and recovers a set of points for which drs= δrs.
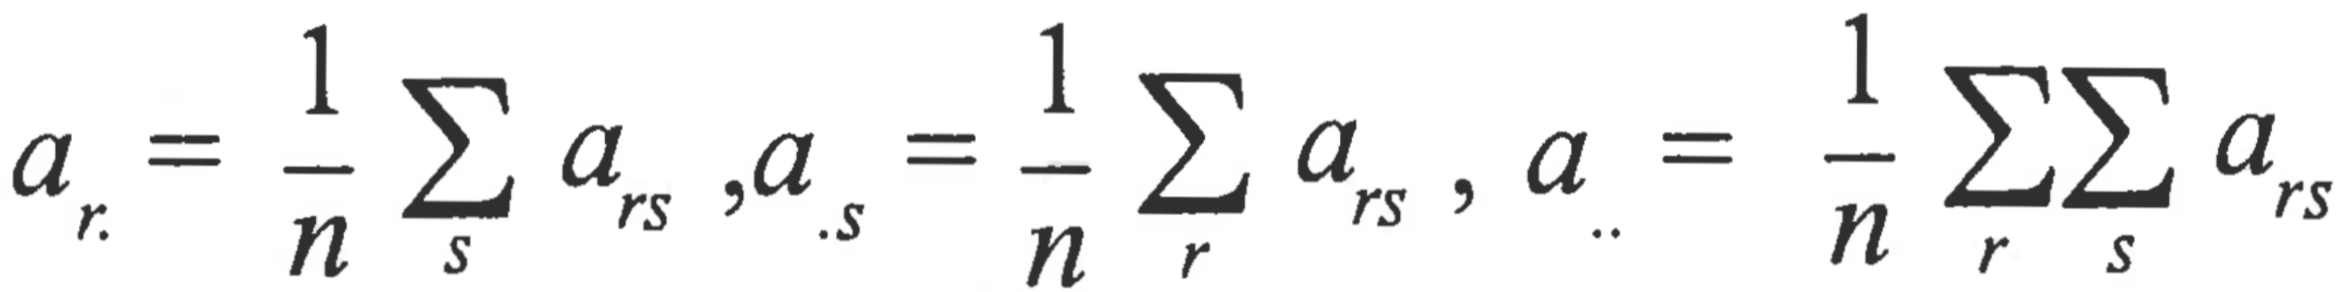
To calculate k-dimensional coordinates given a matrix D of dissimilarities drsusing classical scaling, calculate a matrix A, such that ars=-0.5δrs2. Doubly center A, giving B, where brs=ars -ar. -a.s +a.. , and
Calculate eigenvalues and eigenvectors of B. The matrix X of k-dimensional coordinates is then calculated as X = Vk Lk 1⁄2, where Vk is a matrix of the first k eigen vectors and Lk1⁄2 is a diagonal matrix of the square roots of the first k eigenvalues. When D is a matrix of Euclidean distances, the k-dimensional coordinates correspond exactly to the first k principal components.
As mentioned above, to convert δrs to drs such that δrs = drs, the matrix of dissimilarities D must be Euclidean, with drr = 0 for all 1 <r <n. Whereas Euclidean distances are used in Analysis of Patterns, baraminic distances are by definition not Euclidean, but they could be metric, are symmetric, and drr = 0 for all 1 <r <n. Because the baraminic distance is defined as the number of different character states divided by the number of known character states, all states in which either taxa being compared have an unknown state are eliminated from the calculation. Thus in any given matrix, the denominator for the baraminic distance varies according to the number of known character states. As a result, the resulting matrix of baraminic distances must be tested to determine if it is metric (see below).
Although baraminic distances do not fulfill the strict requirements of classical scaling, they can be converted to a metric matrix by addition of a constant c, where c< the maximum δrs. Even with a non-Euclidean, non-metric D however, Cox and Cox (1994) note that some statisticians “argue that classical scaling is still appropriate as an exploratory data technique for dimension reduction” (p 28). Following these suggestions, I have applied classical multidimensional scaling to uncorrected (nonEuclidean, non-metric) baraminic distance matrices and to baraminic distances corrected by the addition of the maximum baraminic distance for the given matrix (resulting in a metric matrix).
One might argue that to use classical multidimensional scaling in baraminology, a Euclidean measure of dissimilarity could be introduced, thus justifying the use of classical scaling and resulting in the equality δrs = drs . For this paper, I prefer to utilize the previously defined baraminic distances for two reasons. First, as noted above, baraminic distance has already been defined and utilized in numerous baraminology studies. Whereas introduction of a Euclidean distance would be more appropriate to the technique, utilization of classical scaling on baraminic distances maintains continuity with the existing literature. Second, because Euclidean distances were already used in calculation of threedimensional ANOPA structures, I sought an alternative, non-Euclidean measure of dissimilarity in order to evaluate 3D ANOPA results.
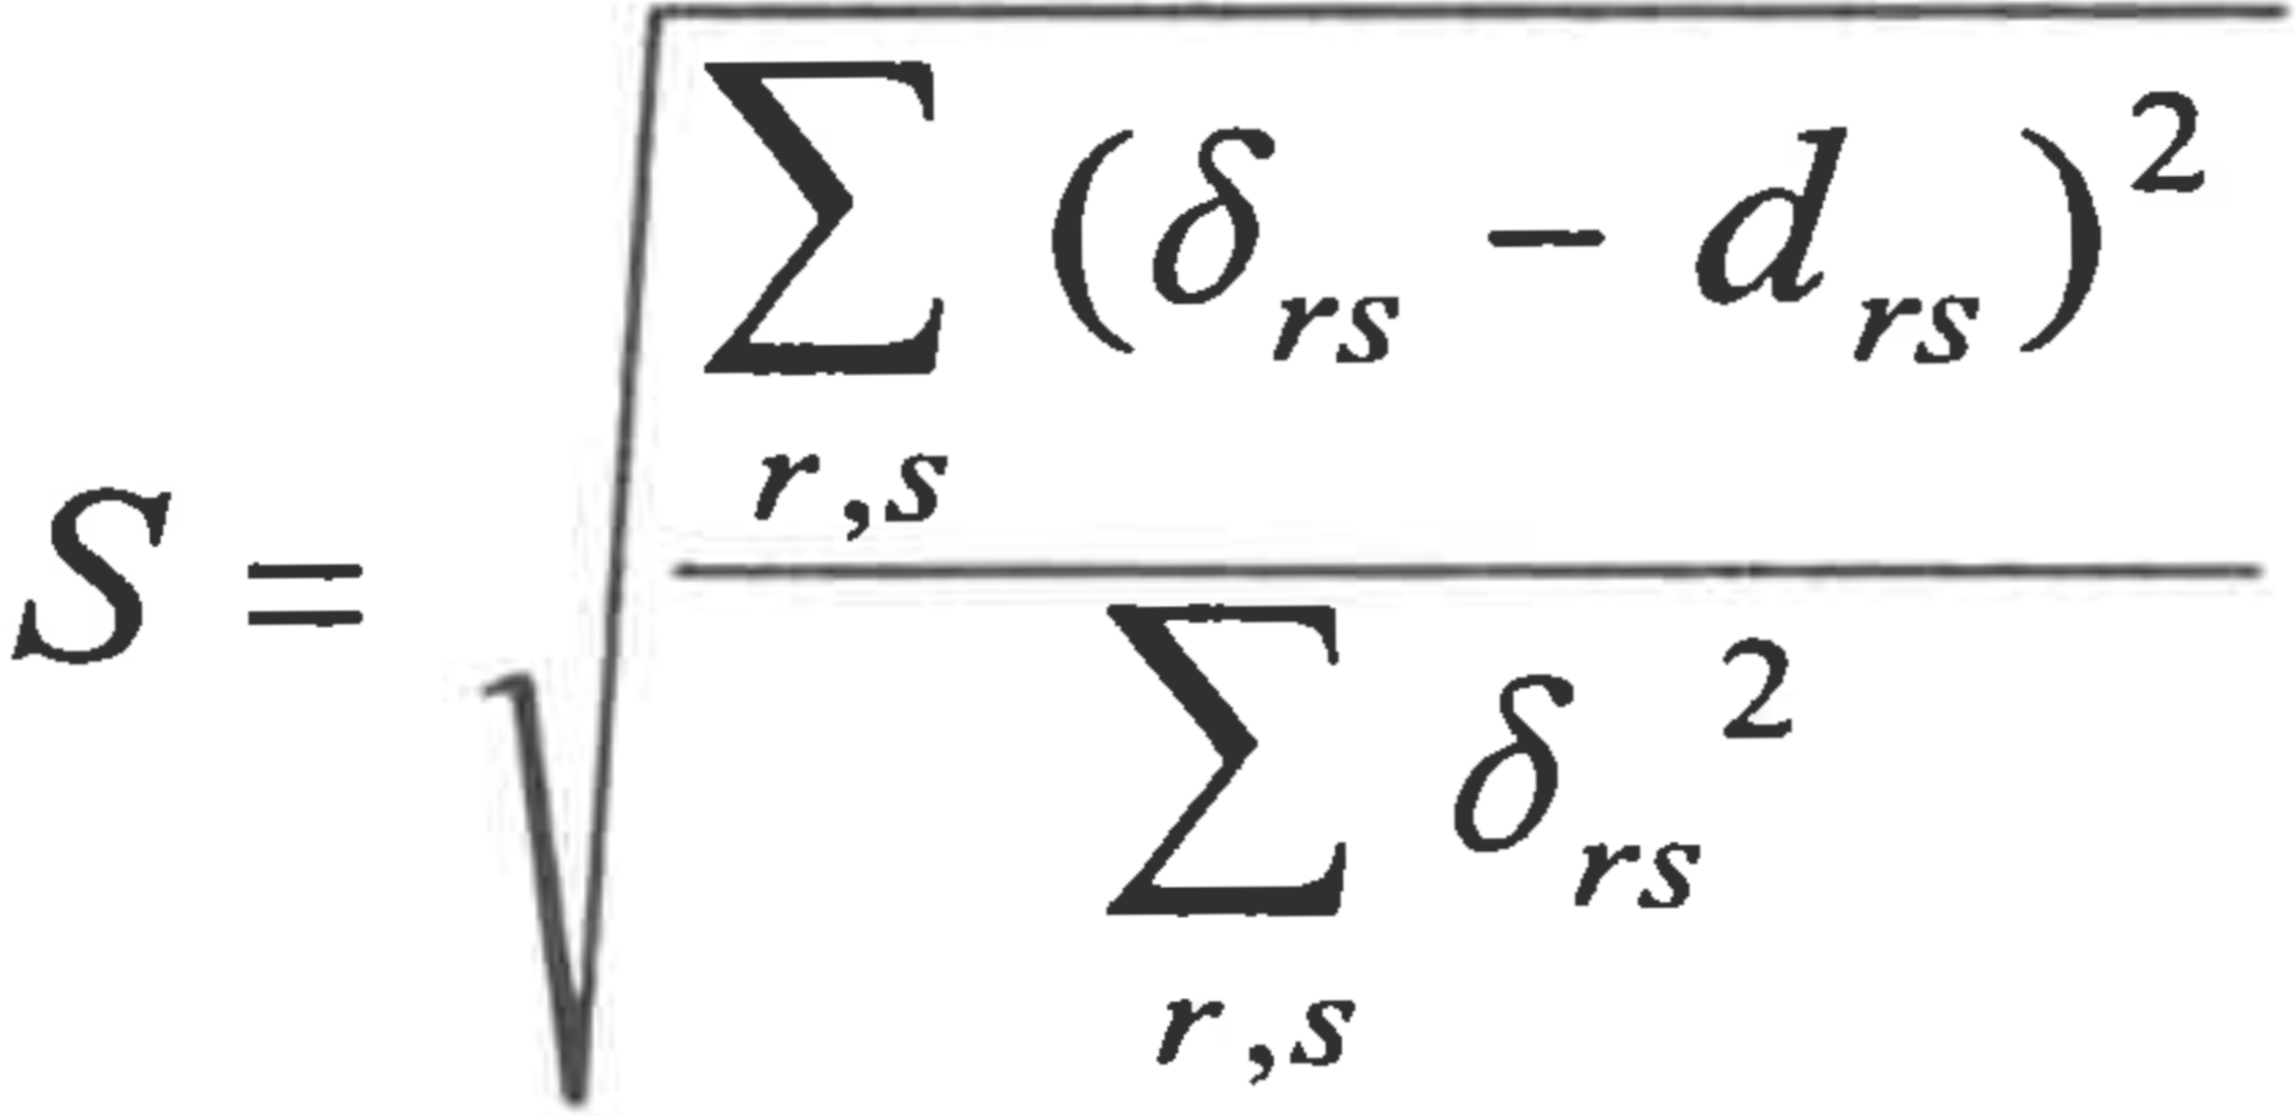
Because baraminic distance matrices are not Euclidean and not necessarily metric, scaled distances only approximate the baraminic distances (i.e., δrs ~_ drs ), and there is a potential for generating scaled distances that poorly represent the baraminic distances. Consequently, I use two different measures of “goodness of fit” between the scaled distances and the baraminic distances. The first is a “stress” measure suggested by Venables & Ripley (1997, p 385), which strongly resembles Kruskal’s stress function for nonmetric scaling (Cox & Cox 1994, p 4450), where distances and disparities are replaced with dissimilarities and distances respectively. Thus “stress” is here defined as
Smaller stress values indicate a better match between scaled distances and baraminic distances. For the second measure of fit, I calculate a linear correlation between the scaled distances and baraminic distances, as suggested in Ramsay (1982). If they match well, the correlation coefficient and slope should be near one, and the intercept should be near zero.
Baraminic distances were calculated using the BDIST software, as previously described (Wood 2002). For all baraminic distance calculations described in this paper, the relevance cutoff was set at 0.95. All multidimensional scaling calculations were done using the cmdscale function in S-Plus version 4.0 (Insightful Corp.). Datasets utilized in this study were as follows:
The Heliantheae and Helenieae (Asteraceae) dataset compiled by Karis (1993) and used in a previous ANOPA and baraminic distance study of tribe Heliantheae sensu lato (Cavanaugh & Wood 2002). The dataset consists of 141 morphological characters scored for 98 taxa.
The equid dataset compiled by Evander (1989) and used in a previous ANOPA and baraminic distance analysis of fossil horses (Cavanaugh et al. 2003). The dataset consists of 33 cranial and postcranial characters scored for 19 species.
The morphological portion of the Poaceae dataset compiled by the Grass Phylogeny Working Group (http://www. virtualherbarium.org/grass/gpwg/) and utilized in a previous baraminic distance study (Wood 2002). The dataset consists of 53 characters scored for 66 genera.
Determination whether a matrix is Euclidean was accomplished using the is.matrix function from the ADE-4 multivariate analysis package (Thioulouse et al. 1997), which implements a test originally devised by Gower and Legendre (1986). The is.matrix code was originally written in R (http://www.r-project.org) and was adapted for S-Plus version 4.0 for this study. Determination whether a matrix is metric was accomplished by applying the three characteristics of a metric matrix from Cox and Cox (1994, p 9): (1) δr = 0 for all 1 <r <n, (2) δrs = δsr for all 1<r,s<n,and(3)δrs<δrt +δts forall1<r,s,t<n.
All 3D multidimensional scaling results were converted to Kinemages for display using Mage (http://kinemage.biochem.duke.edu/software/ software1.html). Kinemages were then deposited in the ANOPA repository at the Baraminology Study Group website (http://www. bryancore.org/bsg/).
RESULTS
Heliantheae/Helenieae. The Heliantheae/Helenieae dataset consists of 98 representative taxa from four different Asteraceae tribes, Heliantheae (64 taxa), Helenieae (29 taxa), Eupatorieae (four taxa), and Senecioneae (one taxon). The 141 characters are entirely morphological. Calculation of character relevance revealed two characters below the 0.95 cutoff, resulting in 139 characters used for calculation of baraminic distances by BDIST. The maximum calculated distance is 0.616, observed between Critonia and Silphium. The baraminic distance matrix is metric but not Euclidean, and the baraminic distance matrix corrected by addition of the maximum distance 0.616 is both metric and Euclidean. After classical scaling to three dimensions, stress for the uncorrected and corrected distances differed substantially: 0.3671701 and 0.58255 respectively. Similarly, correlation coefficient for the uncorrected distances was 0.8573833, and only slightly lower for the corrected distances, 0.8411189. Because of the significant difference in stress, I will here describe only the classical scaling of the uncorrected baraminic distances.
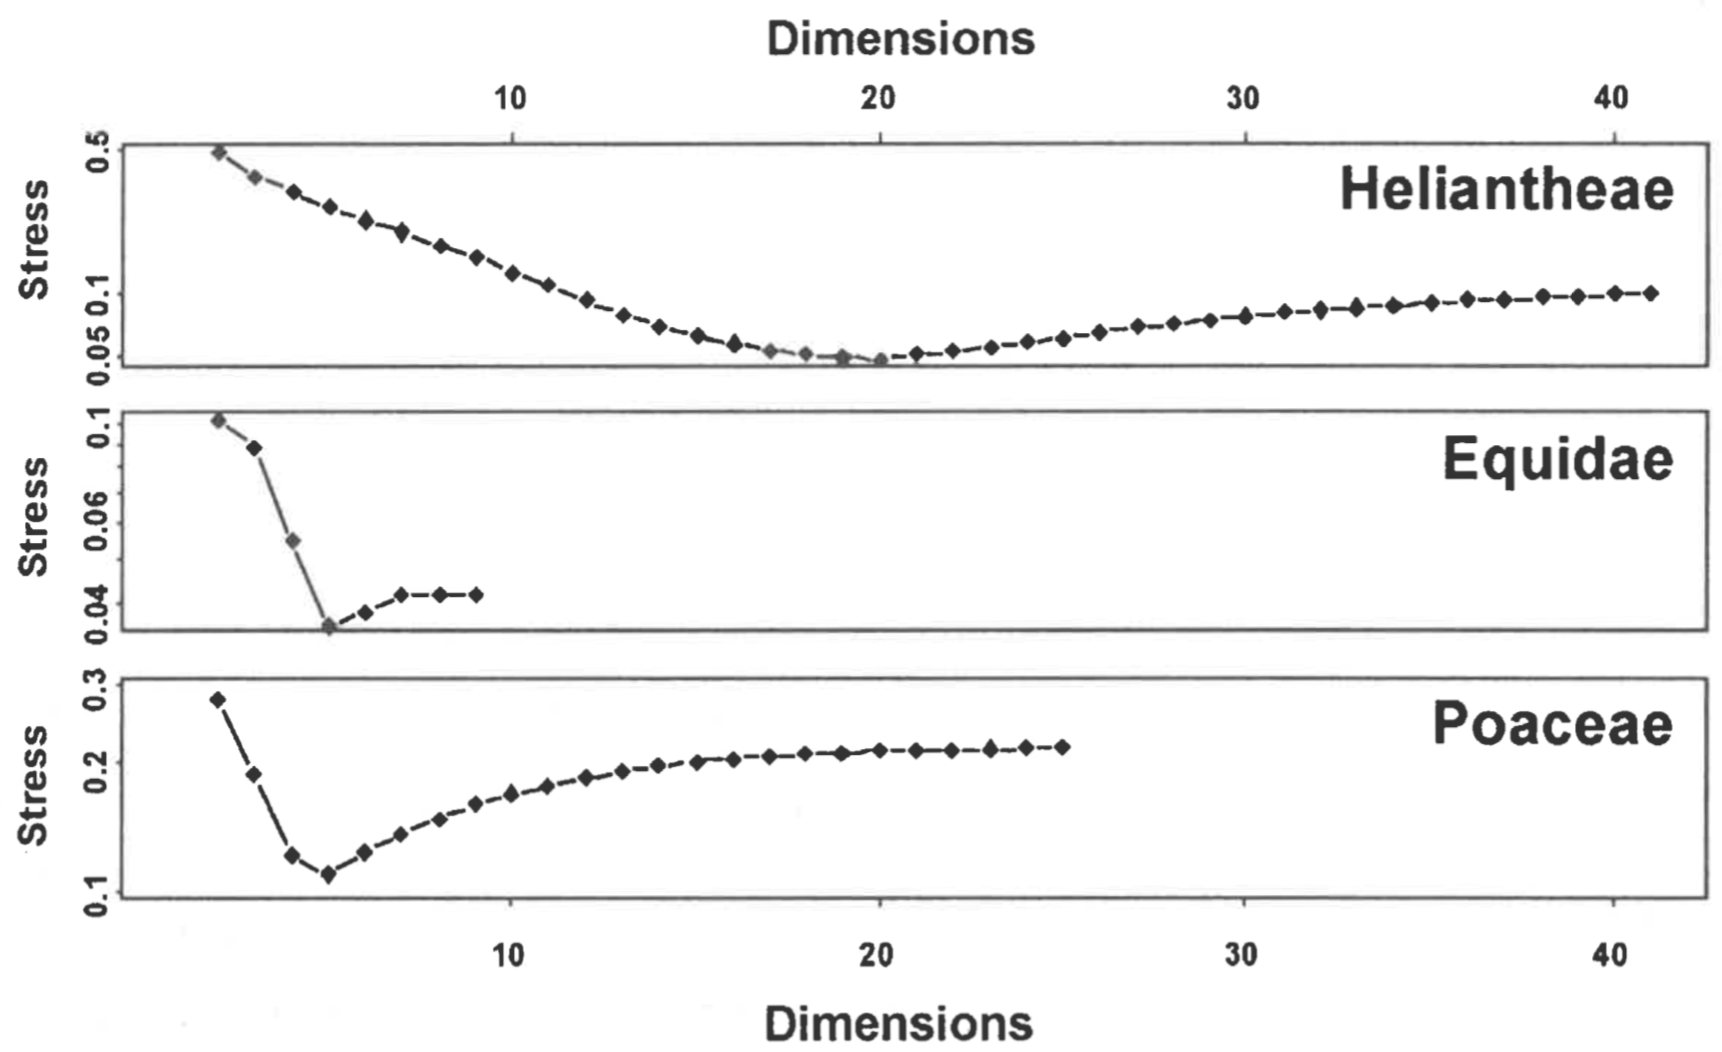
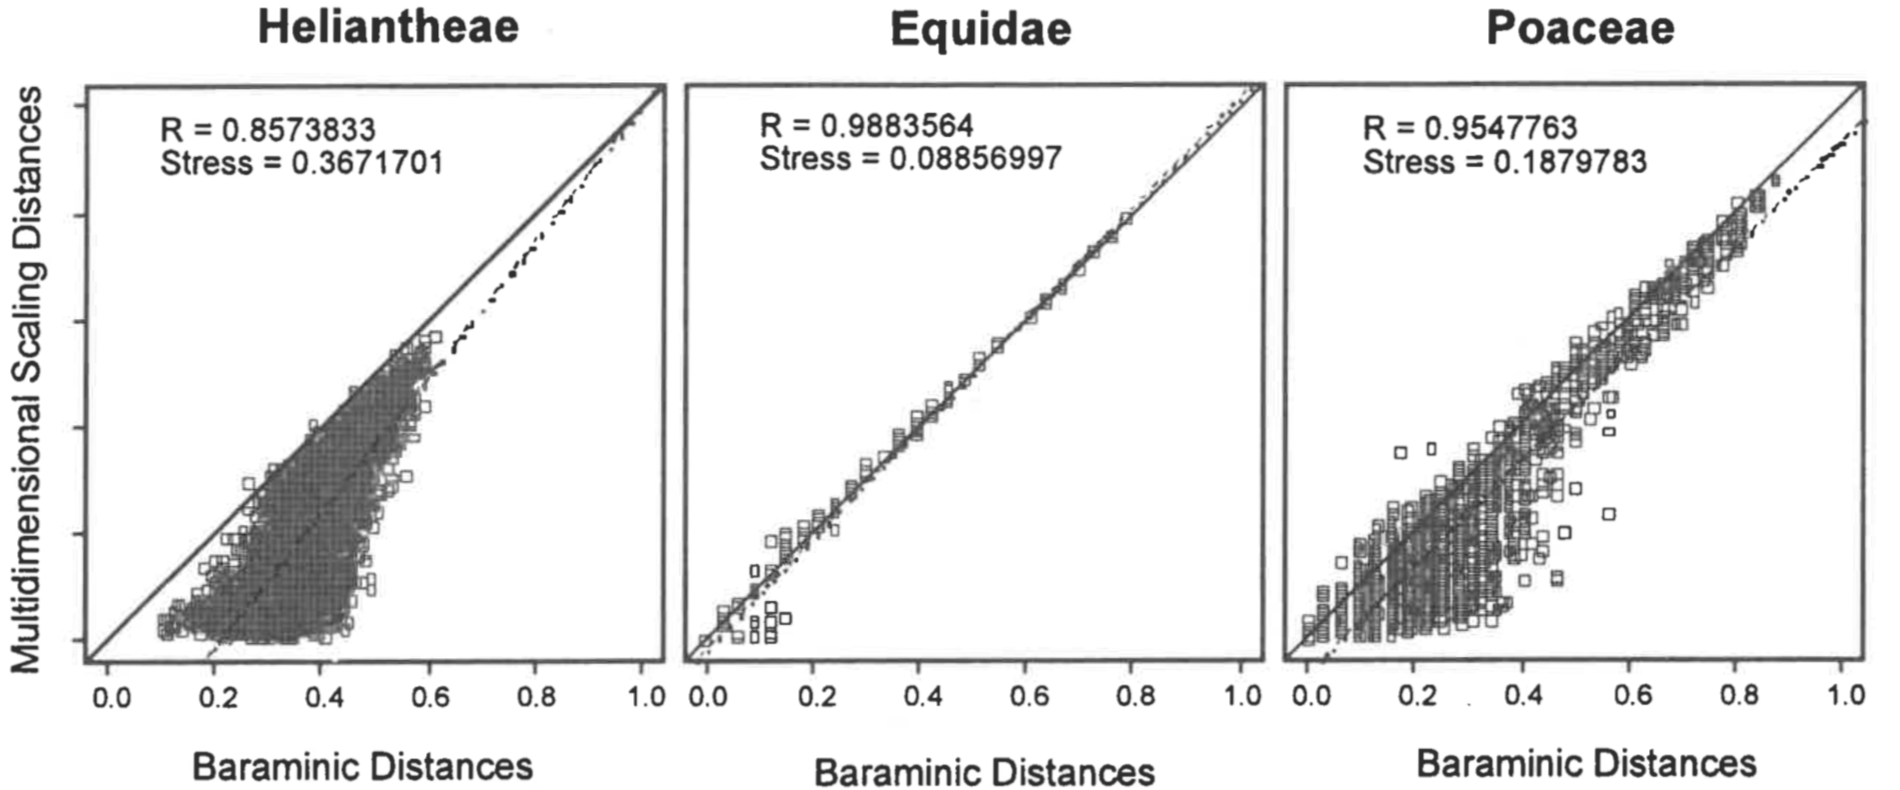
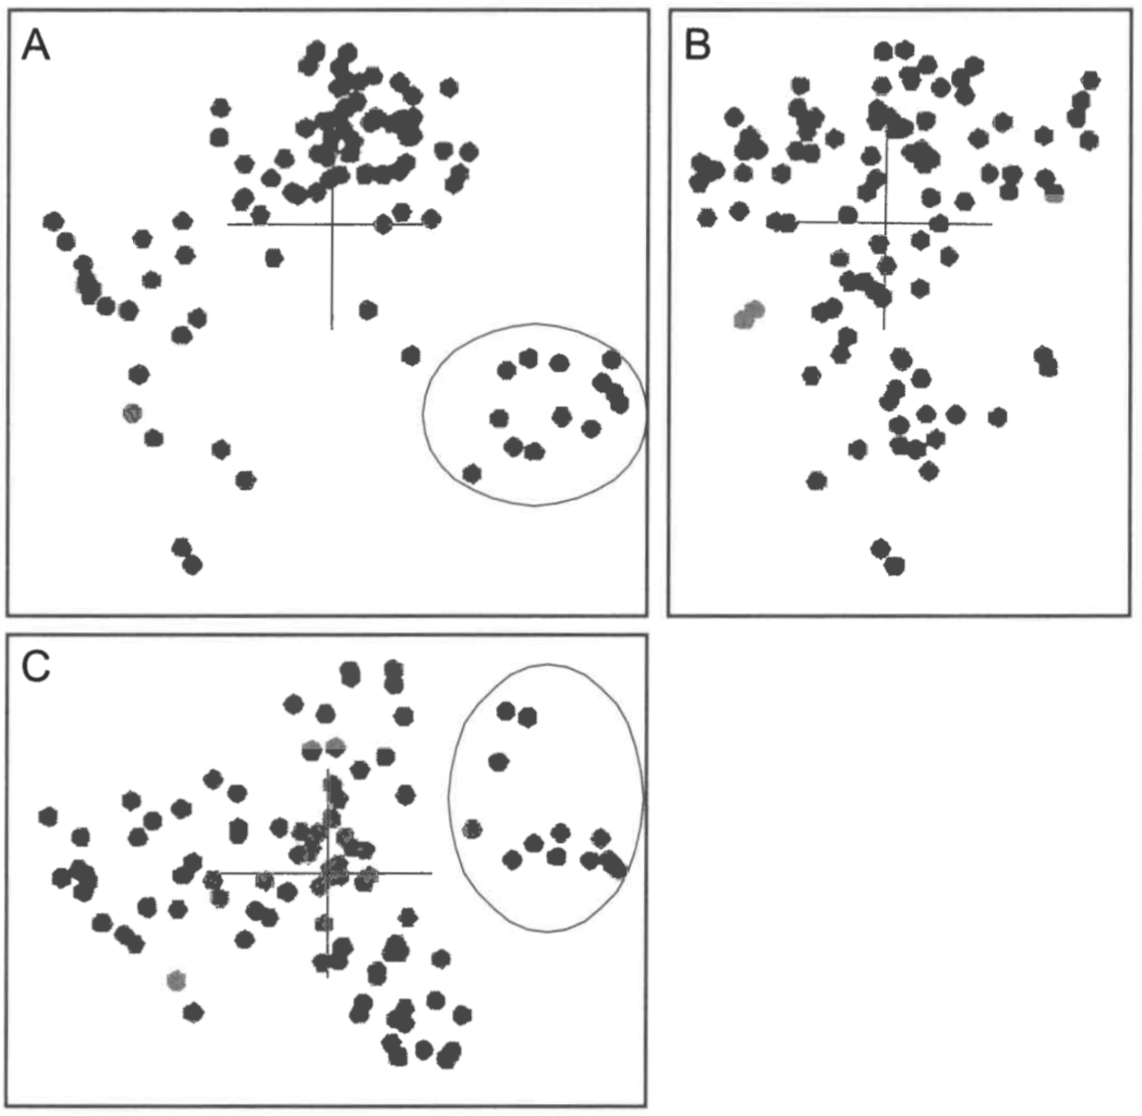
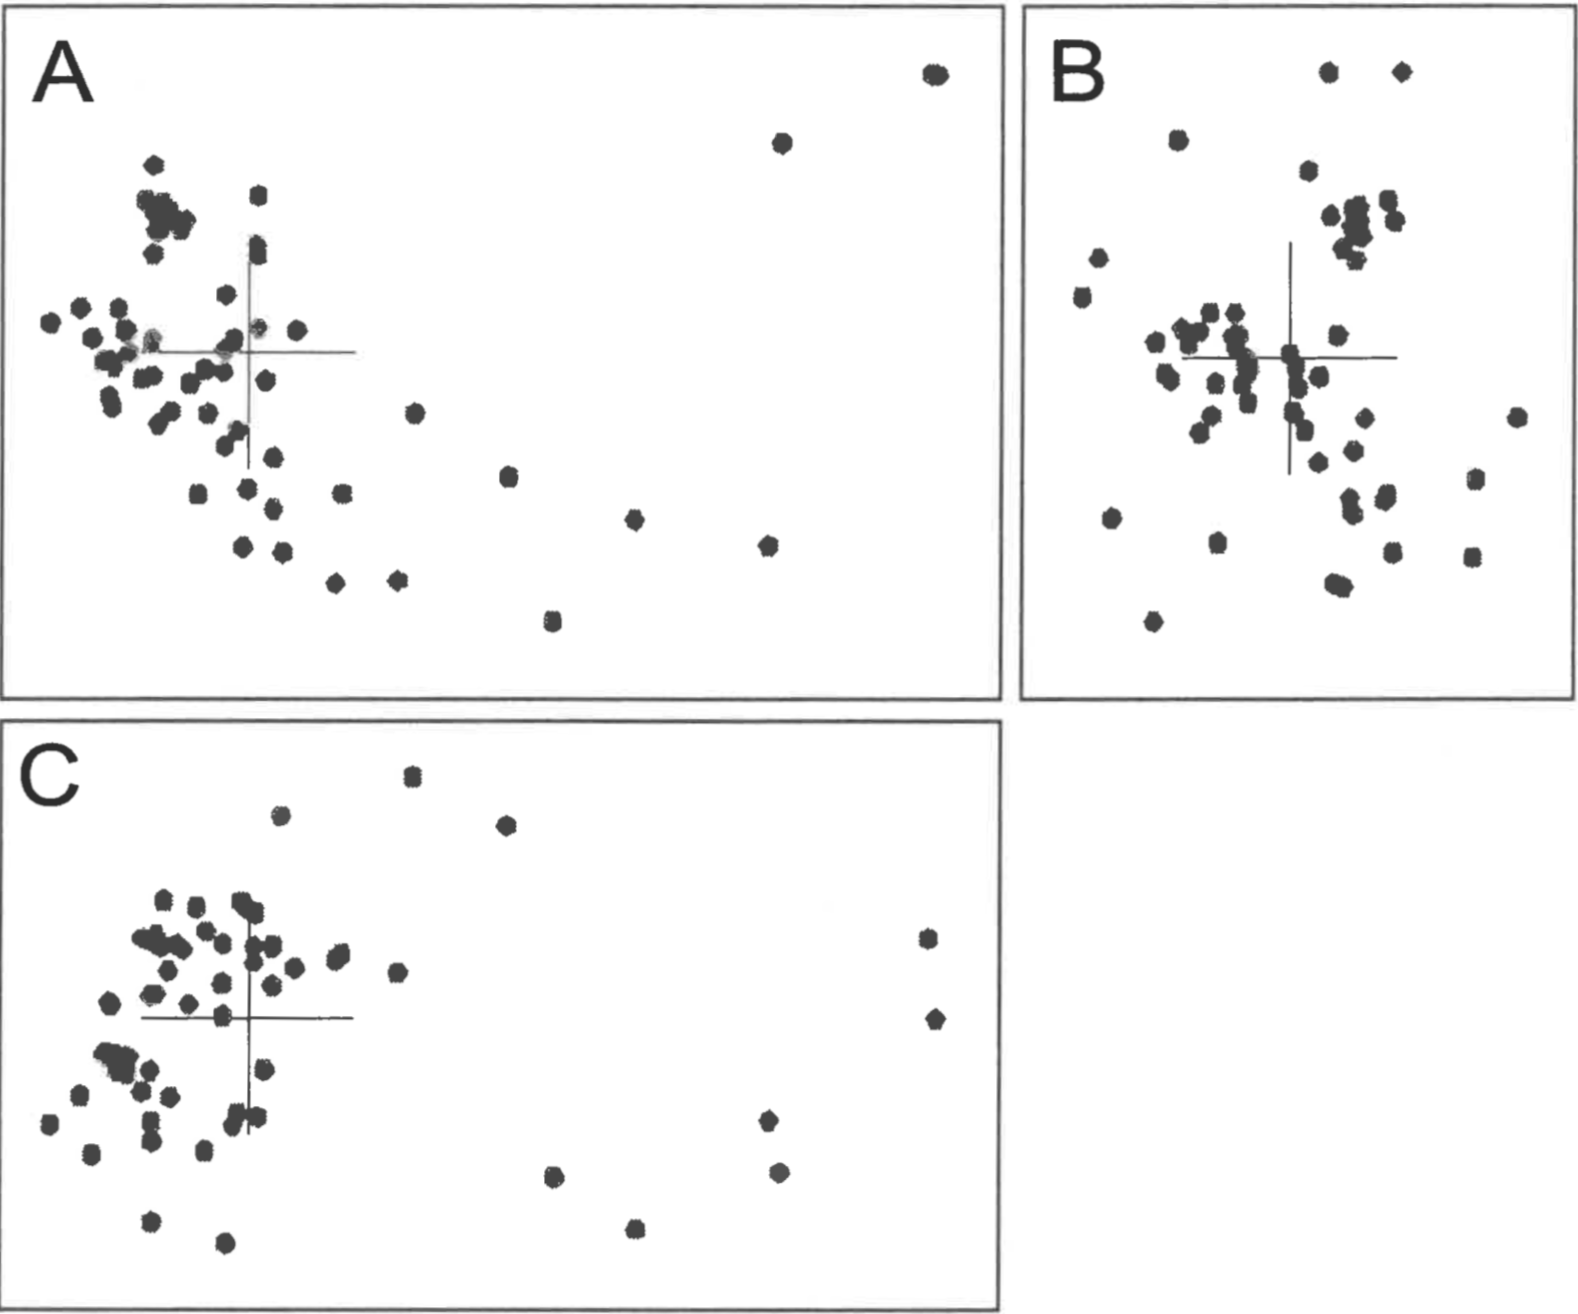
Figure 1. Stress of n-dimensional classical scaling on uncorrected baraminic distance matrices (see text) plotted as a function of the number of dimensions (n), beginning with n = 2. Note that the maximum number of dimensions is determined by the number of positive eigenvalues of the distance matrix D.Figure 2. Uncorrected baraminic distances plotted against Euclidean distances calculated from 3D calculated scaling results. For each dataset, the ideal of distance equality (drs = δrs for all r, s) is shown as a solid line. Least-squares regression lines for the actual distance data are shown as dashed lines with the correlation coefficient (R) given. The stresses of 3D classical scaling are also shown.Figure 3. Orthogonal views of 3D classical scaling applied to the Heliantheae/Helenieae baraminic distances. The distinct lobe of Eupatorium, Critonia, Symphyopappus, Lycapsus, Chaenactis, Varilla, Dimeresia, Coulterella, Ichyothere, Melampodium, Lasianthaea, Fitchia, and Tetragonotheca is circled in panels A and C.
The stress for a series of scaling dimensions (2-41) is shown in Figure 1. The minimum stress for the Heliantheae/Helenieae dataset is 0.04875861 at 20 dimensions; the 0.3671701 stress for three dimensions indicates a structure that is highly distorted, as would be expected for reducing the dimensionality of a 20D structure to 3D. Nevertheless, the correlation between the Heliantheae/Helenieae baraminic distances and the distances inferred from the scaled points is very high (0.8573833), although the slope (1.25) and intercept (-0.22) differ markedly from 1 and 0 respectively (Figure 2). Despite the high stress, the distance correlation indicates that some meaningful patterns can be inferred from the 3D scaled structure, although the scaled distances are nearly without exception lower than the corresponding baraminic distance. Consequently, we should expect a structure more compact in 3D than it would be in 20D.
An orthogonal view of the 3D scaling results for the Heliantheae/ Helenieae dataset is shown in Figure 3. The structure is noticeably partitioned into four lobe-like structures with poorly defined boundaries, consisting of at least ten taxa each. Only one lobe, consisting of Eupatorium, Critonia, Symphyopappus, Lycapsus, Chaenactis, Varilla, Dimeresia, Coulterella, Ichyothere, Melampodium, Lasianthaea, Fitchia, and Tetragonotheca, is well-separated from the other taxa. The remaining lobes comprise the remaining taxa but are too poorly bounded to provide a definitive membership list of each lobe.
Equidae. The Equidae dataset consists of 21 dental characters, five cranial characters, and seven postcranial characters scored for 19 taxa, including representatives from each of the three equid subfamilies. No characters scored below 0.95 relevance, and consequently none were eliminated from baraminic distance calculations. The maximum distance 0.788 is observed between two pairs of taxa (Hyracotherium, Neohipparion) and (Hyracotherium, Pseudhipparion). The baraminic distance matrix is neither Euclidean nor metric, but a matrix corrected by addition of the 0.788 to each baraminic distance is Euclidean. After classical scaling to three dimensions, stress for the uncorrected and corrected distance matrices was 0.0886 and 0.4184 respectively. The linear correlation coefficients between the calculated distances and scaled distances were 0.9884 and 0.9699 respectively. Thus, as with the Heliantheae/ Helenieae dataset, classical scaling produces a structure with significantly lower stress for the uncorrected baraminic distance matrix. Consequently, I will use only the uncorrected baraminic distances for the remaining calculations.
Stress values calculated for classical scaling to dimensions 2-9 are shown in Figure 1. Unlike Heliantheae/Helenieae, the Equidae dataset has a minimum of 0.0354 at only five dimensions, which implies that the three-dimensional structure with a stress of 0.0886 is likely to be a reasonable representation of the five-dimensional structure. The close correspondence between the baraminic distances and scaled distances can be seen in a scatterplot (Figure 2). Not only is the linear correlation high (0.9884), but the slope (1.04) and intercept (-0.02) of the leastsquares regression line are very close to 1 and 0 respectively.
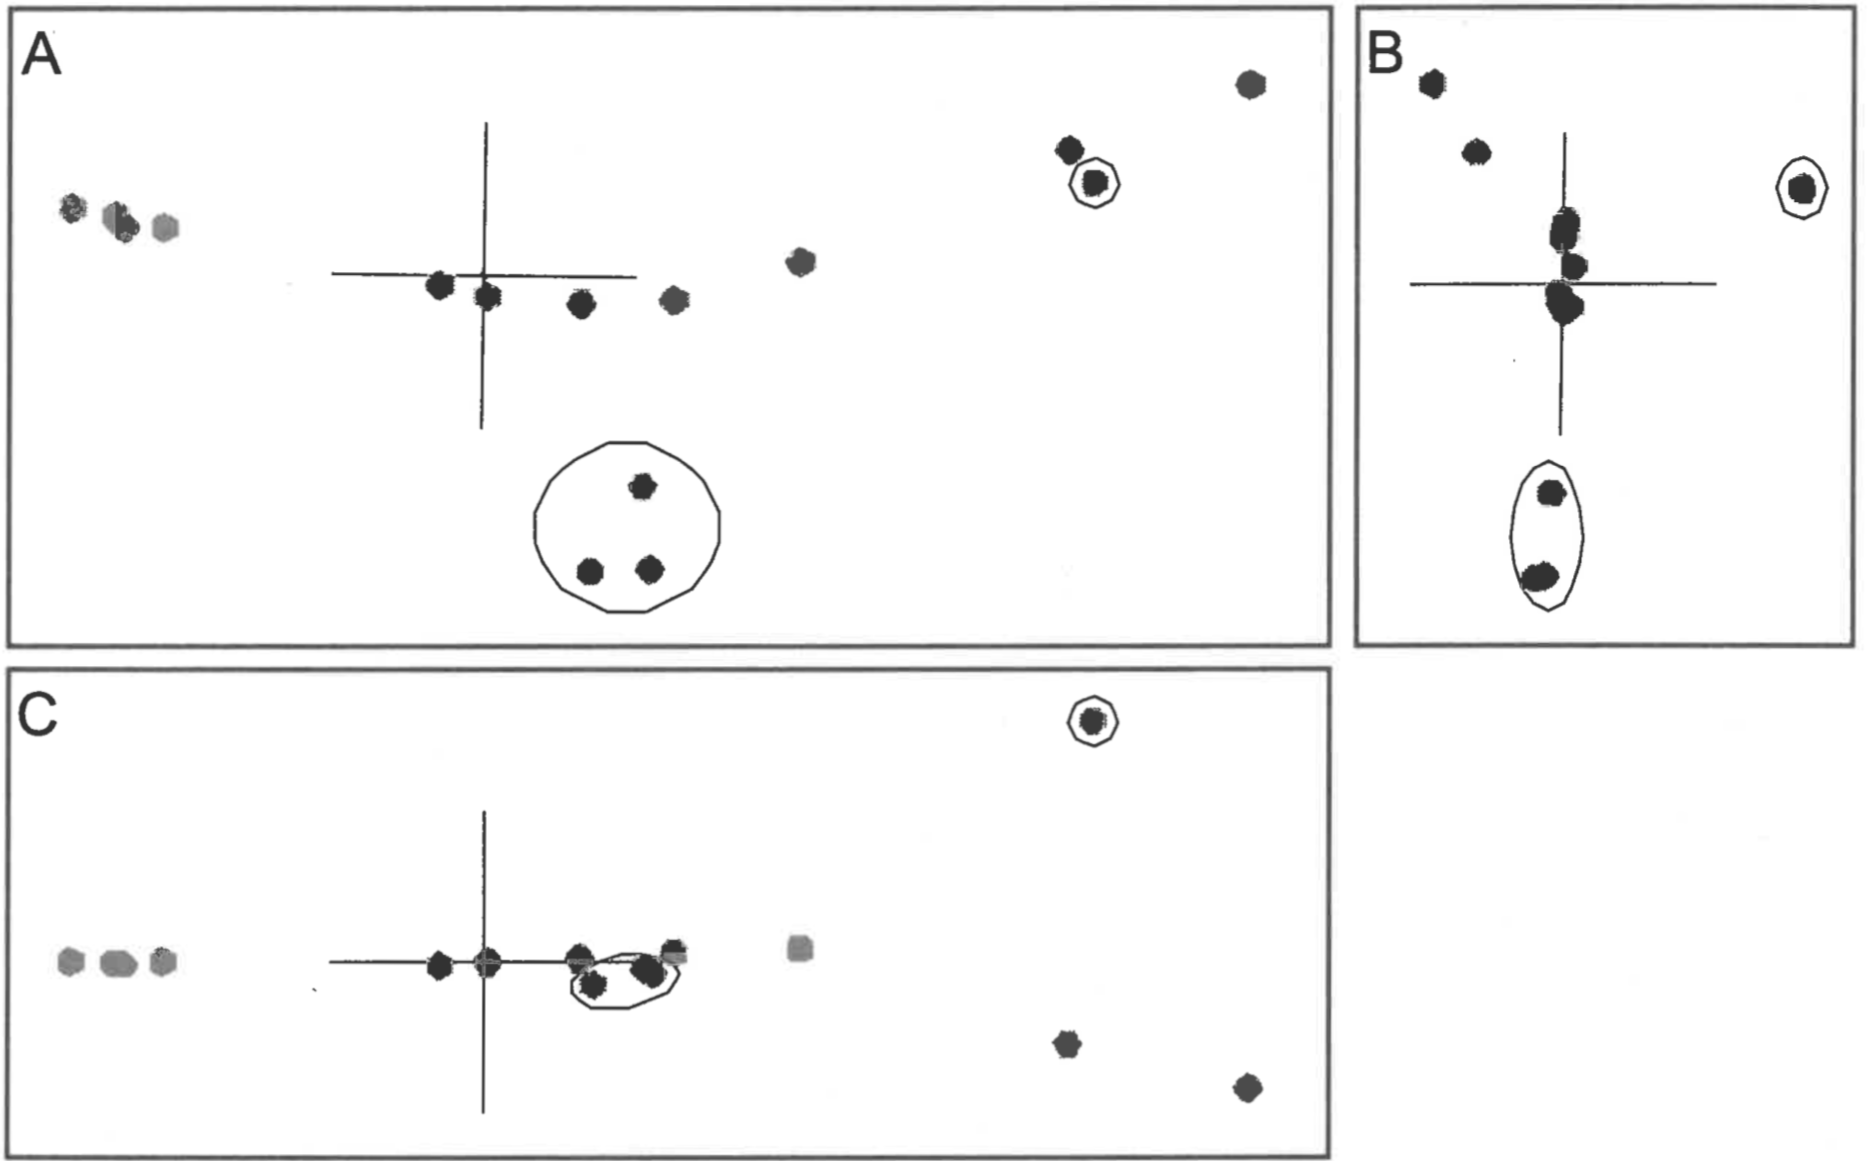
Orthogonal views of the 3D scaled structure reveal a very linear shape with two side-branches (Figure 4).
Figure 4. Orthogonal views of 3D classical scaling applied to the Equidae baraminic distances. The two side-branches from the main axis (Epihippus and Hypohippus-Anchitherium-Megahippus) are circled.
One end of the linear structure (the right-most taxa in Figure 4) consists of the subfamily Hyracotheriinae: Hyracotherium, Orohippus, and Epihippus. The other end is a very densely packed cluster that includes eight genera: Equus, Dinohippus, Hipparion, Neohipparion, Pseudhipparion, Protohippus, and Merychippus. The remaining genera, Parahippus, Archaeohippus, Kalobatippus, Miohippus, and Mesohippus, are evenly-spaced between the two extremes of the linear structure. One side-branch consists of three genera, Hypohippus, Anchitherium, and Megahippus. The second side-branch is the single genus Epihippus. The side-branch consisting of Hypohippus, Anchitherium, and Megahippus is closest to Kalobatippus and Miohippus; whereas Epihippus is closest to Orohippus.
Poaceae. The Poaceae dataset is a subset of the Grass Phylogeny Working Group dataset consisting of 53 morphological characters. The taxa represent 62 grass genera from 36 tribes and four outgroup genera: Baloskion, Elegia, Flagellaria, and Joinvillea. Eleven of the grass tribes in the dataset are represented by more than one genus. Only 32 characters exceeded the relevance cutoff of 0.95 and were used to calculate baraminic distances. As with the Heliantheae/Helenieae and Equidae, I attempted classical scaling on the baraminic distance matrix and a matrix of distances plus the maximum distance calculated [0.875 between two pairs of genera: (Baloskion, Centropodia) and (Elegia, Centropodia)]. For uncorrected baraminic distances classically scaled to three dimensions, the stress was 0.1880 and the correlation between baraminic distances and scaled distances was 0.9548. Stress and correlation values for the corrected baraminic distance matrix were 0.5501 and 0.9298 respectively. Once again, despite the corrected baraminic distance matrix being Euclidean, the non-Euclidean, non-metric uncorrected baraminic distance matrix exhibits much less stress than the corrected distances. I will use the uncorrected distances for the remaining calculations.
As with the Equidae dataset, the Poaceae baraminic distances showed a minimum stress value of 0.1099 with a five-dimensional classical scaling (Figure 1). The correlation between the baraminic distances and scaled distances is high (0.9548), but the least-squares regression line deviates slightly from the diagonal. The slope of the regression line is 1.00 and the intercept is -0.03. As can be seen in the scatterplot (Figure 2), the scaled distances tend to underestimate slightly the baraminic distances, as seen in the Heliantheae/Helenieae dataset. Unlike the Heliantheae/Helenieae distances, however, the high correlation and low stress indicates a good fit between the 3D scaled distances and the baraminic distances.
Orthogonal plots of the 3D scaling results reveals a generally compact central structure with several taxa located at some distance from the central structure (Figure 5).
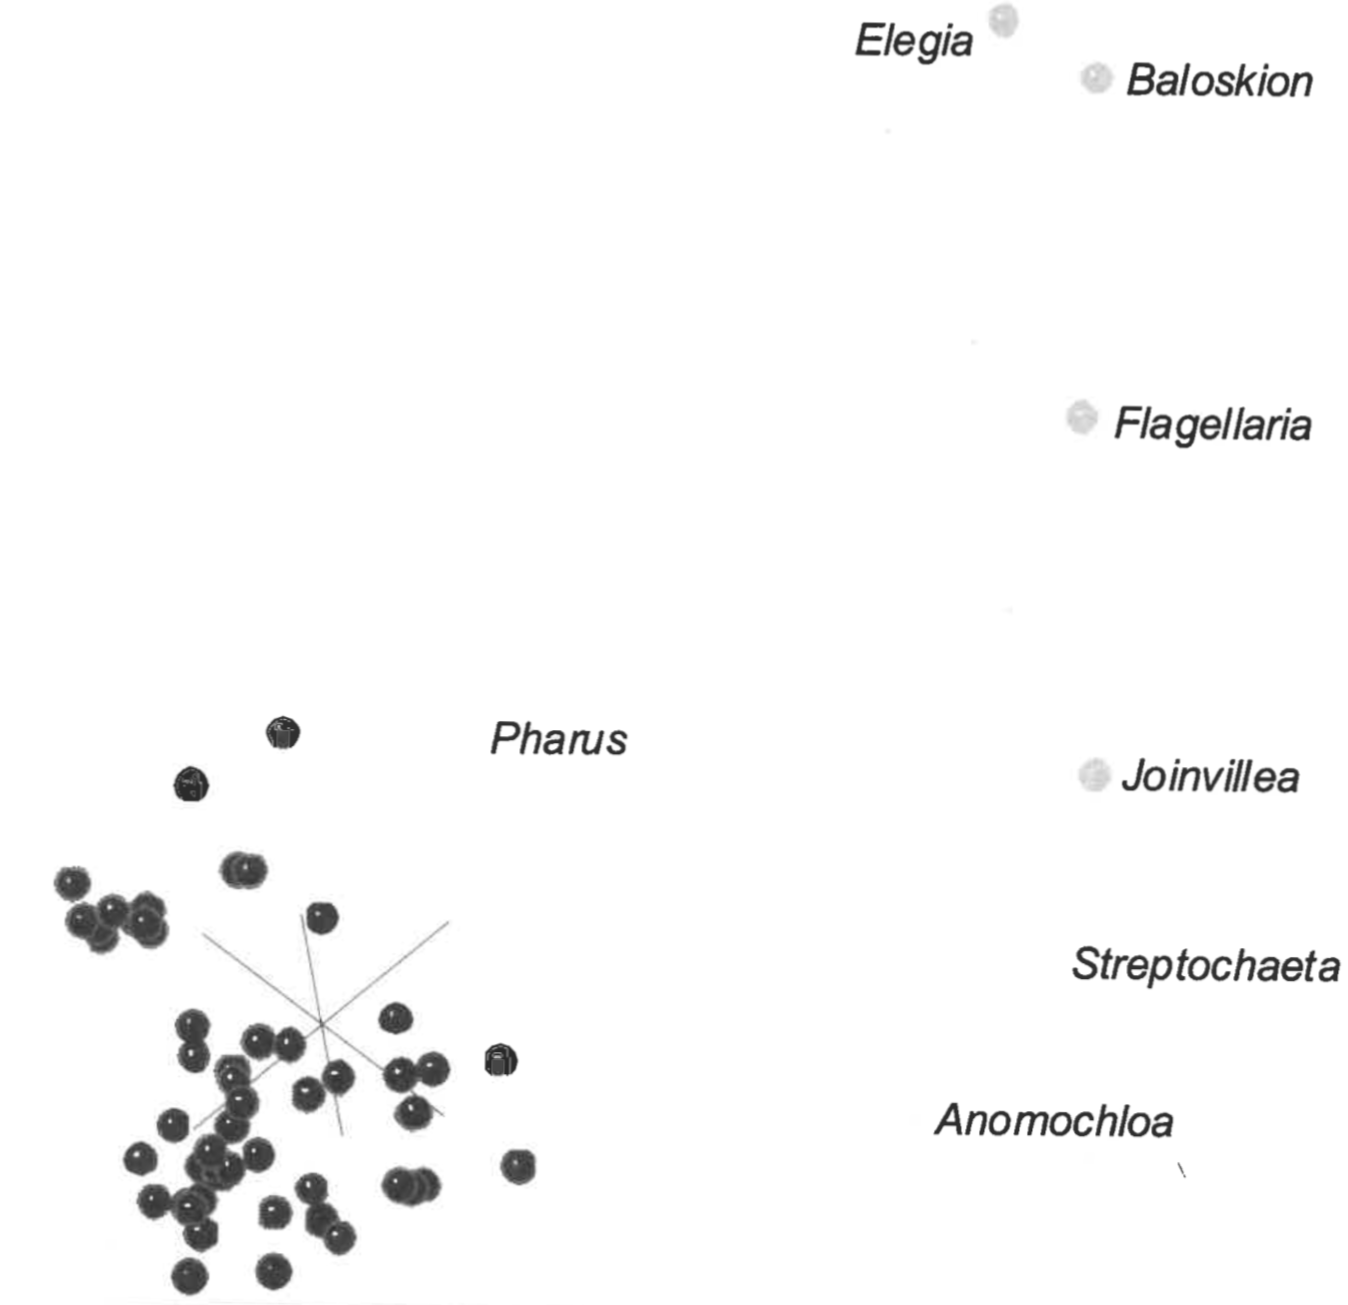
Figure 5. Orthogonal views of 3D classical scaling applied to the Poaceae baraminic distances.Figure 6. Proposed discontinuity surrounding the majority of grass genera is revealed in 3D classical scaling of the Poaceae baraminic distances. The outgroup (grey) genera Elegia, Baloskion, Flagellaria, and Joinvillea are distinct from the majority of the grass genera (black). The baraminic affinity of three grass genera (Pharus, Anomochloa, and Streptochaeta, shown in stripes) is clarified by 3D scaling.
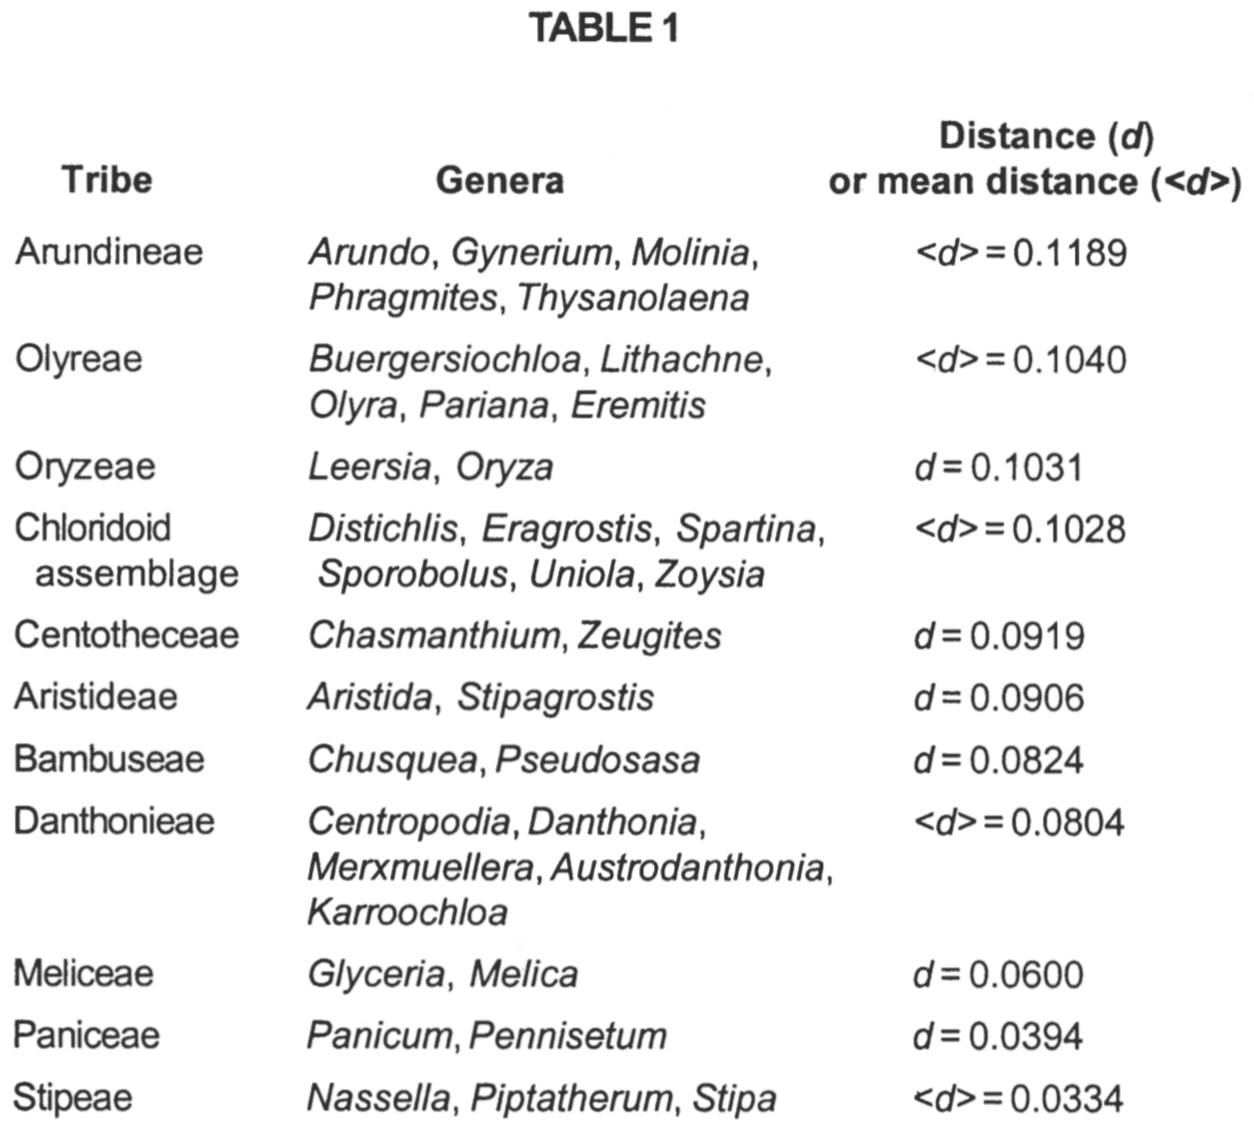
The deviants are the outgroup taxa Elegia, Baloskion, Flagelleria, and Joinvillea, together with Streptochaeta and Anomochloa (Figure 6). Of the eleven grass tribes represented by more than a single genus, all clustered closer to each other than the average scaled distance between grass taxa of 0.2012 (Table 1). The most disperse tribe is Arundineae with an average intratribal scaled distance of 0.1189. The most compact tribe is Stipeae, with an average intra-tribal scaled distance of 0.0334. Despite these low intra-tribal scaled distances, there is a lack of noticeable clustering within the grass structure. Most tribes are consequently intermingled with members of other tribes.
DISCUSSION
Although multidimensional scaling has been applied only rarely to biological problems outside of ecology (e.g., Kenkel & Orlóci 1986), the non-phylogenetic, descriptive nature of modern baraminology (Wood & Murray 2003), and particularly of the refined baramin concept (Wood et al. 2003), provide an ideal opportunity to apply classical scaling to biosystematics. My results here indicate that multidimensional scaling can be successfully applied to matrices consisting of baraminic distances as defined by Robinson and Cavanaugh (1998b). The results of classical 3D scaling on three datasets previously utilized in baraminology studies reveal patterns that are both consistent with previous conclusions and also further illuminate the patterns in biological character space.
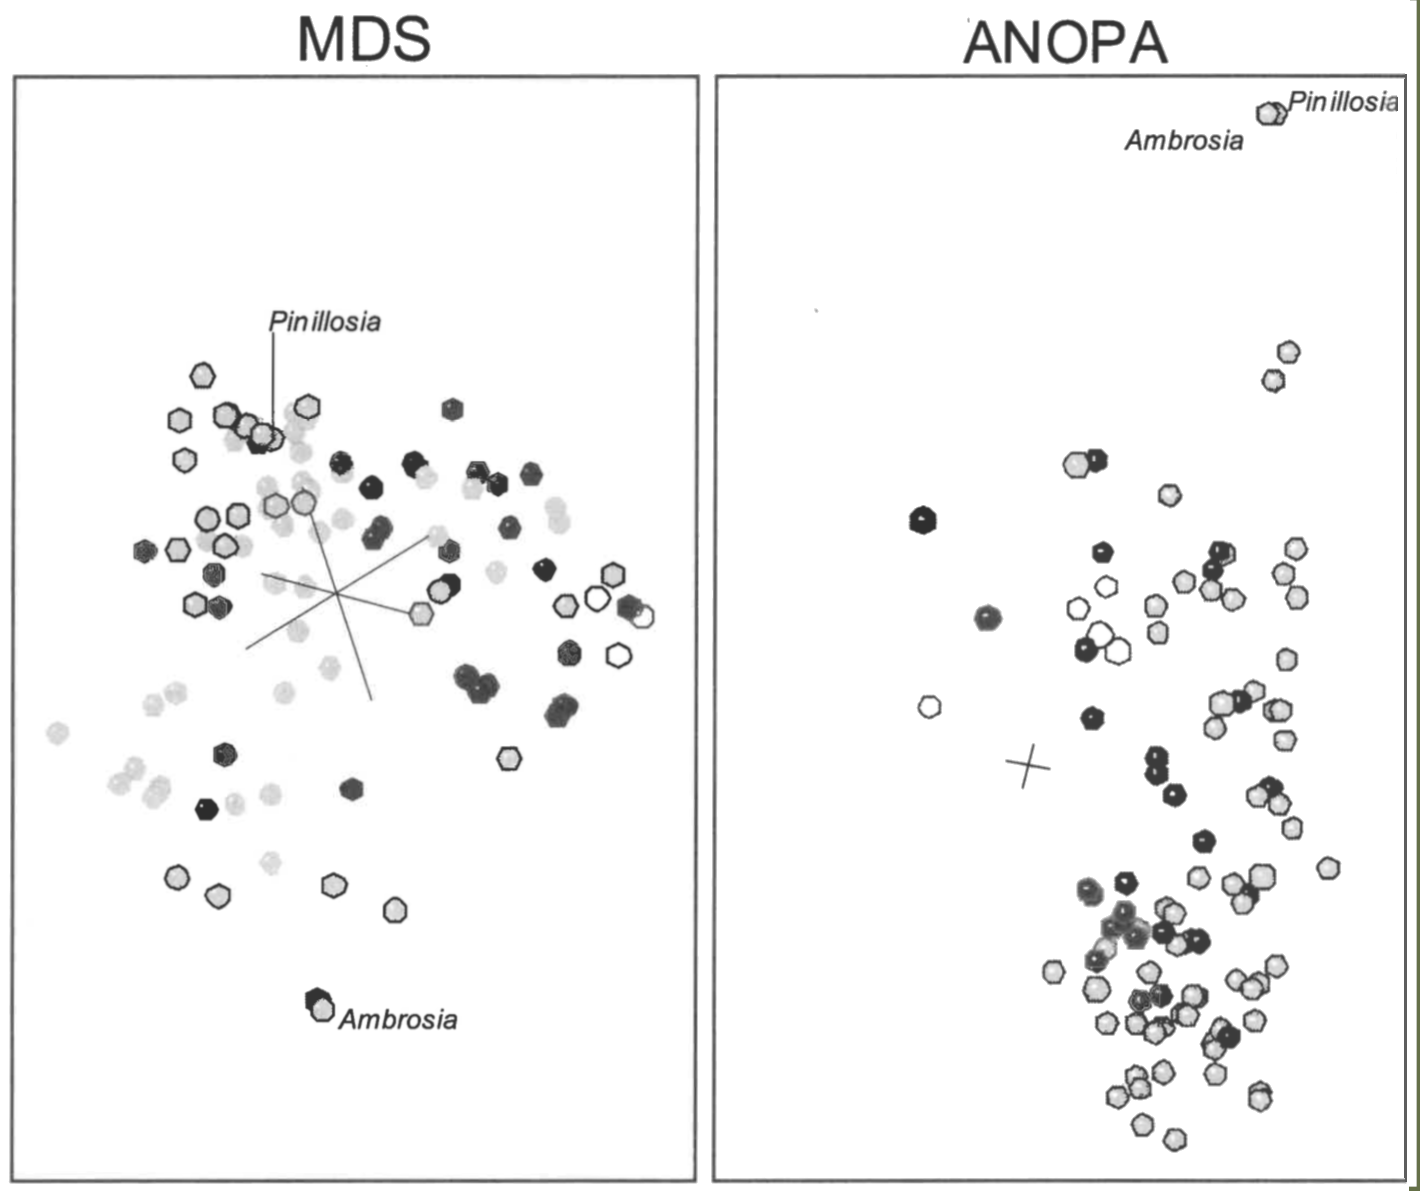
Figure 7. Three-dimensional classical scaling of baraminic distances (left) and 3D ANOPA (right) for the Heliantheae/Helenieae dataset are shown. Heliantheae (grey), Helenieae (black), Eupatoriaceae (horizontal stripes), and Senecioneae (diagonal stripes) are distinguished.
Heliantheae/Helenieae, Equidae, and Poaceae. When the scaled points for the Heliantheae/Helenieae dataset are compared to the 3D ANOPA results (Cavanaugh & Wood 2002), the 3D scaled points are recognizably different (Figure 7). In the ANOPA results, taxa of the tribe Eupatorieae are clustered together, whereas in the 3D scaled points, the four Eupatorieae taxa are separated into two groups, with Lourteigia separated from the other three, Eupatorium, Critonia, and Symphyopappus. Similarly, though visibly indistinguishable in the 3D ANOPA results, Ambrosia and Pinillosia are separated by a Euclidean distance of 0.4892 in the 3D scaling results. In contrast, Cavanaugh and Wood recognized ten distinguishable groups that do not correspond to any obvious groups in the 3D scaled points. For example, though united in the well-defined lobe in the 3D scaled points, Coulterella, Ichthyothere, Critonia, Tetragonotheca, and Chaenactis were all classified in different groups in Cavanaugh and Wood’s 3D ANOPA results. Finally, although distinct from the main group of taxa in the 3D ANOPA structure, Senecioneae is much more intermingled with the other taxa in the 3D scaled results (Figure 7). In spite of the differences, 3D ANOPA and 3D scaling both agree that taxa from tribes Heliantheae, Helenieae, and Eupatorieae are intermingled.
In the 3D scaled results, the well-separated lobe consisting of thirteen taxa described above is probably not discontinuous from the other Heliantheae and Helenieae taxa for at least two reasons. First, Varilla is a close relative of subtribe Flaveriinae sensu stricto and has been assigned to the same monobaramin as Flaveria (Wood & Cavanaugh 2001; Wood & Cavanaugh 2003). Although Flaveria is included in this study, it is not part of the distinguishable lobe in question. Thus, the apparent separation is bridged by continuity from a different study using a different dataset. Second, the lobe contains taxa from tribes Heliantheae, Helenieae, and Eupatorieae, indicating that conventional taxonomy has not recognized a strong difference that would require separate classification of the taxa in question. Classifications based on easily recognized differences can be indicators of underlying discontinuity. The absence of an agreed-upon division of Heliantheae and Helenieae taxa imply that discontinuity is absent. Thus, despite recognizable lobes, there does not appear to be discontinuity between any group of taxa in the Heliantheae/Helenieae dataset. Instead, the taxa appear to be a single group with several subgroups.
Both of these major conclusions are identical to the conclusions of Cavanaugh and Wood (2002). The intermingling of taxa is prominent in both the 3D ANOPA and 3D classical scaling. Cavanaugh and Wood attribute the debates over classification of Heliantheae and Helenieae to this intermingling of taxa. Furthermore, as noted above, Cavanaugh and Wood distinguish at least 10 subpopulations within the 3D ANOPA results. Although these subpopulations are different from the lobes apparent in the 3D scaling results, subpopulations exist in both 3D
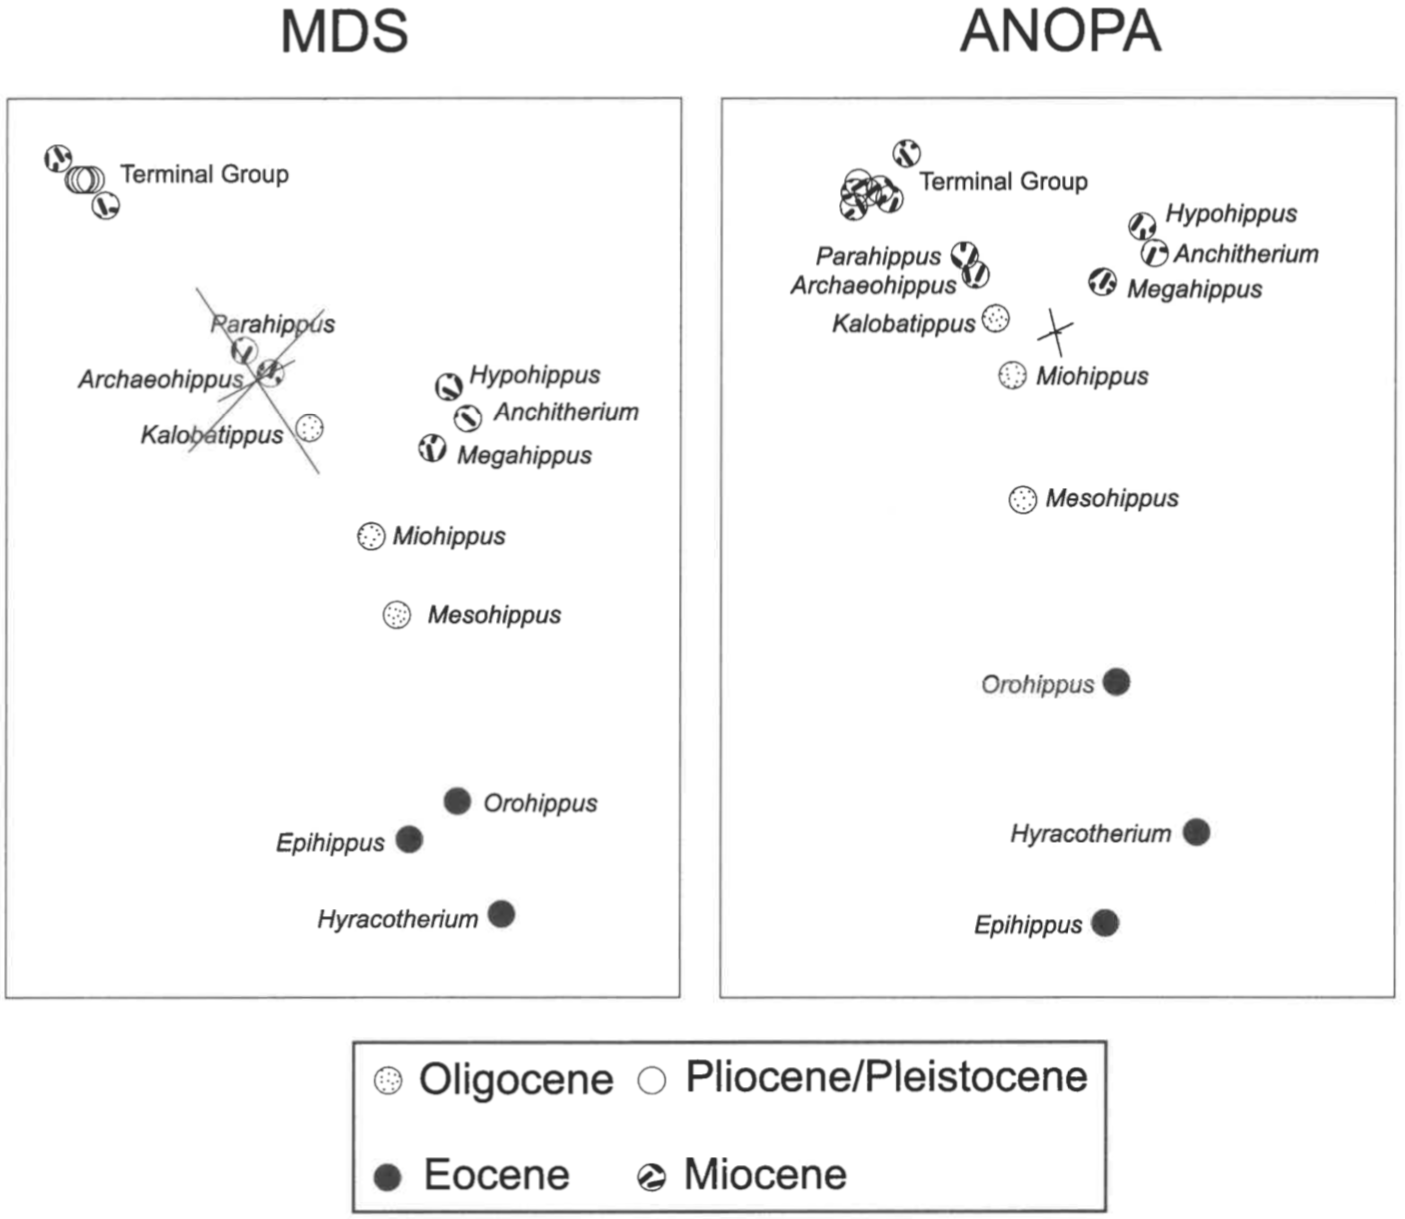
Figure 8. Three-dimensional classical scaling of baraminic distances (left) and3DANOPA(right)fortheEquidaedatasetareshown. Stratigraphicfirst occurrence of each taxon is indicated.
ANOPA and 3D scaling. The variation of the membership of these sub-groupings may be attributable to the attempt to visualize twenty dimensions in only three. Distances will necessarily be distorted in the attempt.
For the Equidae dataset, the 3D classical scaling results exhibit a striking correspondence to the 3D ANOPA results of Cavanaugh et al. (2003) (Figure 8). In both the taxa appear in a Y-shaped linear configuration. In both the major side-branch consists of Hypohippus, Anchitherium, and Megahippus, and it branches near Miohippus and Kalobatippus. In both Epihippus deviates from the main linear structure. In both the genera on the main linear structure appear in the same order: Hyracotherium, Orohippus, Miohippus, Kalobatippus, Archaeohippus, Parahippus and the terminal group of eight. An obvious difference is that the scaling results appear to be more linear than the ANOPA results (Figure 8).
Although the Poaceae dataset was not previously subjected to 3D ANOPA, it was analyzed using the baraminic distance correlation method (Wood 2002). The distance correlation results indicated a high frequency of significant, positive correlation between 59 of the 62 grass genera. Two grass genera, Streptochaeta and Anomochloa were negatively correlated to 48 and 27 grass genera respectively but were positively correlated to 4 and 2 of the outgroup genera respectively. Pharus was positively correlated to the outgroup genus Joinvillea and negatively correlated to two of the grass genera. Pharus was positively correlated to only 16 other grass genera. From the 3D scaling results (Figure 6), the reason for these patterns is apparent. The four outgroup taxa Elegia, Baloskion, Flagellaria, and Joinvillea form a curvilinear structure at a noticeable distance from the main cluster of grass genera. Streptochaeta and Anomochloa appear to be part of the same curvilinear outgroup structure. Pharus is a definite outlier of the main grass cluster but is poorly associated with the curvilinear outgroup structure.
What may be concluded about the baraminological classification of these three groups from the classical scaling results? The scaling results confirm previous baraminological conclusions. The Heliantheae, Helenieae, Eupatorieae, and probably Senecioneae belong to a single monobaramin, with no clear evidence of discontinuity in the Karis (1993) dataset. The Equidae are a single monobaramin that forms a biological trajectory (Wood & Cavanaugh 2003) that correlates well with the stratigraphic first occurrence of the taxa. The 3D scaling results for the Equidae are nearly identical with the 3D ANOPA results. The Poaceae dataset reveals a holobaramin encompassing 60 of the 62 grass taxa, exhibiting discontinuity with Streptochaeta, Anomochloa, Joinvillea, Flagellaria, Baloskion, and Elegia. Future baraminological studies of these groups should seek alternative datasets to confirm the results here reported.
Multivariate Methods in Baraminology. The refined baramin concept depicts taxa as points in a multidimensional biological character space. As a result, baraminology studies using the refined baramin concept are ideally suited for multivariate analysis. Previous baraminology studies have utilized two multivariate methods, Analysis of Patterns (Cavanaugh & Wood 2002; Cavanaugh et al. 2003; Wood & Cavanaugh 2001) and principal component analysis (García-Pozuelo-Ramos 2002). In this report, I introduced a third multivariate technique, classical multidimensional scaling. Each of these techniques has advantages and disadvantages, but as I have already demonstrated, using more than one multivariate technique provides not only a complementary perspective on the same dataset but also a confirmation and clarification of previous results.
As noted above, ANOPA is a pattern projection technique that creates a three-dimensional depiction of multidimensional data. In the case of baraminology, the dimensions of the multidimensional data are characters, and the resulting pattern can reveal clustering patterns among the taxa. Often the shapes adopted by the clusters are complex (Cavanaugh & Sternberg 2002; Cavanaugh & Wood 2002), but occasionally the patterns closely resemble phylogenetic hypotheses (Wood & Cavanaugh 2003). Because 3D ANOPA is a projection of points, distortion is expected for datasets of high dimensionality.
Classical scaling can provide an independent test of the clustering patterns revealed in 3D ANOPA. As seen in this report, classical scaling essentially confirmed the clustering of the fossil equids, but the clustering of the Heliantheae and Helenieae dataset was distinctly different. In 3D ANOPA, the taxa adopted an elongated structure, but in 3D classical scaling the taxa were much more compact. Even though these patterns differed, the stress of classical scaling over a range of dimensions revealed a possible reason for the differences. Whereas the minimal stress for the equid dataset was observed at five dimensions, the minimal stress for the Heliantheae/Helenieae dataset was observed at twenty dimensions. Thus, reduction of dimensionality in the equid dataset would be expected to produce few distortions of taxic positions, whereas reduction of dimensionality in the Heliantheae/Helenieae dataset should produce far more distortions and alternative topologies of similar high distortion.
Wood’s (2002) baraminic distance correlation analysis of the Poaceae dataset revealed some ambiguities with regard to the classification of three genera: Pharus, Streptochaeta, and Anomochloa. Although both Anomochloa and Streptochaeta are classified as grasses, they exhibited negative correlation with other grasses and positive correlation with non-grass taxa. The third ambiguous grass genus Pharus exhibited very little significant correlation, either positive or negative. The classical 3D scaling in this report reveals that Pharus appears to be an outlying member of the grass holobaramin, but Streptochaeta and Anomochloa do appear to cluster with the outgroup genera and are probably not members of the grass holobaramin. Thus, Wood’s (2002) omission of Streptochaeta and Anomochloa from the grass holobaramin is confirmed, and the ambiguous classification of Pharus is clarified.
Based on the successful application of classical scaling seen in this report, I recommend that baraminologists seek additional multivariate and clustering techniques to apply in baraminological research. Although a common technique, principal component analysis has been used only once in a study of canid variation (García-Pozuelo-Ramos 2002). Although discriminant analysis and fuzzy analysis are used in biological research, they have not been applied in baraminology. Considering the fruitful results of this present study, baraminologists should seek to use other statistical techniques and thereby to broaden the statistical basis of baraminology and to strengthen baraminic hypotheses.
ACKNOWLEDGEMENTS
Thanks to Phil Lestmann and Bob Simpson (Bryan College) for their advice and guidance.
LITERATURE CITED
Cavanaugh DP, Sternberg Rv. 2002. Analysis of morphological constraints using ANOPA, a pattern recognition and multivariate statistical method: a case study involving centrarchid fishes. Journal of Biological Systems, in press.
Cavanaugh DP, Wood TC. 2002. A Baraminological Analysis of the tribe Heliantheae sensu lato (Asteraceae) using Analysis of Pattern (ANOPA). Occasional Papers of the Baraminology Study Group 1:1-11.
Cavanaugh DP, Wood TC, Wise KP. 2003. Fossil equidae: a monobaraminic, stratomorphic series. In: Ivey RL, editor. Proceedings of the Fifth International Conference on Creationism. Pittsburgh: Creation Science Fellowship, p 143-153.
Evander R. 1989. Phylogeny of the family Equidae. In: Prothero DR, Schoch RM, editors. The Evolution of Perissodactyls. NY: Oxford University Press, p 109127.
García-Pozuelo-Ramos C. 2002. Variability of skull shape in the domestic dog and its implications for variability in other mammals and humans since the Flood. Crestion Research Society Quarterly 39:15-20.
Gower JC, Legendre P. 1986. Metric and Euclidean properties of dissimilarity coefficients. Journal of Classification 3:5-48.
Karis PO. 1993. Heliantheae sensu lato (Asteraceae), clades and classification. Plant Systematics and Evolution 188:139-195.
Kenkel NC, Orlóci L. 1986. Applying metric and nonmetric multidimensional scaling to ecological studies: some new results. Ecology 67:919-928.
Marsh FL. 1947. Evolution, Creation, and Science. Washington DC: Review and Herald Publishing Association.
Ramsay JO. 1982. Some statistical approaches to multidimensional scaling data. Journal of the Royal Statistical Society Series A 145:285-312.
Robinson DA. 1997. A mitochondrial DNA analysis of the Testudine apobaramin. Creation Research Society Quarterly 33:262-272.
Robinson DA, Cavanaugh DP. 1998a. Evidence for a holobaraminic origin of the cats. Creation Research Society Quarterly 35:2-14.
Robinson DA, Cavanaugh DP. 1998b. A quantative approach to baraminology with examples from Catarrhine primates. Creation Research Society Quarterly 34:196208.
Scherer S, editor. 1993. Typen des Lebens. Berlin: Pascal-Verlag.
Scherer S. 1998. Basic types of life: evidence of design from taxonomy? In: Dembski WA, editor. Mere Creation. Downers Grove, IL: InterVarsity Press.
Thioulouse J, Chessel D, Dolédec S, Olivier J-M. 1997. ADE-4: a multivariate analysis and graphical display software. Statistics and Computing 7:75-83.
Venables WN, Ripley BD. 1997. Modern Applied Statistics with S-PLUS. NY: SpringerVerlag.
Wood TC. 2002. A baraminology tutorial with examples from the grasses (Poaceae). Creation Ex Nihilo Technical Journal 16:15-25.
Wood TC, Cavanaugh DP. 2001. A baraminological analysis of subtribe Flaveriinae (Asteraceae: Helenieae) and the origin of biological complexity. Origins 52:7-27.
Wood TC, Cavanaugh DP. 2003. An evaluation of lineages and trajectories as baraminological membership criteria. Occasional Papers of the Baraminology Study Group 2:1-6.
Wood TC, Murray MJ. 2003. Understanding the Pattern of Life. Nashville, TN: Broadman & Holman.
Wood TC, Wise KP, Sanders R, Doran N. 2003. A refined baramin concept. Occasional Papers of the Baraminology Study Group 3:1-14.