A CHEMIST'S PERSPECTIVE OF THE YELLOWSTONE PETRIFIED "FORESTS"
by
Clyde L Webster, Jr.
Senior Research Scientist, GRI (retired) Twin Falls, Idaho
INTRODUCTION
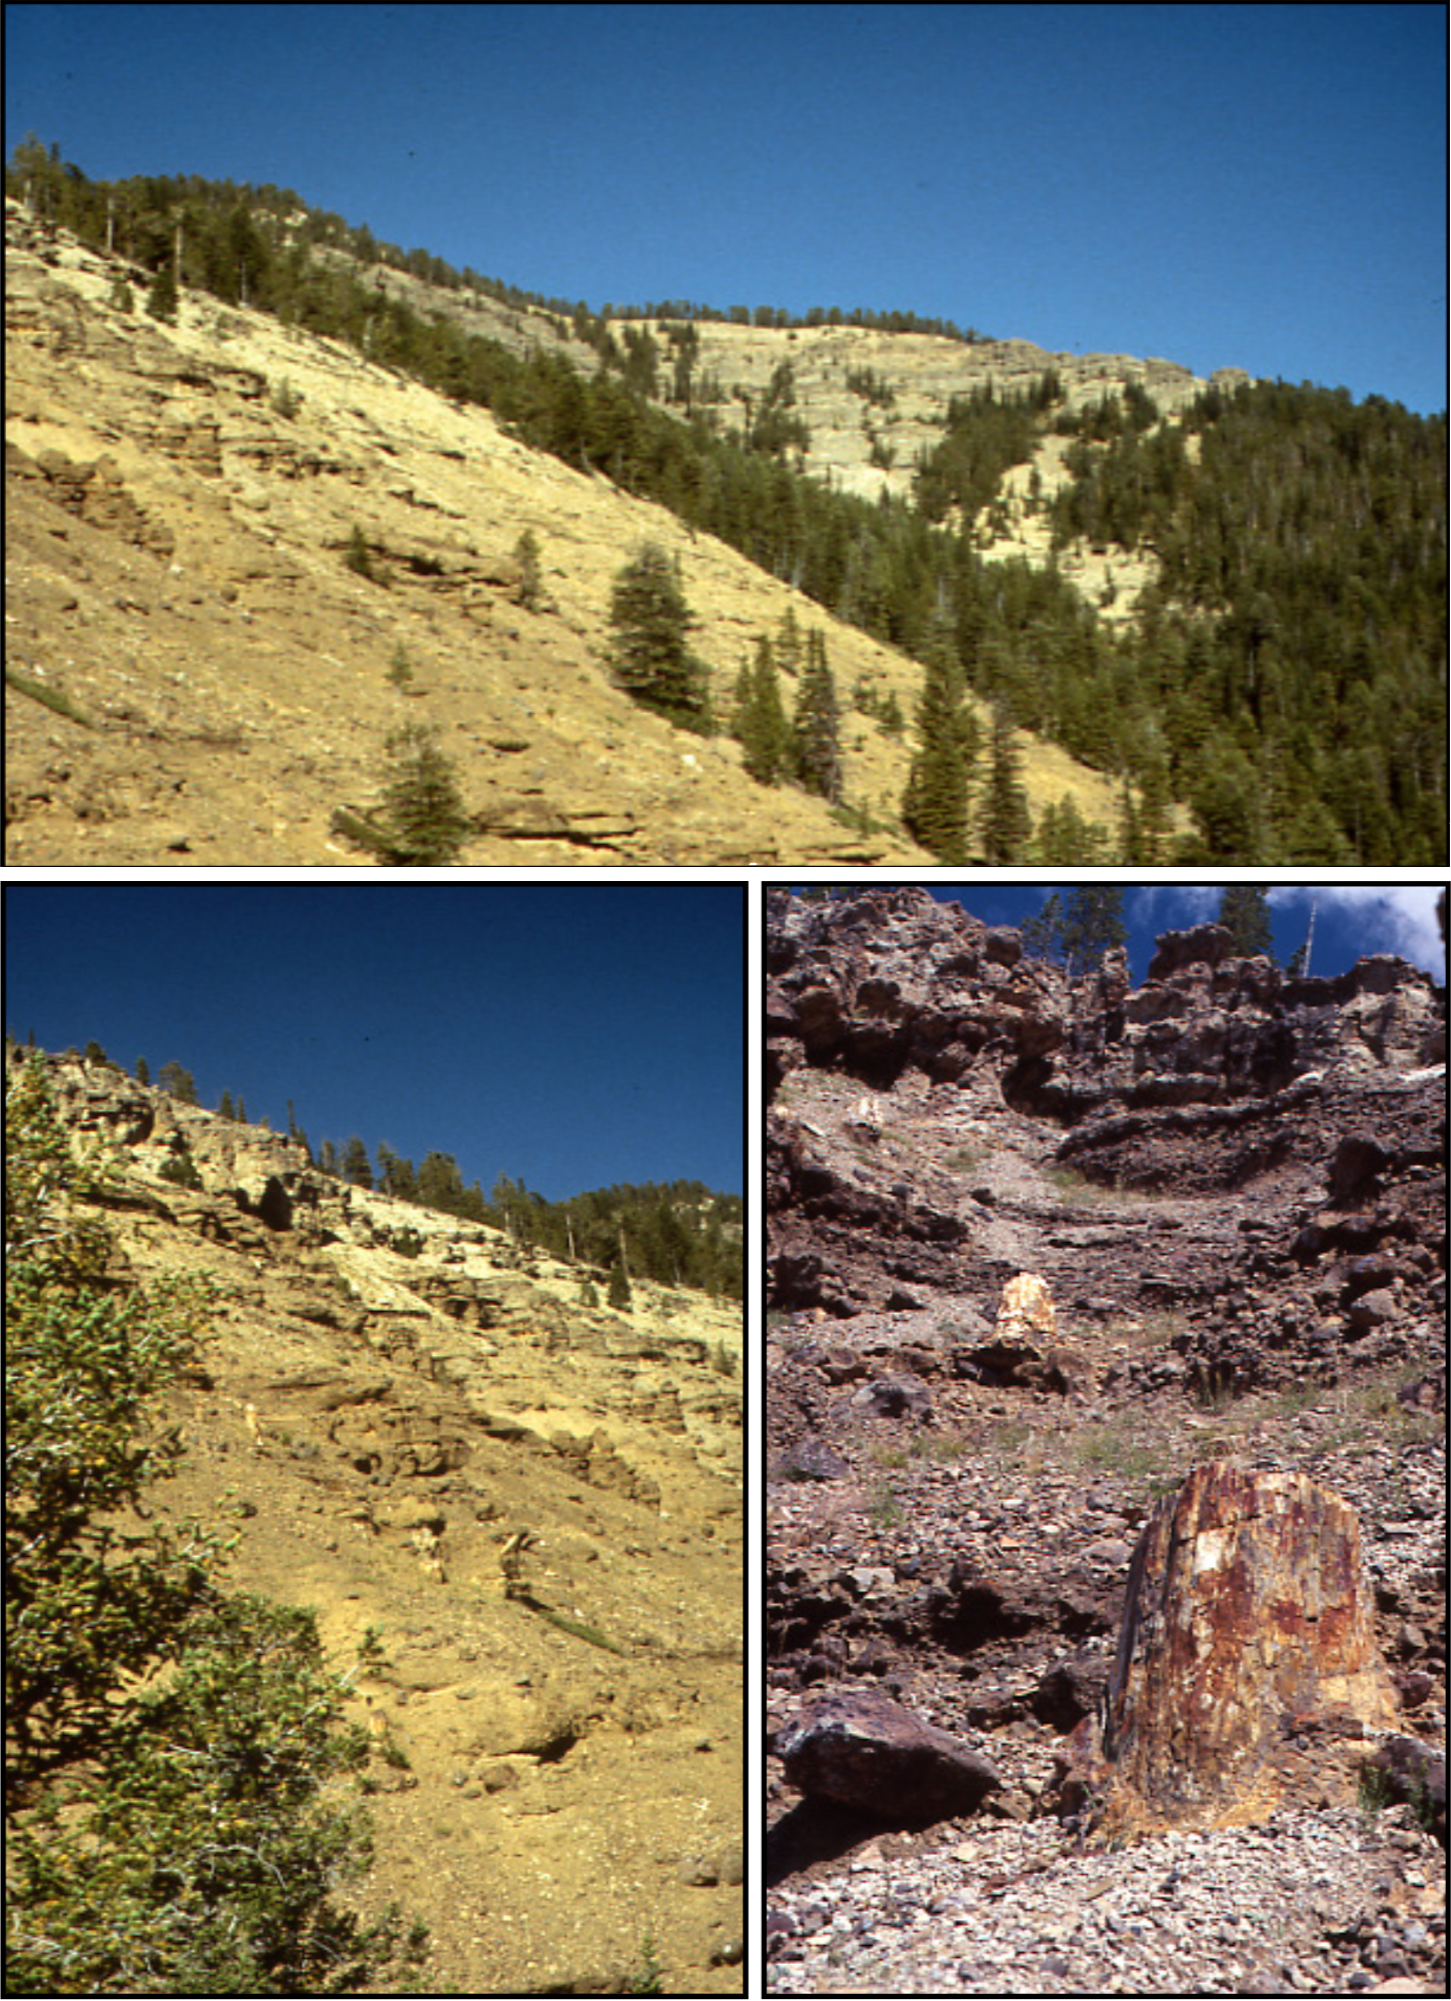
The fossil forests of Yellowstone National Park (YNP), located in Wyoming and Montana U.S.A. have attracted much interest because of the multiple levels of fossilized trees in what appears to be an upright growth position. Each individual fossil level is separated from the other levels by one or more volcanic breccia flows and one or more volcanic ash flows. Some of the fossilized trees are over four feet in diameter, representing hundreds of years of growth (Figure 1).
Figure 1. Upper, lower left: Views of the layers at Specimen Creek. Lower right: Upright stumps at Specimen Creek.
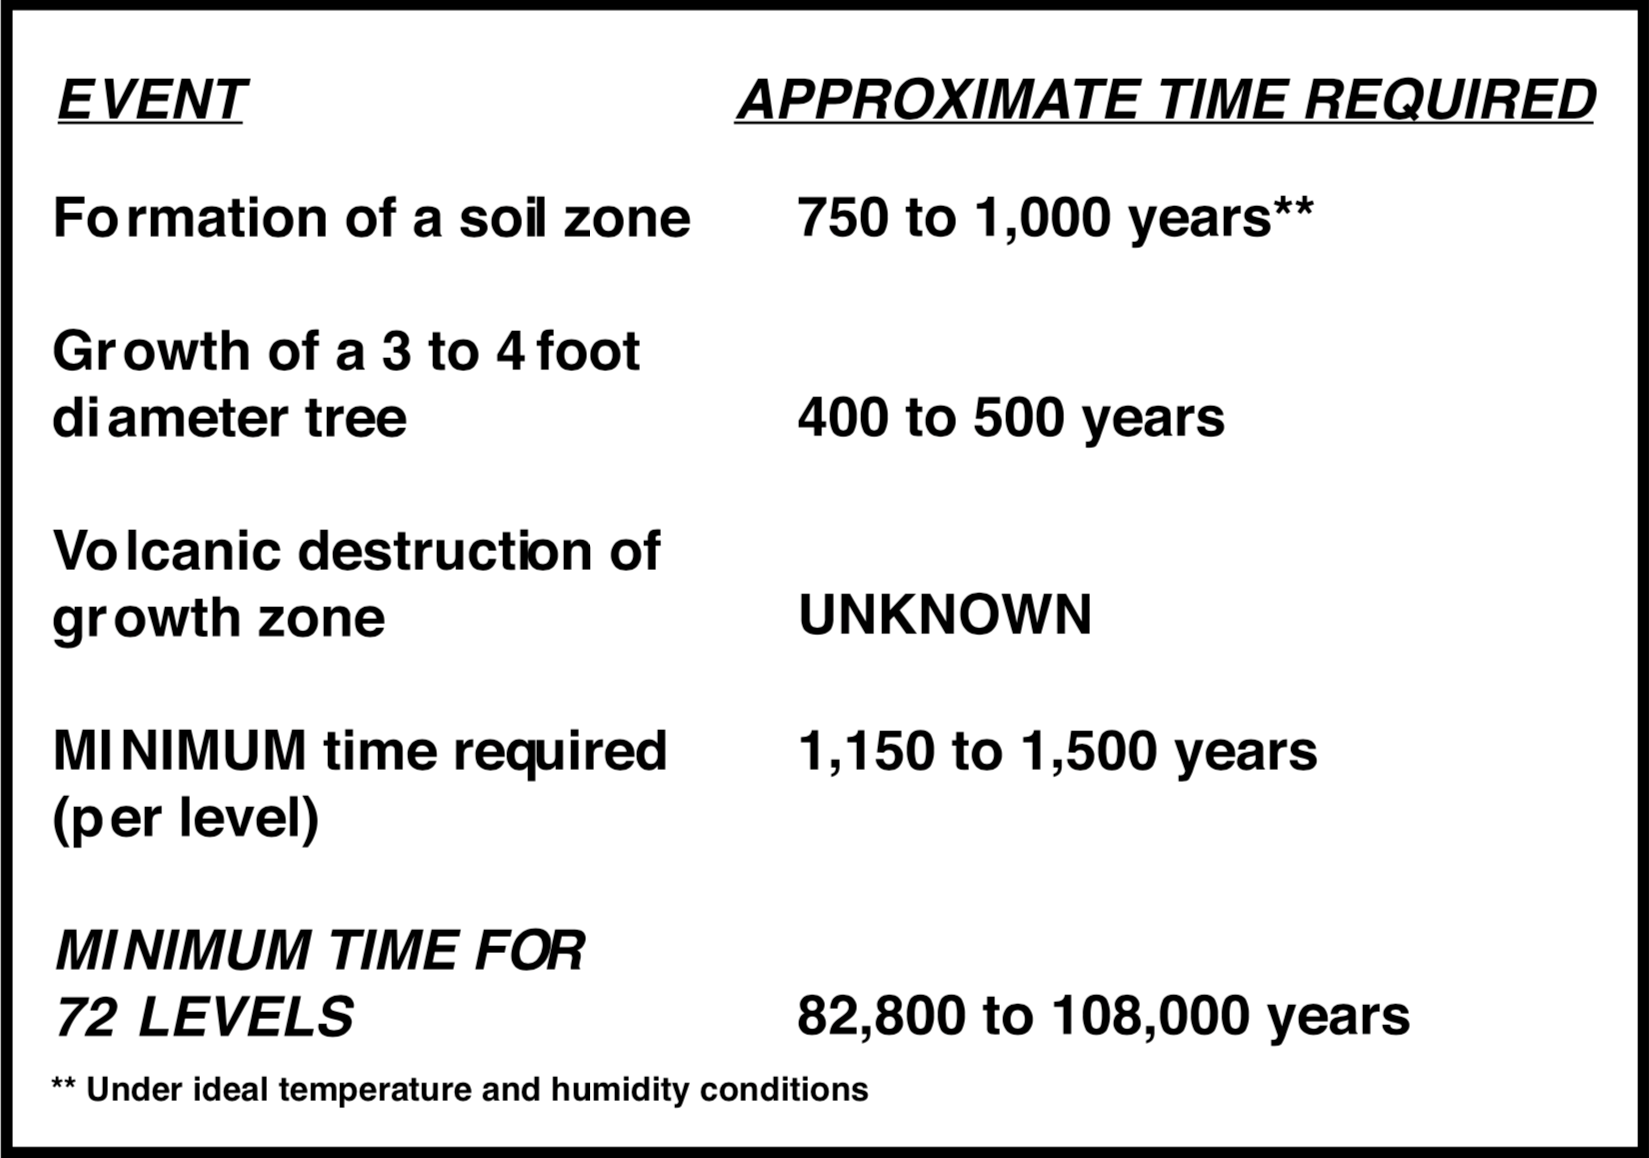
The standard geological interpretation[1] of these features requires each level to be an individual growth horizon. Such an interpretation would require, under ideal conditions of soil formation and growth, an estimated 1,100 to 1,500 years per level (Figure 2).
Figure 2. Estimate of time required for in situ growth of successive layers of forests.
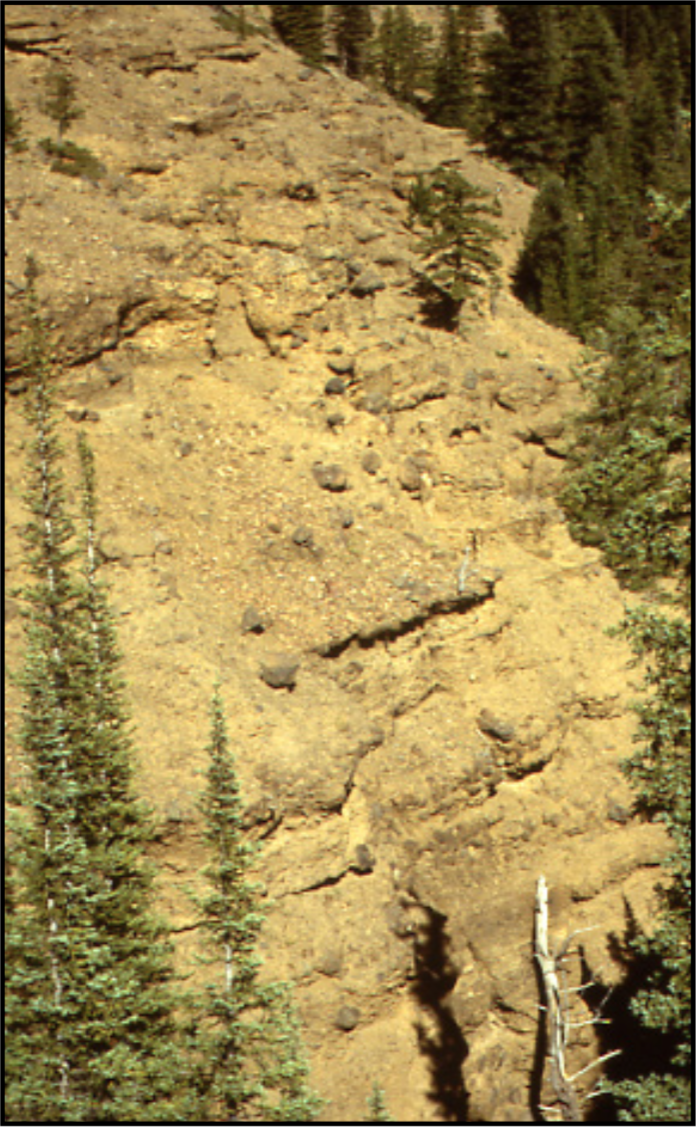
In the Specimen Creek[2] area alone there are at least 75 individual fossil levels (Figure 3). A simple calculation would suggest about 100,000 years for these levels to develop. This poses a severe time dilemma for individuals who accept the Biblical time-frame.
Figure 3. A succession of layers at Specimen Creek.
I was first introduced to the intrigue of the Yellowstone fossil forests when I joined the Chemistry Department at the La Sierra Campus of Loma Linda University.[3] Dr. Harold Coffin and several other Seventh-day Adventist scholars were devoting a great deal of time and money to the study of these “fossil forests.”[4] Dr. Coffin had pioneered research into the various fossil forest areas of YNP looking for clues that would help him unravel the many questions of origins for these magnificent fossil trees. He was responsible for introducing numerous other investigators to the “intrigue” of the forest. I am one of those bitten by the “intrigue” bug.
Dr. Coffin focused much time and research into understanding the physical environment and orientation of these fossil forests. From his, and other, studies there developed a strong argument for a transport model of the fossil forests rather than the standard “in-situ” model.[5]
My area of expertise was in trace-element analysis of inorganic materials utilizing spark-source mass spectrometry (SSMS) and energy-dispersive X-Ray fluorescence (XRF). My industrial experience in analysis of various materials, via energy-dispersive x-ray fluorescence (XRF) opened another line of inquiry into a better understanding of the fossil forests of YNP.
While attending a seminar given by Dr. Harold Coffin, I became convinced that trace element profiles of the various volcanic ash layers, associated with the fossil tree layers, could test Dr. Coffin’s hypothesis that the individual fossil layers were a result of aqueous transport rather than the generally accepted theory that each fossil layer was the result of in situ growth and forestation.
At the end of Dr. Coffin’s presentation I took the opportunity to discuss the possibilities that SSMS and/or XRF might strengthen or falsify his hypothesis of transport rather than in situ growth. The SSMS and/or XRF analysis, I suggested to Dr. Coffin, would look at the concentration of each individual element found within the sample of interest. Little did I realize then the consequences of that short conversation!
METHODS
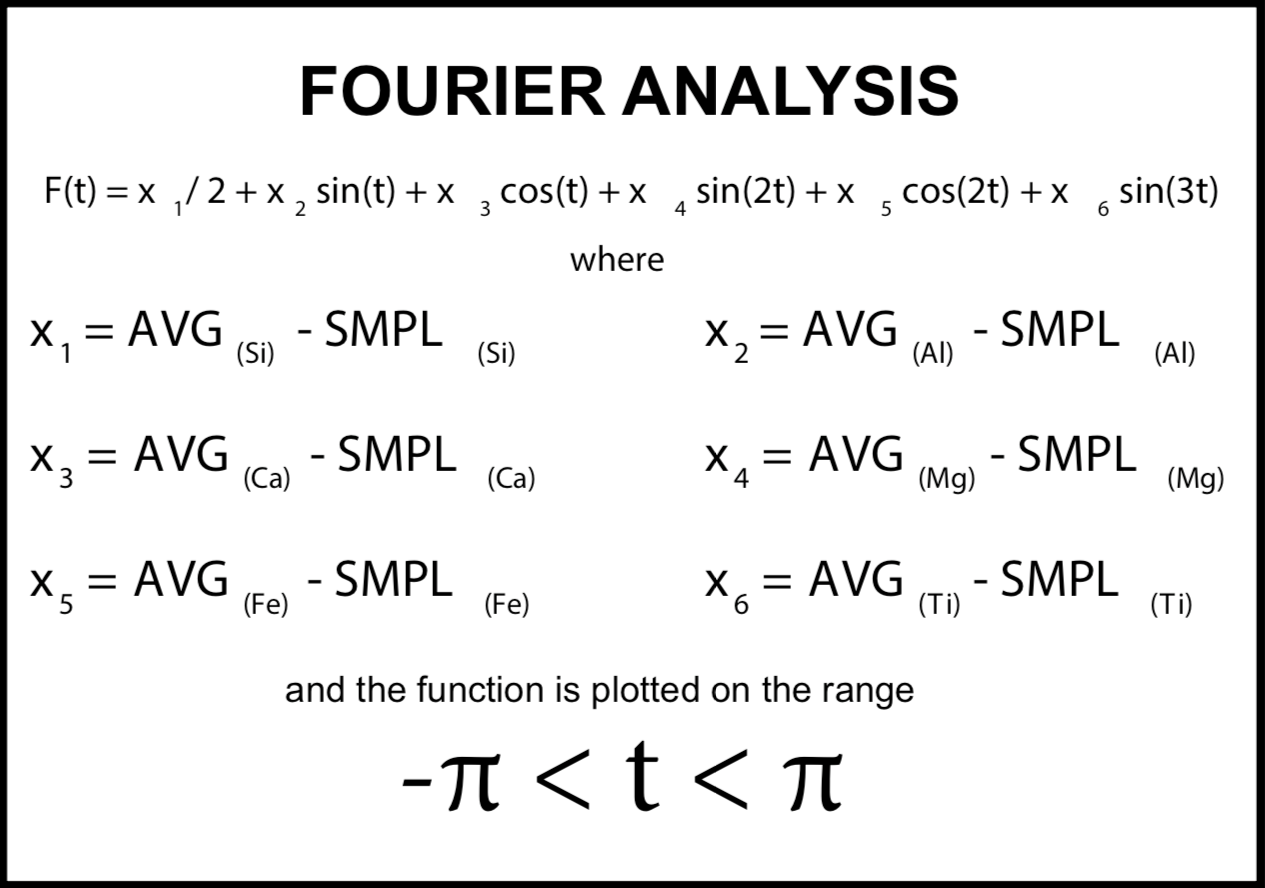
The chemical techniques used, during my research at Geoscience Research Institute (GRI), to characterize these various rock groups were the application of standard industrial trace-element analytical techniques along with statistical analyses, to geological samples. Seventeen individual elements were determined, per sample, via XRF. The elemental concentrations for each of the individual samples were then statistically combined and submitted to a Fourier analysis (see Figure 4). The Fourier analysis allows statistically sorting of chemically similar samples into discrete arrays.
Figure 4. Equation for Fourier analysis.
BASELINE STUDY
When performing any chemical analysis it is necessary to analyze known standards that have similar composition to the test materials. In the case of the fossil forest layers, the obvious choice for analysis would be the volcanic ash layers between the layers of fossilized trees. For this reason volcanic standards, obtained from the United States Geological Survey (USGS), were used as reference standards. In addition to obtaining similar standards of the materials of interest, I realized the benefits of having a known similar scenario as the area of study, just as Dr. Coffin’s research benefitted from comparing the Mount St. Helens volcanic explosion and the growth of Spirit Lake to his Yellowstone data.[6]
From 1975 through 1983, while associated with the Chemistry Departments at La Sierra and Walla Walla College,[7] I received small research grants from GRI for initial studies of the associated volcanos of the fossil forests of YNP. Then in the summer of 1983 I accepted a full-time research position with GRI in order to devote a major portion of my time to work with Dr. Coffin in order to further understand the dynamics of the fossil forests of YNP.
For my modern-day example of volcanic lava, ash, lahars and, if possible, destruction of trees and other types of vegetation, I selected the Big Island of Hawaii, the closest and most active volcanic source with its sequential lava layers.[8] I submitted a research proposal to conduct research, in cooperation with the Hawaiian Volcanic Observatory, and was granted permission to collect small samples from several historic locations.
The main area of interest was to obtain and compare elemental concentrations from dated flows and, if possible, multiple flows from a known single source which occurred over a very short period of time. The research volcanologists at the observatory were very helpful in suggesting areas that would be suitable for my research.
A baseline study of known historical lava flows was conducted in order to determine the applicability of these analytical techniques to lava and ash samples. Hawaiian lava samples from the Big Island of Hawaii were collected from several overlapping flows. Some of these flows were from the same source area separated in time by a few days to several years. Other overlapping flows were from different sources.
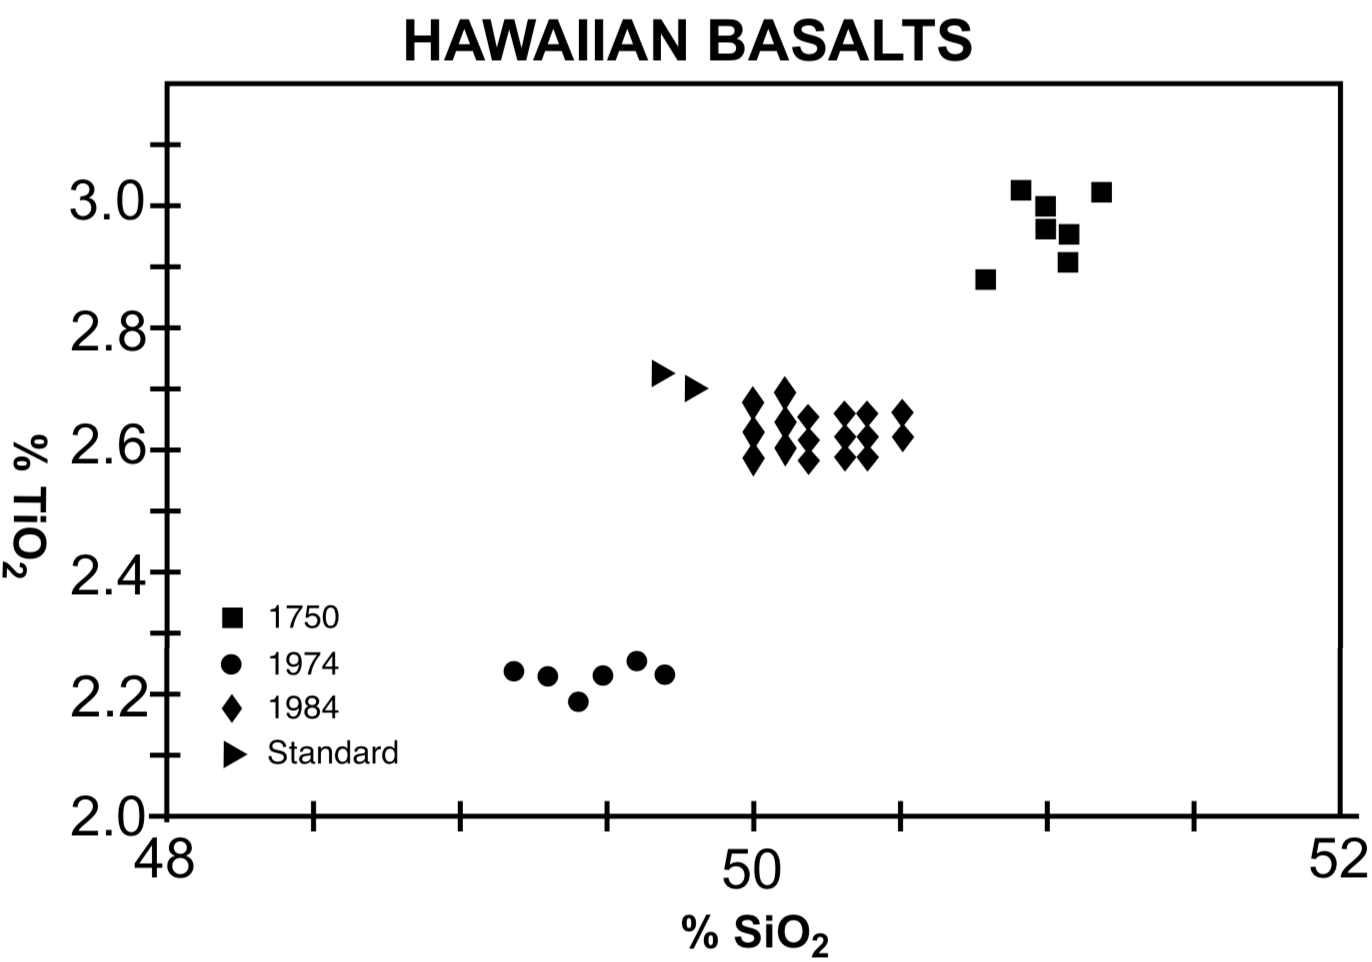
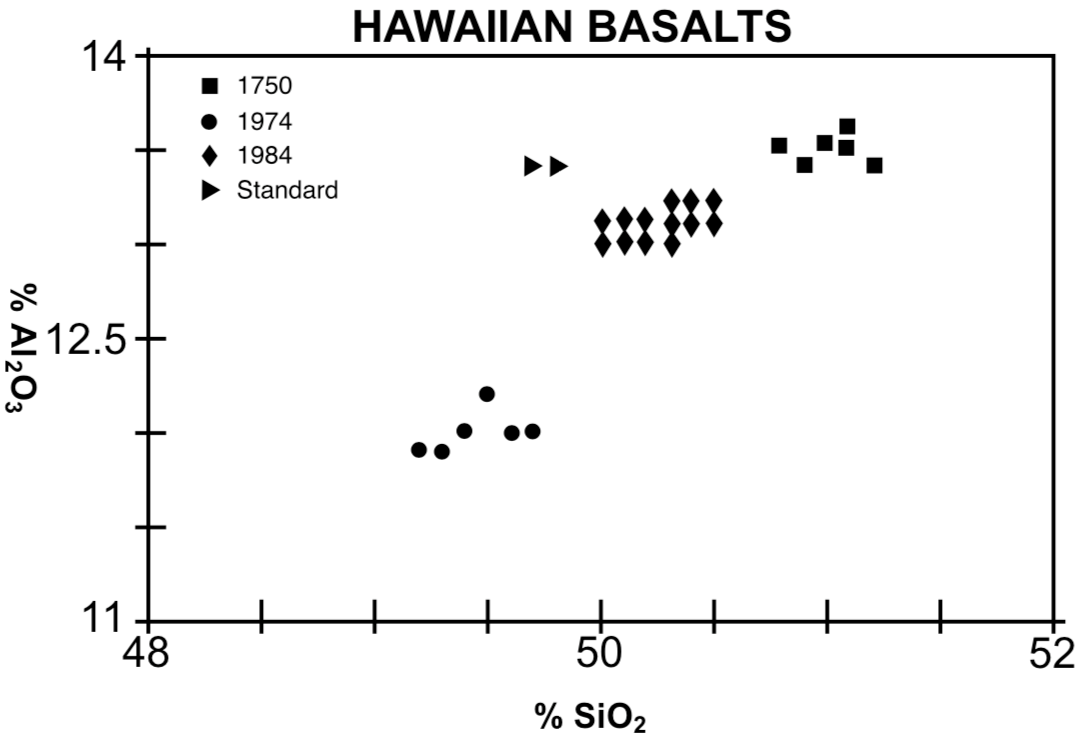
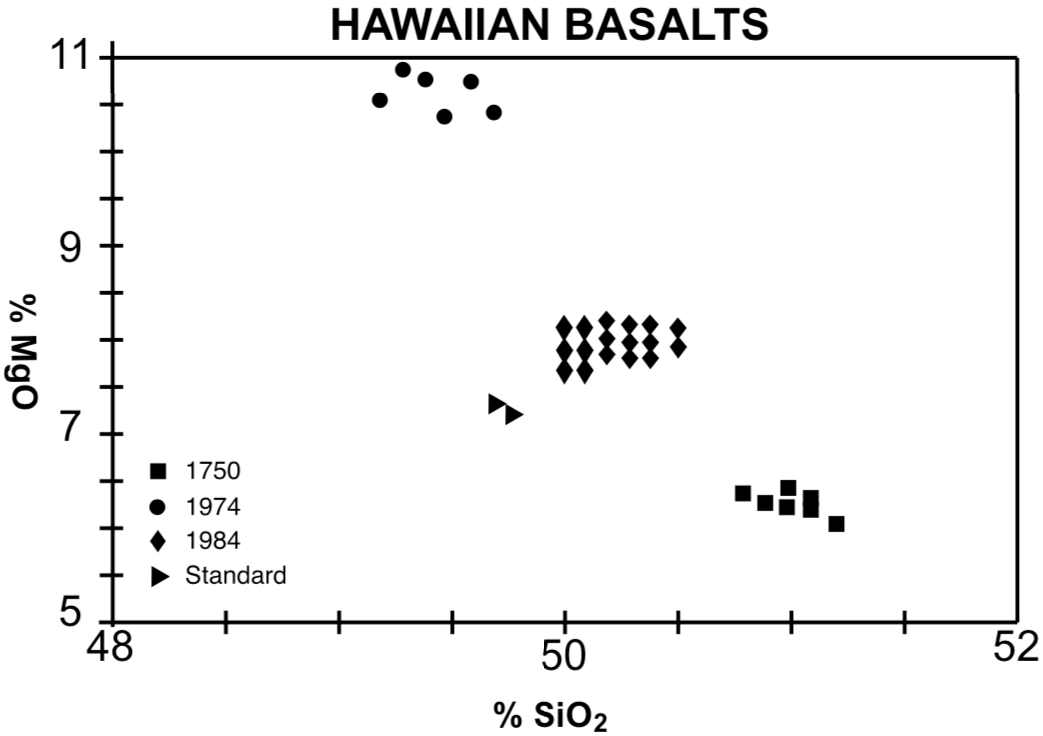
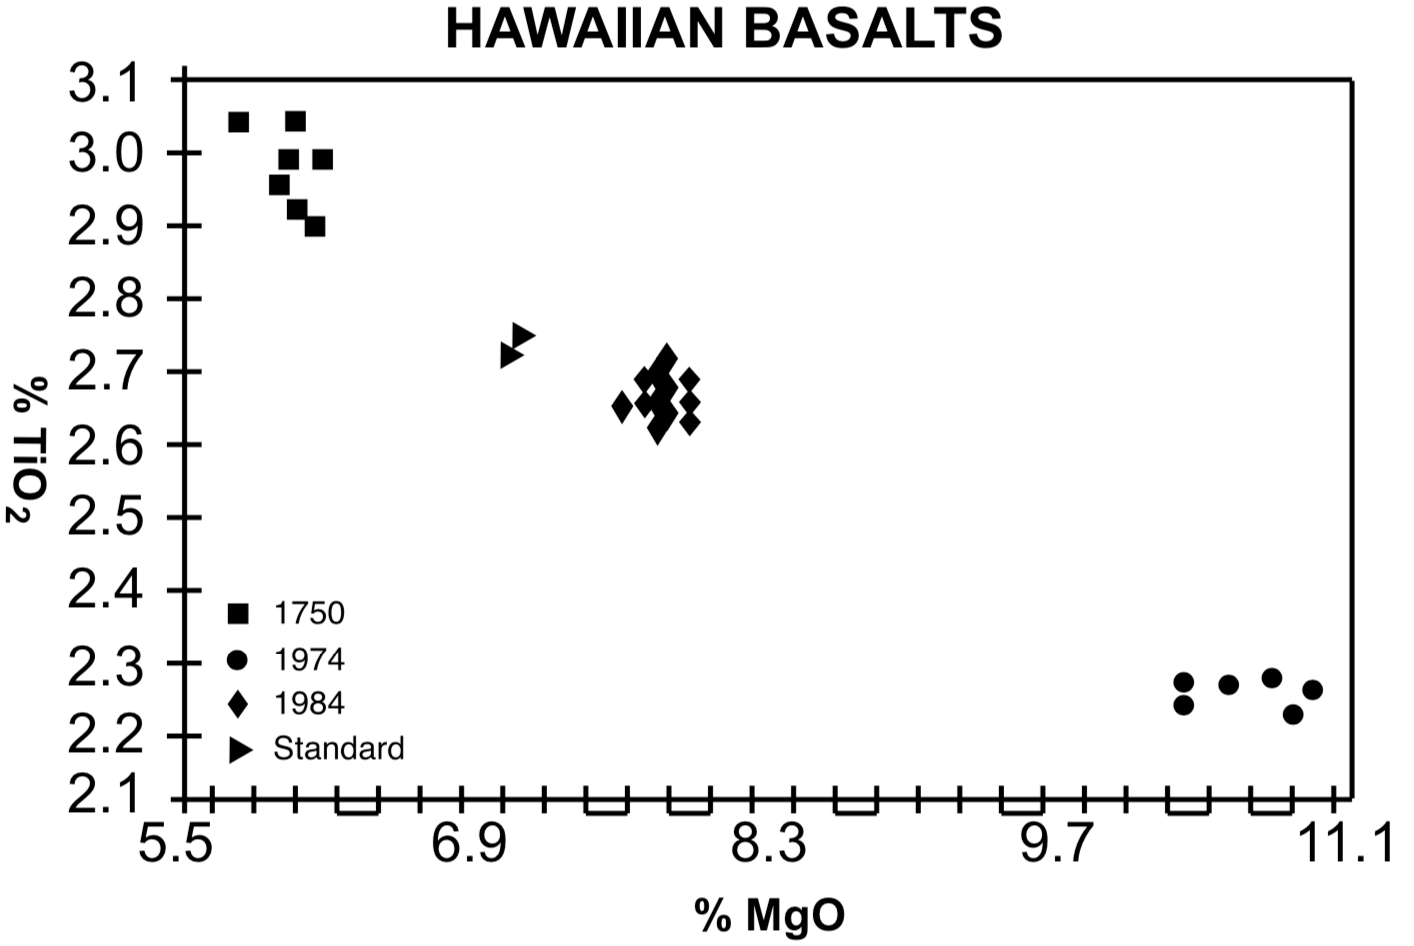
Over 600 individual samples were collected from three major flows which occurred in 1750, 1974, and 1984. The samples were then prepared in the laboratory and analyzed for their chemical concentrations using XRF. The elemental data were then graphed using standard X-Y plots (Figure 5).
Figure 5 Binary plots showing differentiation of historical Hawaiian flows based on different trace elemental ratios.
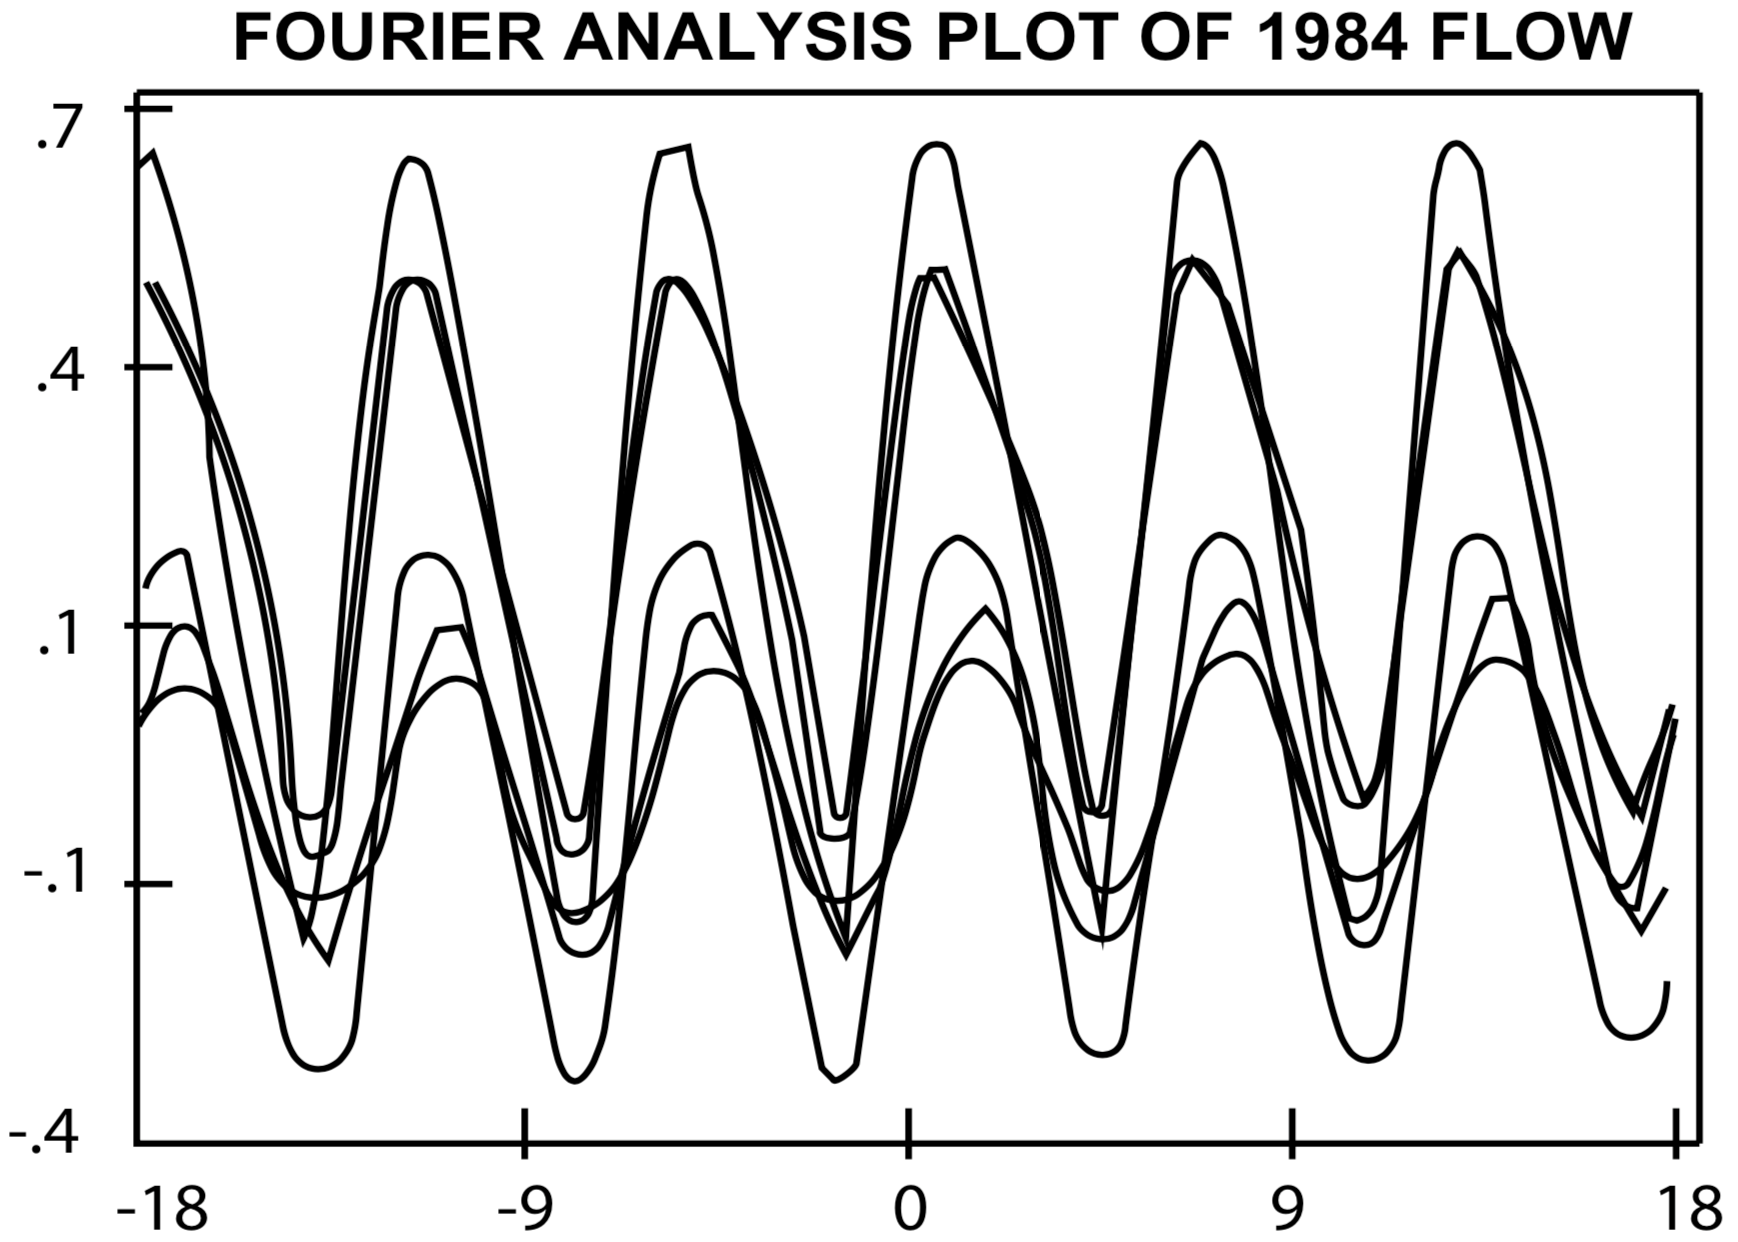
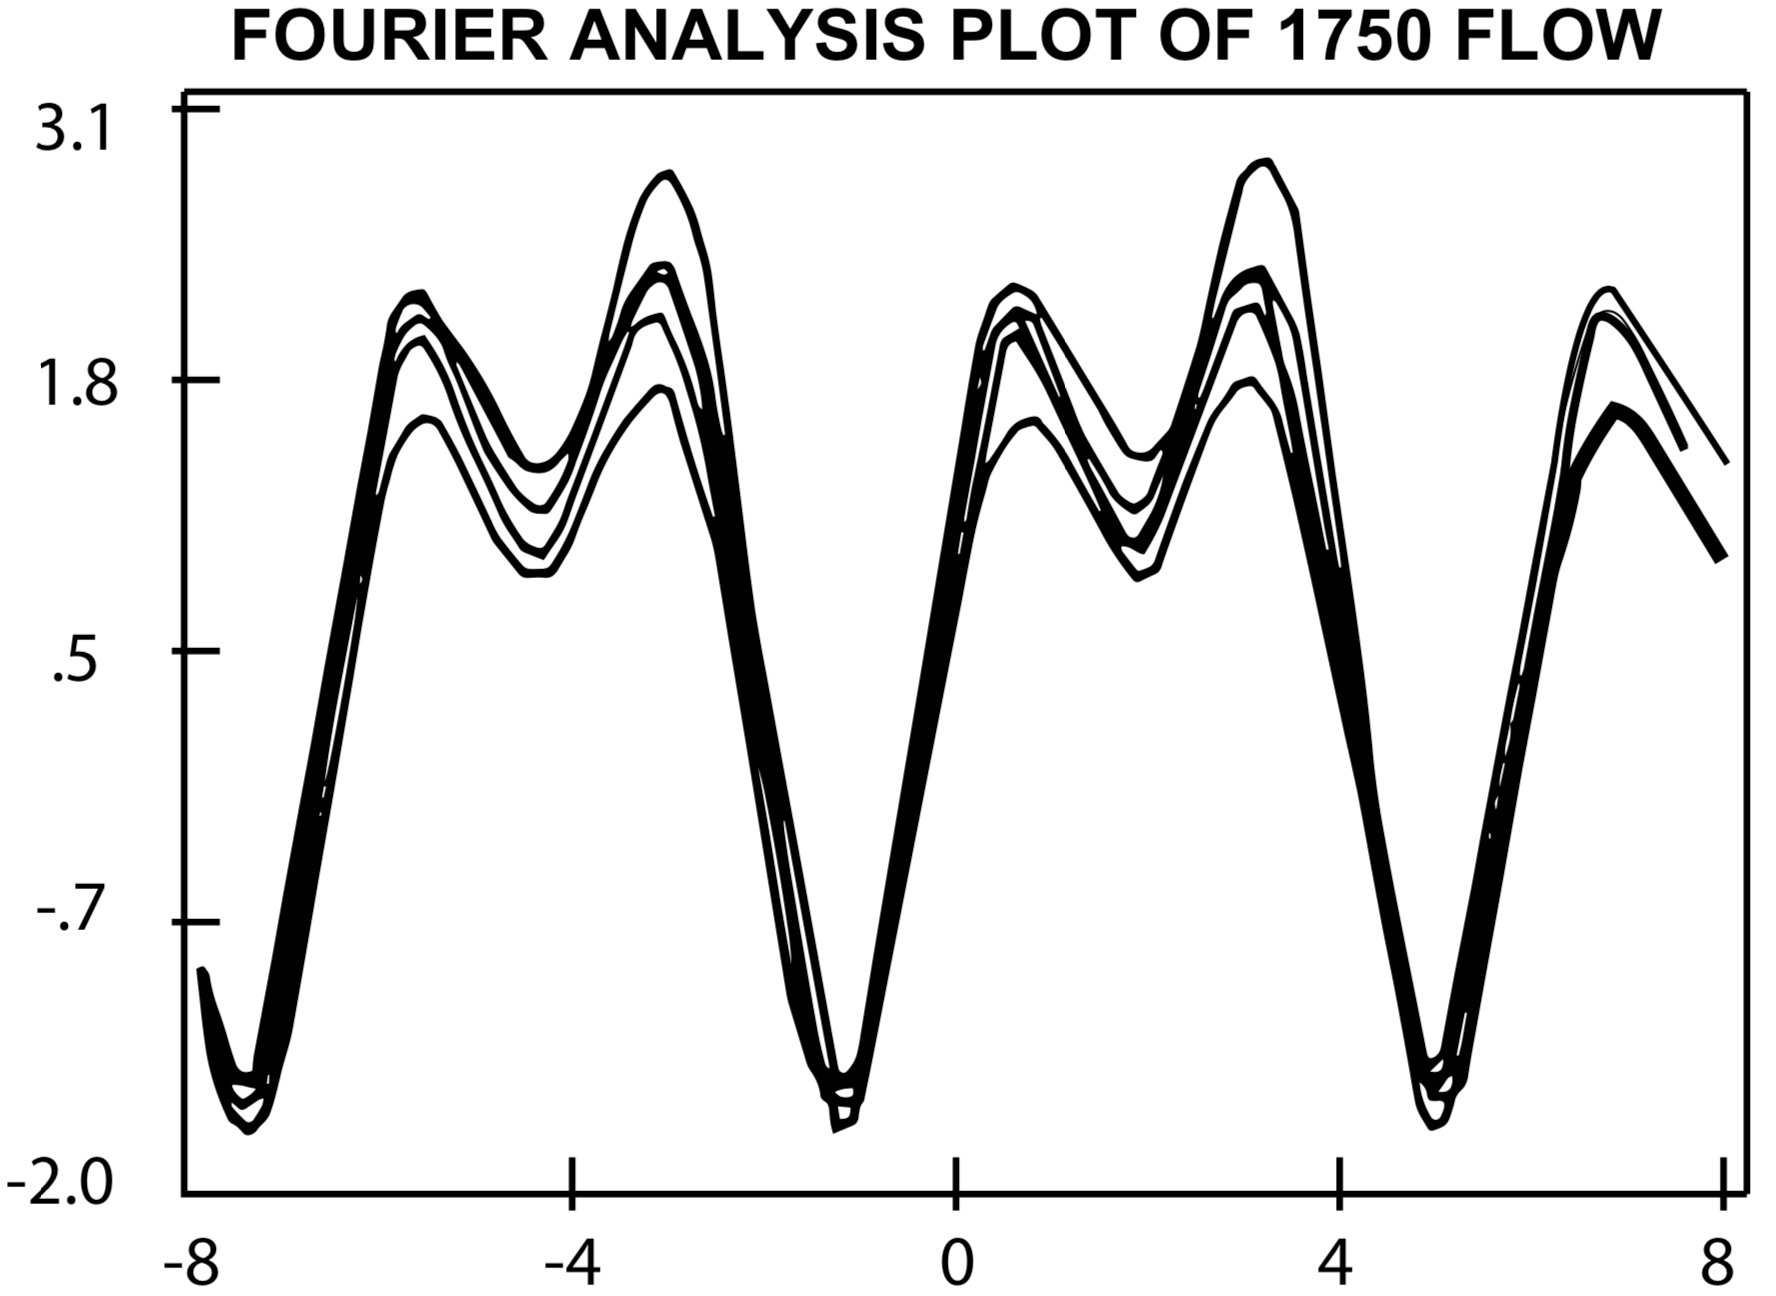
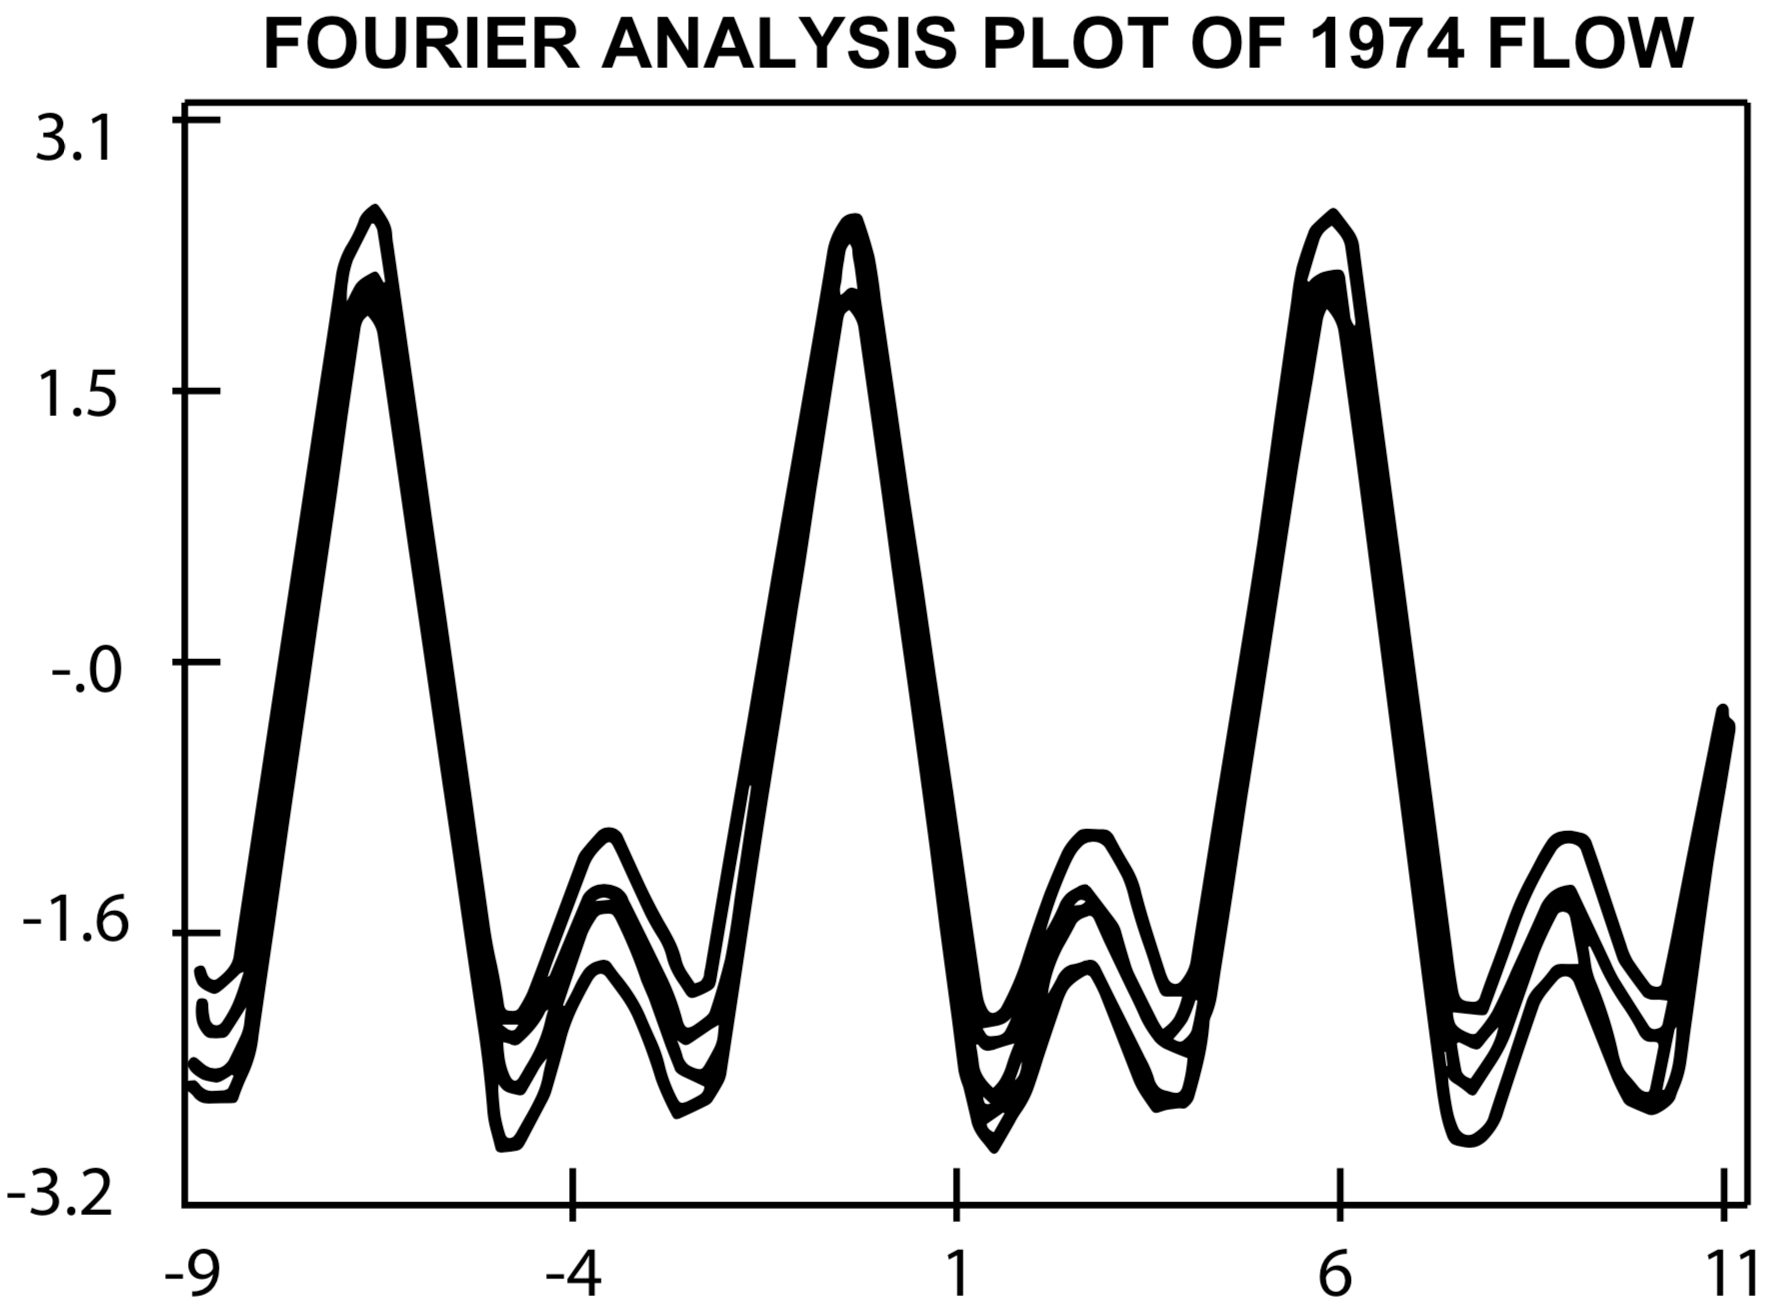
Once the data were plotted it became obvious that further additional analyses were needed which would allow simultaneous multi-element representation. Fourier analysis was chosen because it could represent multiple elements in an easy-to-understand format of curves and when analyzed and plotted, similar compositions would produce similar curves (Figure 6).
Figure 6. Fourier analysis plots of trace-element analyses for three historically dated Hawaiian basalt-flows from the same source.
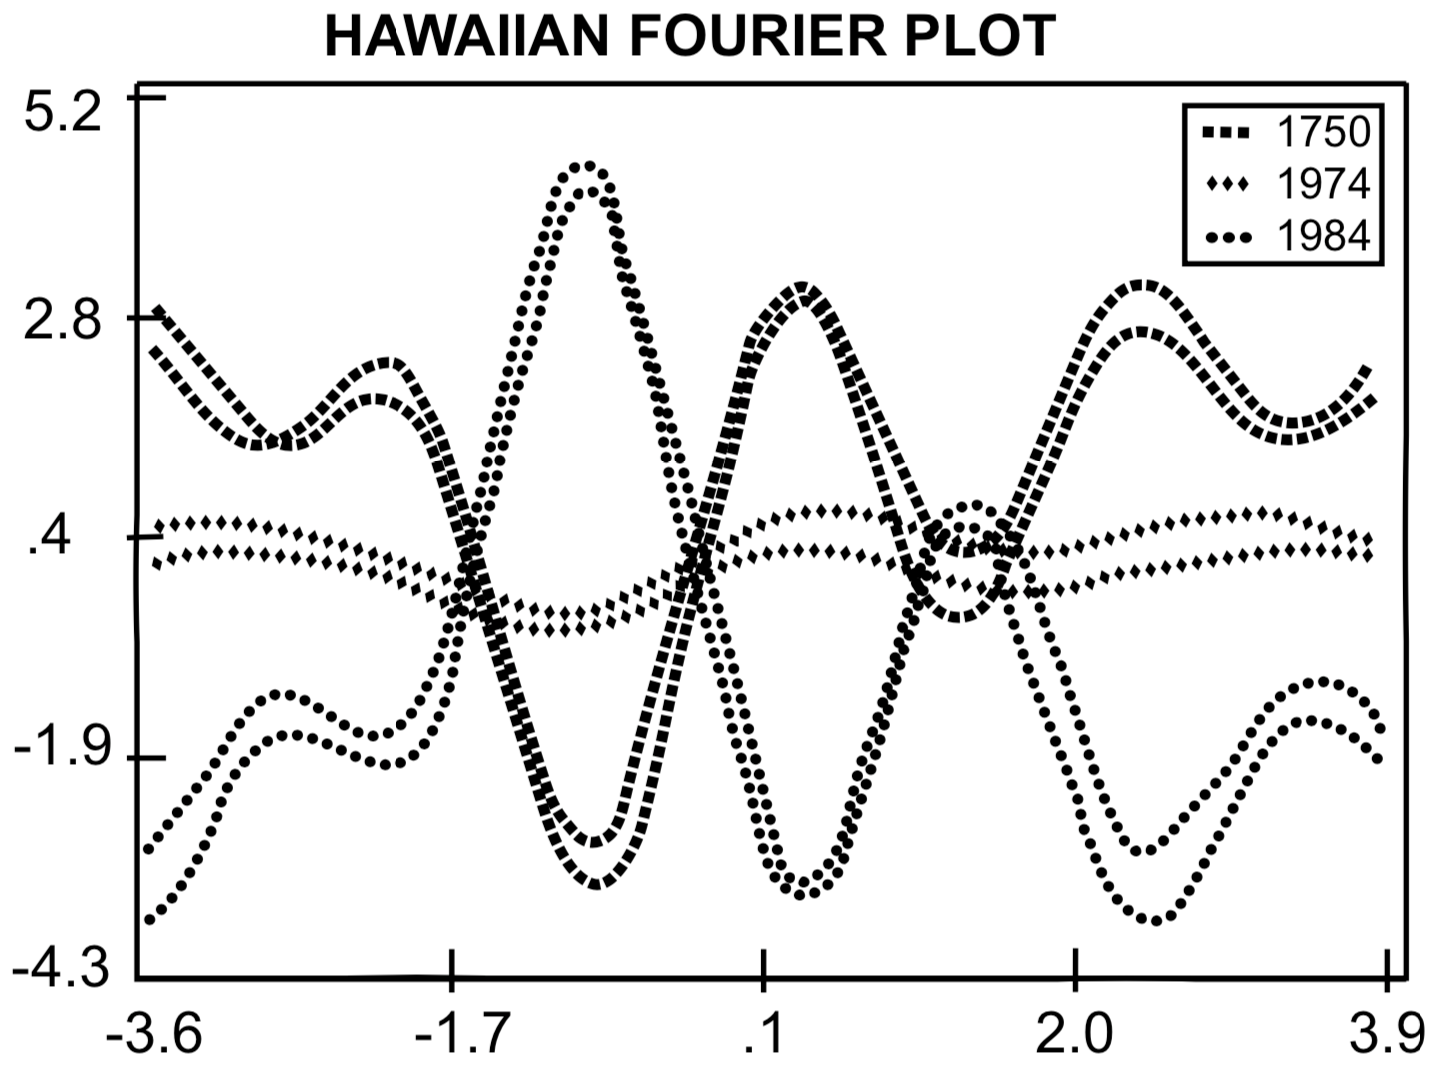
After data from the three individual major Hawaiian flows were analyzed, the data bases of all three flows were then combined and submitted to the Fourier analysis to see if the combined data set would give just one curve or if the individual data sets would separate out thereby yielding their individual data curves. As shown in Figure 7, the data sets for the individual flows separated out giving only three distinct Fourier plots.
Figure 7. Fourier analysis plots showing three different curves representing trace-element analyses for three different lava flows from the same Hawaiian source.
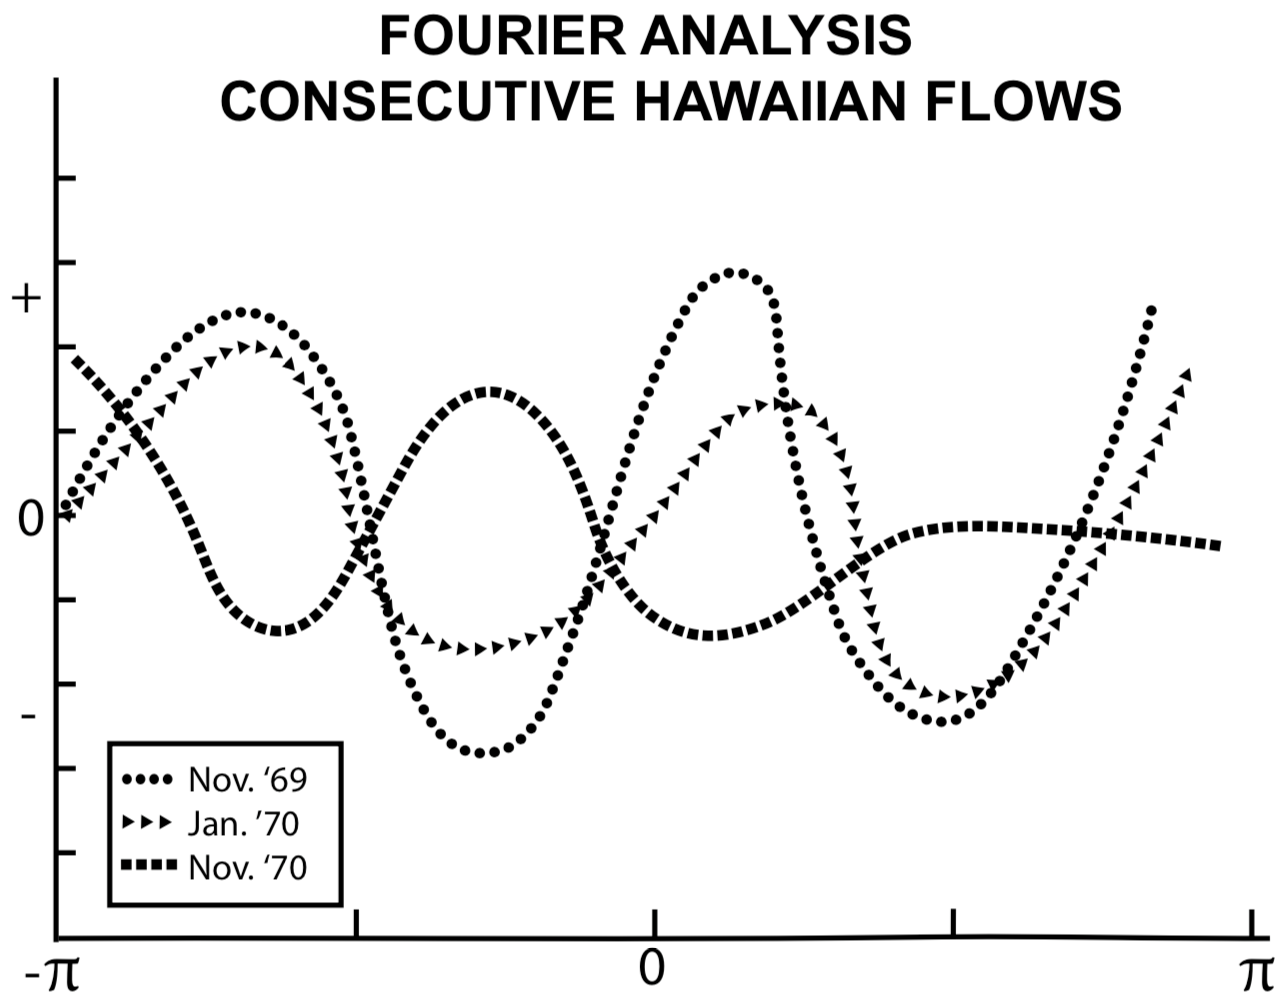
The second major data set analyzed was the consecutive Hawaiian flows occurring over a short period of time. As shown in Figure 8, the Fourier analysis successfully differentiated two flows coming from the same source with eruptions several months apart. However, two flows from the same source that were separated by only two months were not clearly differentiated.
Figure 8. Fourier analysis plots of trace-element analyses for three dated Hawaiian lava flows at different times from a single source. Eruptions separated by two months gave similar curves, while the eruptions separated by twelve months were clearly distinguished.
CONCLUSIONS OF THE BASELINE STUDY
In my study, the chemical composition of different volcanic rock was unique allowing individual events to be distinguished from one another. This ability to differentiate one volcanic eruption from another seemed to hold true even if the rocks come from the same volcanic source, providing there is sufficient time of separation between eruptions.[9]
APPLICATION TO YELLOWSTONE FOSSIL FORESTS
With a proven analysis technique from known dated flows, attention was then focused on the multiple ash layers of the Yellowstone Fossil Forest area known as Specimen Creek.[10] With the assistance of Dr. Coffin, over 1000 volcanic ash or breccia samples were collected from over 100 separate levels from sample areas 1A and 1B located in the Specimen Creek area (see Figures 1, 3, and 10).
After the initial preparation, samples were submitted for XRF analysis. The data were then analyzed using the Fourier analysis method previously established as able to separate individual flows from one another.
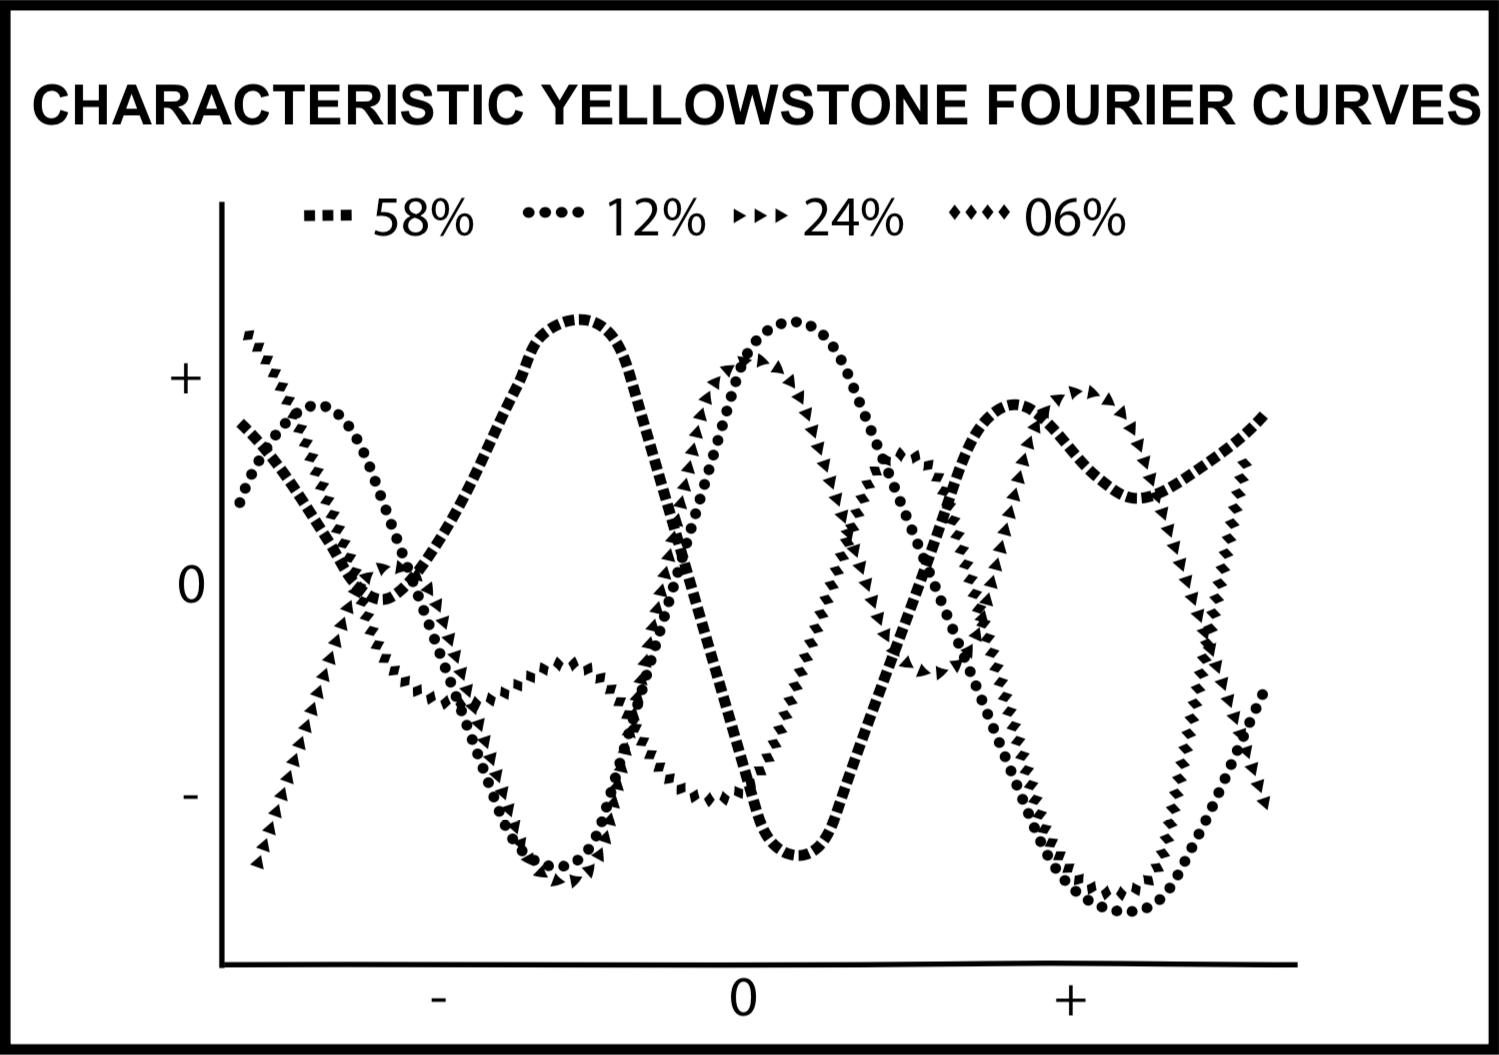
The results of the Fourier analysis plots were quite unexpected yet highly satisfying. Instead of a mixed jumble of multiple curves, the data plots separated into four distinct graphs, as shown in Figure 9. Four distinct curves, not 100!
Figure 9. Comparison of typical Fourier analysis curves of trace element analyses for ash levels at Specimen Creek. The majority (58%) of the ash levels gave chemical signature 1, as shown on the graph.
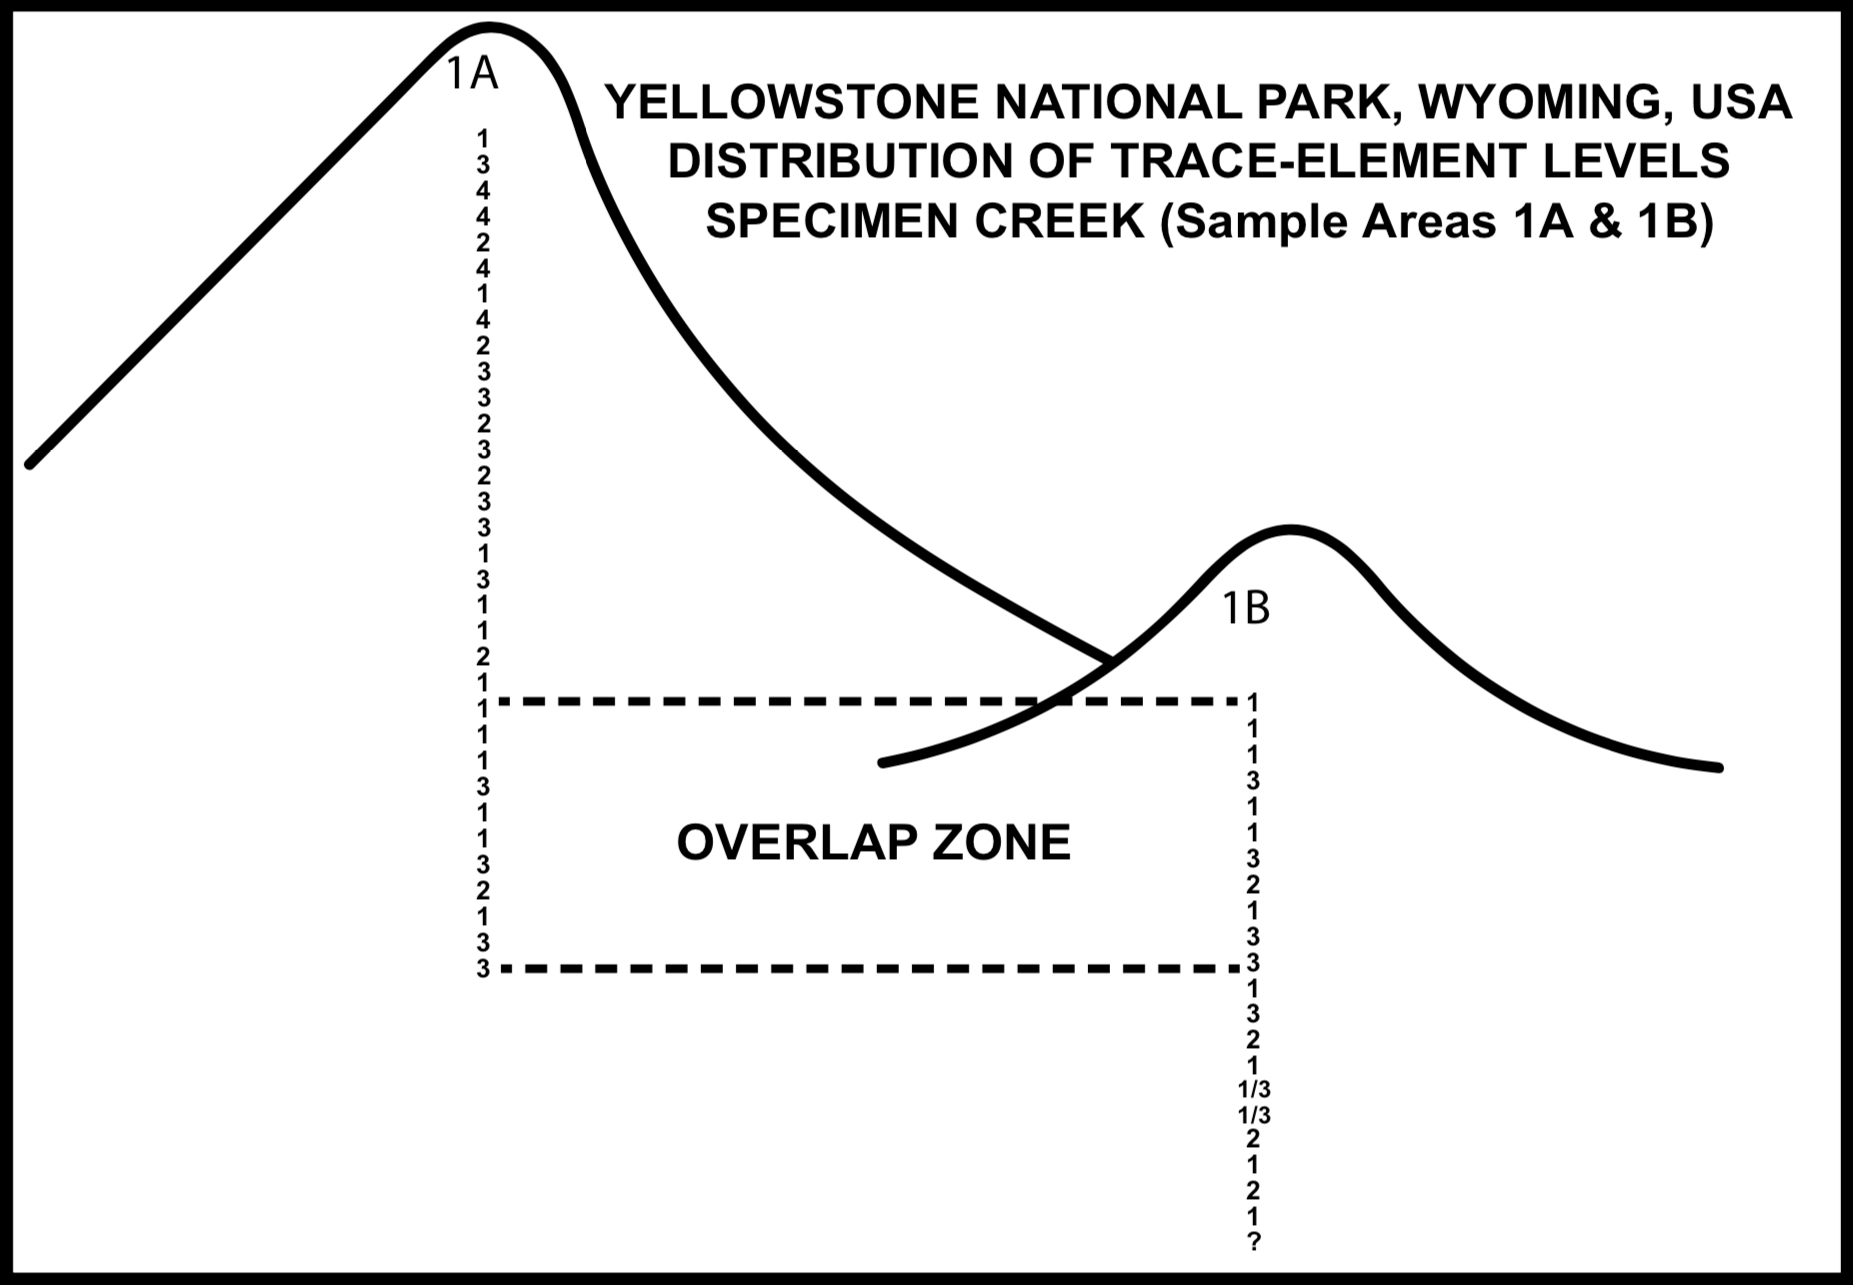
Even more surprising and interesting, as the data sets were plotted versus position of collection, the four different chemical signatures were interspersed throughout the sequence of ash levels (see Figure 10).
Figure 10. Schematic diagram showing the interbedding of four distinct chemical signatures in ash levels from sample areas 1A and 1B at Specimen Creek.
The results indicated that there were four dominant interbedding volcanic breccia’s and/or ashes that combine to produce the seventy-five levels of fossil material rather than seventy-five distinctly separate levels, as proposed by the standard “in situ” interpretation.[11]
DISCUSSION
The consistent chemical signatures, interbedded throughout the section, suggest that the four source areas were active over the same time period, but during that time period they did not all erupt at the same moment. With few exceptions, each of the “fossil forest” ash levels was receiving ash from only one of the sources. During this time period the ash from one any one source area remained similar enough to indicate that the overall time for deposition of the “fossil forests” was fairly short.
Discovering that the numerous ash layers at Specimen Creek can be attributed to just 4 distinct sources that do not exhibit significant geochemical variation would be highly compatible with a model suggesting a short period of time for the formation of the succession. It would seem unlikely that over a period of 100,000 years the geochemical signature of separate volcanic events would remain so consistent. Therefore, geochemical data could be nicely integrated to support Dr. Coffin’s research conclusions that the fossil forests of Specimen Creek do not represent multiple successive reforestations.
These findings strongly support a transport model in which the material is being brought in from four primary source areas, intermittently active over the same time interval and producing the observed interbedding of chemical signatures.
The eruption of Mt. Saint Helens has supplied researchers with a modern-day analog for the buildup, layering, and transport of trees and volcanic material, similar to that observed in the Specimen Creek fossil “forest” in Yellowstone National Park. Further research comparing the two areas may reveal additional information about the conditions under which the Yellowstone fossil forests were deposited.
The seminal results obtained by this project helped to lay out some valuable questions that could be pursued through additional geochemical and statistical analyses. It is hoped that a renewed impetus for investigation will lead to the further characterization of different volcanic sources, their relation to distinct volcanic products at Specimen Creek, and the time implications of these findings.
ENDNOTES
[1]Dorf E. 1964. The Petrified Forests of Yellowstone Park. Scientific American 210:106-112.
[2]Not to be confused with Specimen Ridge, the location of another “fossil forest” in Yellowstone National Park.
[3]Located in Riverside, California, now La Sierra University.
[4]E.g., (a) Chadwick A, Yamamoto T. 1983. A Paleoecological Analysis of the Petrified Trees in the Specimen Creek area of Yellowstone National Park, Montana, U.S.A. Palaeogeography, Palaeoclimatology, Palaeoecology 45:39-48; (b) Coffin HG. 1976. Orientation of Trees in the Yellowstone Petrified Forests. Journal of Paleontology 50:539-543. (c) DeBord PL. 1979. Palynology of the Gallatin Mountain “Fossil Forest” of Yellowstone National Park, Montana: Preliminary Report. First Conference on Scientific Research in the National Parks. US Department of the Interior. National Park Service Transactions Proceedings Series 5:159-164; (d) Arct MJ. 1991. Dendroecology in the Fossil Forests of the Specimen Creek Area, Yellowstone National Park. PhD Dissertation, Loma Linda University. 98 p.
[5]For a summary, see Coffin HG. 1997. The Yellowstone Petrified “Forest.” Origins 24(1):2- 44. Support for transport of at least some of the petrified trees was provided in Fritz WJ. 1980. Reinterpretation of the Depositional Environment of the Yellowstone “Fossil Forests.” Geology 8(7):309-313.
[6]Coffin HG. 1987. Sonar and Scuba Survey of a Submerged Allochthonous “Forest” in Spirit Lake, Washington. Palaios 2(2):178-180.
[7]Located in College Place, Washington, now Walla Walla University.