COMPATIBILITY OF BIBLICAL CHRONOLOGY WITH C-14 AGE
by
R. H. Brown Yucaipa, California
WHAT THIS ARTICLE IS ABOUT
The essential agreement between C-14 age and real time over the past 3000-3500 years is readily accounted for by the equilibrium inventory of C-14 that can be expected to have been established in the Upper Biosphere within 1000-2000 years after the Genesis Flood. With continuation of the present circumstances, the Lower Biosphere (ocean below ~300 ft and associated sediment) cannot be expected to reach equilibrium status for C-14 until more than 20,000 years into the future, but there is a reasonable model for accumulation of the present total biosphere C-14 inventory within 5000 years since the flood. Tree ring calibration of C-14 age data beyond 1500 BC presents a challenge of faith for a choice between a biosphere model that accommodates the chronological data in the Bible and one that has been developed without such restriction.
This article corrects deficiencies in previous treatments of C-14 dating by the author due to failure to recognize that published estimates for the formation of C-14 are usually based on the assumption that the total biosphere is in equilibrium (infinite age condition) for C-14. And it incorporates some recently published data that are significant for placing C-14 age data within a biblical time frame.
INTRODUCTION
For over 40 years C-14 age data have been widely recognized as a major challenge to a chronological framework that accommodates the historical data in Genesis and Exodus. Much dedicated effort has been expended in the search for a biosphere model that satisfactorily incorporates both the available data concerning C-14 inventory and the chronological constraints derived from a straightforward historical-grammatical exegesis of the Bible.[1]
As one who has experienced limited satisfaction and also frustration in this effort, I offer the following as an additional contribution toward a satisfactory treatment of the C-14 age problem in biblical creationism. At the outset I must express my conviction that no treatment of C-14 age can establish the validity of the historical details in the Bible. Evidence for the validity of those details must be accessible to individuals who know nothing about C-14 and the sciences involved in C-14 dating. Our goal is a scientifically acceptable explanation/interpretation of C-14 data from the perspective of the Bible record.
Such explanation/interpretation must deal with three basic considerations.
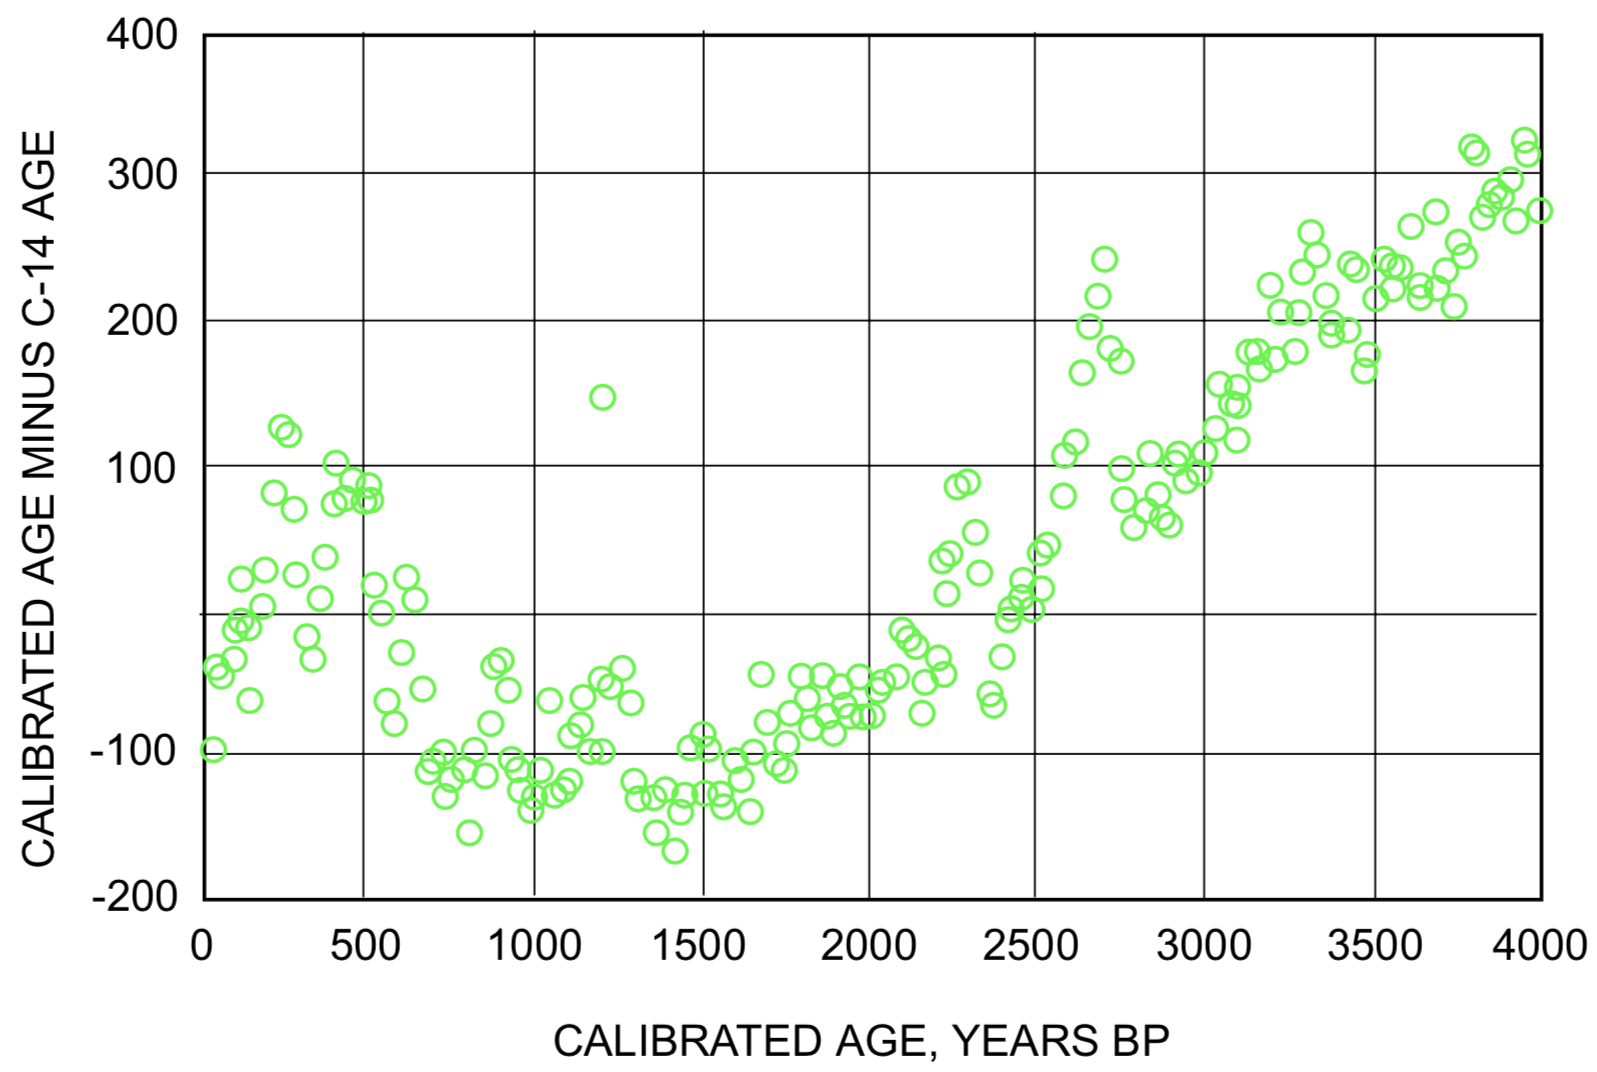
The average agreement between C-14 age and unquestioned real time age within about ±100 years over the past 3000 years (see Figure 1).
The current inventory of C-14 in the world's carbon exchange system the combination of upper and lower biosphere.
The dendrochronological calibration of C-14 ages extending to ~8000 years[2] (and recently extended to ~22,000 years by U-Th disequilibrium dating[4]).
FIGURE 1. Dendrochronological calibration of C-14 age. Ordinates are the number of years that must be added to a C-14 age to obtain its associated tree-ring calibrated age, as specified on the abscissa. Data from References 2 and 3. BC/AD division is at 1950 BP.
AGREEMENT OF C-14 AGE WITH REAL-TIME AGE
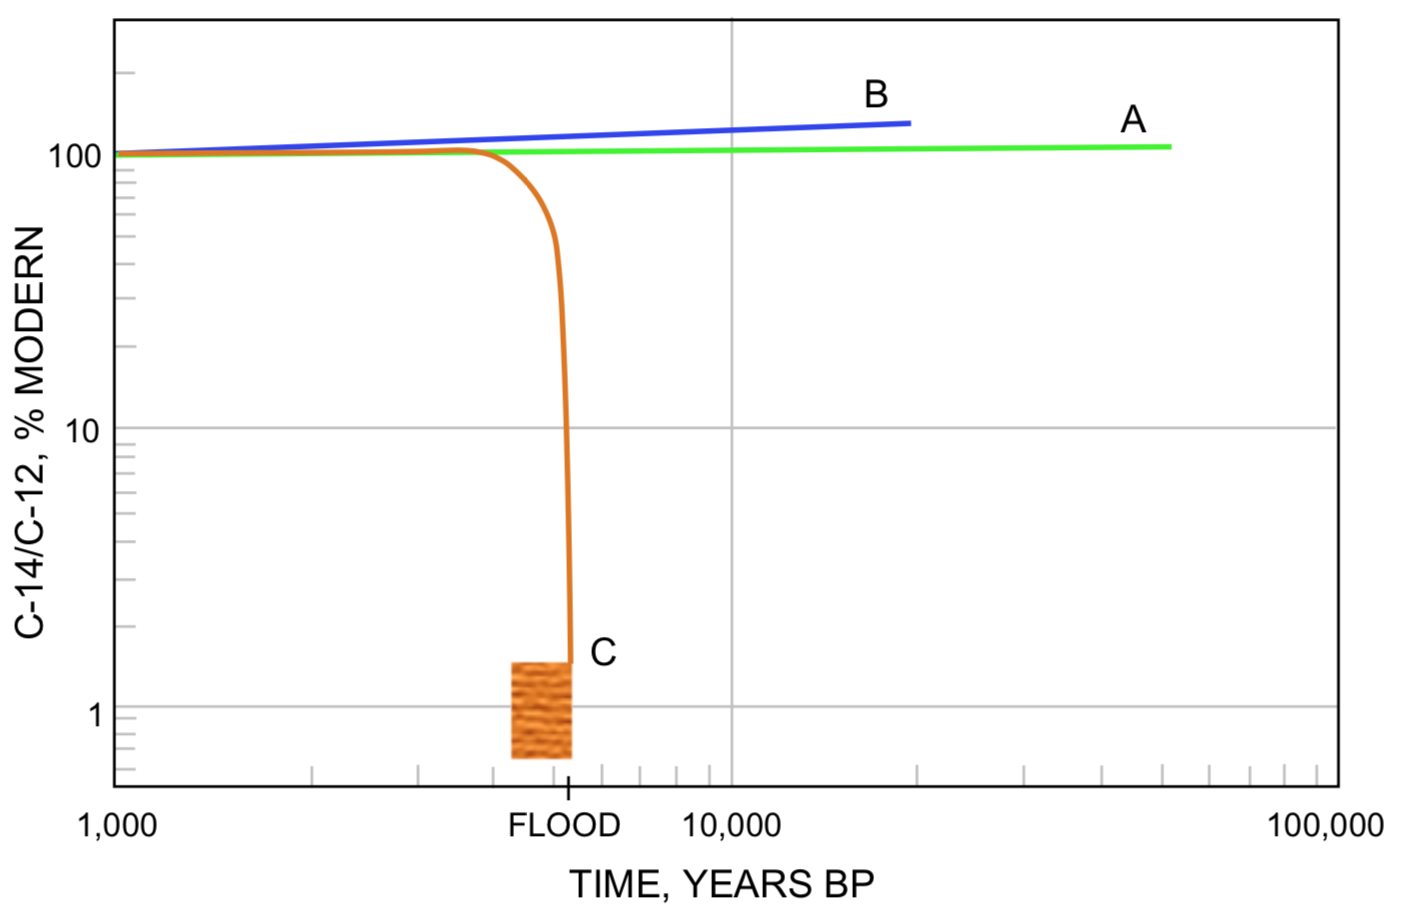
Figure 1 is a plot of the difference between dendrochronological (tree ring) calibrated age and the corresponding C-14 age over the range between 10 BP (years before present) and 3999 BP, as given in the latest Calibration Issue of Radiocarbon. The zero reference for the BP scale is 1950 AD. Accordingly 1950 BP corresponds to 0 BC/AD. The data in Figure 1 relate to the Upper Biosphere air, soil, surface water, mixed surface layer of the ocean, plant and animal life in this region, and organic residuum which shares in an active interchange of carbon within the region. The actual variations of the C-14/C-12 ratio in the Upper Biosphere have been less than might be expected from the impression given by Figure 1. The highest and lowest points between 0 and 3000 BP represent, respectively, only +2.1% (2699 BP) and -2.5% (1420 BP) difference between the age-corrected C-14/C-12 ratio in the sample and the carbon isotope ratio standard reference. (The carbon isotope standard reference is indicated by line A in Figure 4.)
The validity of the tree-ring master sequences on which the data for Figure 1 is based is controlled by the availability of material which can be C-14 dated and also has an unquestioned historical age. The time range from which such samples are available extends to the vicinity of 3500 BP (~1500 BC).[5] The essential agreement between C-14 age and real time over this time range indicates an approximately constant C-14/C-12 ratio in the reservoir from which the samples for C-14 dating have been obtained. In other words, the Upper Biosphere has been in essential equilibrium (equal C-14 input and output rates) over at least the past 3500 years.
C-14 enters the Upper Biosphere by diffusion and turbulence mixing from the stratosphere where it is produced by cosmic radiation.[5] Some C-14 is eliminated from the Upper Biosphere by radioactive conversion to Nitrogen-14, but most output is by transfer from the Mixed Surface Layer of the ocean to the Deep Ocean. Most of the C-14 inventory is known to be in the Deep Ocean. The mean life of C-14 atoms before conversion to N-14 is 8245 years,[6] but the mean life of C-14 atoms in the Upper Biosphere is only ~375 years. The 375-year estimate has been obtained from analysis of changes in C-14/C-12 ratios resulting from nuclear weapon tests.[7]
When some entity is introduced into a reservoir at a constant rate R, and has a mean life t in that reservoir, the quantity q of this entity at any time t after initial startup with q = 0 at t = 0 is given by the exponential equation
q = Q (1 - e-t/t) (1)
in which e is the base of the natural logarithms, and Q represents the equilibrium value of the entity represented by q. At equilibrium Q = Rt, and
R = Q (1/t). (2)
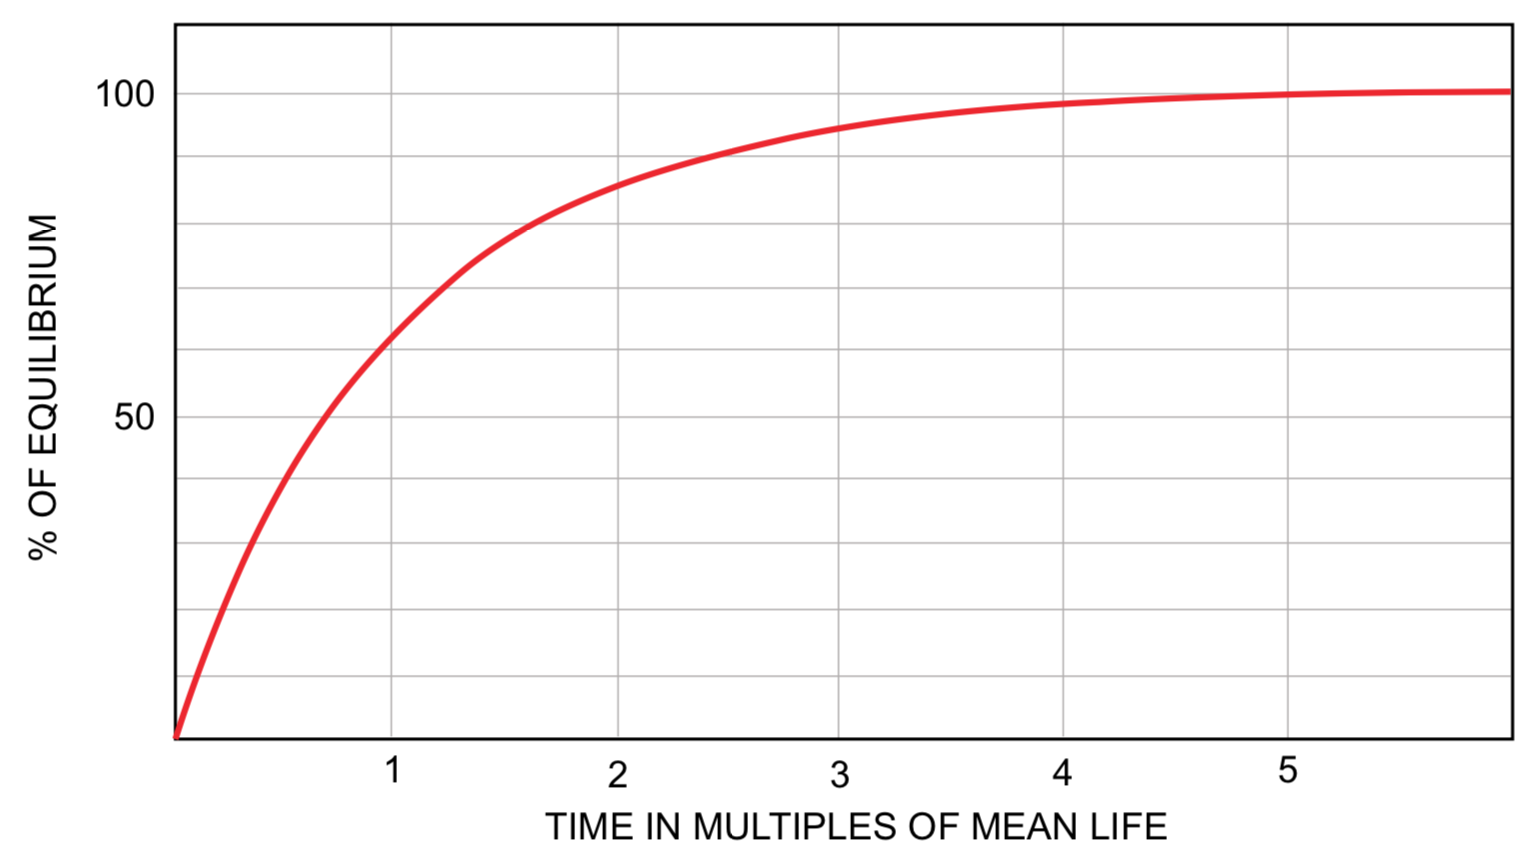
Ideally equilibrium is not attained until t becomes infinite, making the last term in Equation (1) zero. For practical consideration, q = 0.99Q when t = 4.6t. At t = 3t, q has reached 95% of its equilibrium value. These relationships are illustrated in Figure 2.
FIGURE 2. Exponential growth of a radioisotope at constant rate of formation. Ordinates are percentage of equilibrium level. Equilibrium level Q is equal to the product of the formation rate R and the mean lifetime t. Abscissae are time as the number of mean lifetimes.
From these simple considerations one can conclude that if the Upper Biosphere had a relatively insignificant C-14 concentration immediately after the flood (Genesis 6-8), with ~375 years mean residence time C-14 in the Upper Biosphere would reach 95% of equilibrium concentration by ~1125 (=3×375) years after the flood. Practically complete equilibrium would be attained in ~1725 years. Placing the flood at 5350 BP (3400 BC), according to the numerical data values in the Bible used by the New Testament church (the Septuagint),[8] essential equilibrium of C-14 in the Upper Biosphere would have been established by 1675-2275 BC. The relatively small variations in the Upper Biosphere C-14/C-12 ratio (differences in C-14 age with respect to real-time age) since 1500 BC are readily accounted for in terms of variation in the cosmic radiation shield provided by the magnetic fields of the Earth and the Sun, and in the cosmic-ray particles emitted by the Sun.[9][10]
The foregoing treatment indicates that if the generation rate of C-14 by cosmic ray interaction in the stratosphere, and the mean residence time of C-14 atoms in the Upper Biosphere have been relatively constant since the flood, C-14 ages should be in close agreement with corresponding real-time age over at least the past 3000 years, as required by Consideration #1, and depicted in Figure 4C.
C-14 INVENTORY ACCUMULATION
Consideration #2 presents greater difficulty.
Fossil organic material (petroleum, coal, wood, shells, bone) from geological horizons that reasonably must be interpreted as indicative of burial in the Genesis flood episode, and is not a component of the modern biosphere, has less than 2% of the modern concentration of C-14 in the Upper Biosphere.[11]
Estimates of the amounts of carbon in the various regions of the biosphere, combined with measurements of the C-14/C-12 ratio in these regions, have produced estimates of the modern C-14 inventory typically in the range between ~50,000 kg[12] and ~75,000 kg.[13] At the estimated C-14 production rates that have been published in the scientific literature, e.g., 8.0 kg/yr in a recent publication,[14] the "observed" C-14 inventory could not have been established by 5400 years after the flood. At 8.0 kg/yr formation rate and 8245 years mean lifetime, Equations (1) and (2) specify
for the biosphere, only 48% of a 66,000 kg equilibrium inventory (rounding 65,960 to 66,000).
In an effort to account for the biosphere C-14 inventory, I have proposed that during the early centuries following the flood C-14 was produced much more rapidly than at present (e.g., see Reference 15). This approach may be rendered unnecessary by recognizing that the formation rates usually cited in the literature are based on the assumption that the biosphere is in C-14 equilibrium, and the additional assumption that the effective C-14 formation rate may be correctly estimated as the quotient of the present inventory value and the mean life of C-14 atoms (Equation 2). The 8.0 kg/yr production rate noted in the preceding paragraph is based on the assumption that a present inventory of 66,000 kg represents equilibrium (66,000/8245 = ~8.0). A first-order approximation model that is consistent with the biblical data and the C-14 content of fossils from burial in the flood (less than 2% of the present biosphere level) should specify that the total biosphere at present has reached only about half (48% in the example immediately above) the C-14 equilibrium level. Ninety-five percent of equilibrium level would not be reached until about 26,000 (=3×8245) years after the flood. An appropriate estimate of the C-14 formation rate for such a model should not be based on an assumption that present circumstances represent equilibrium.
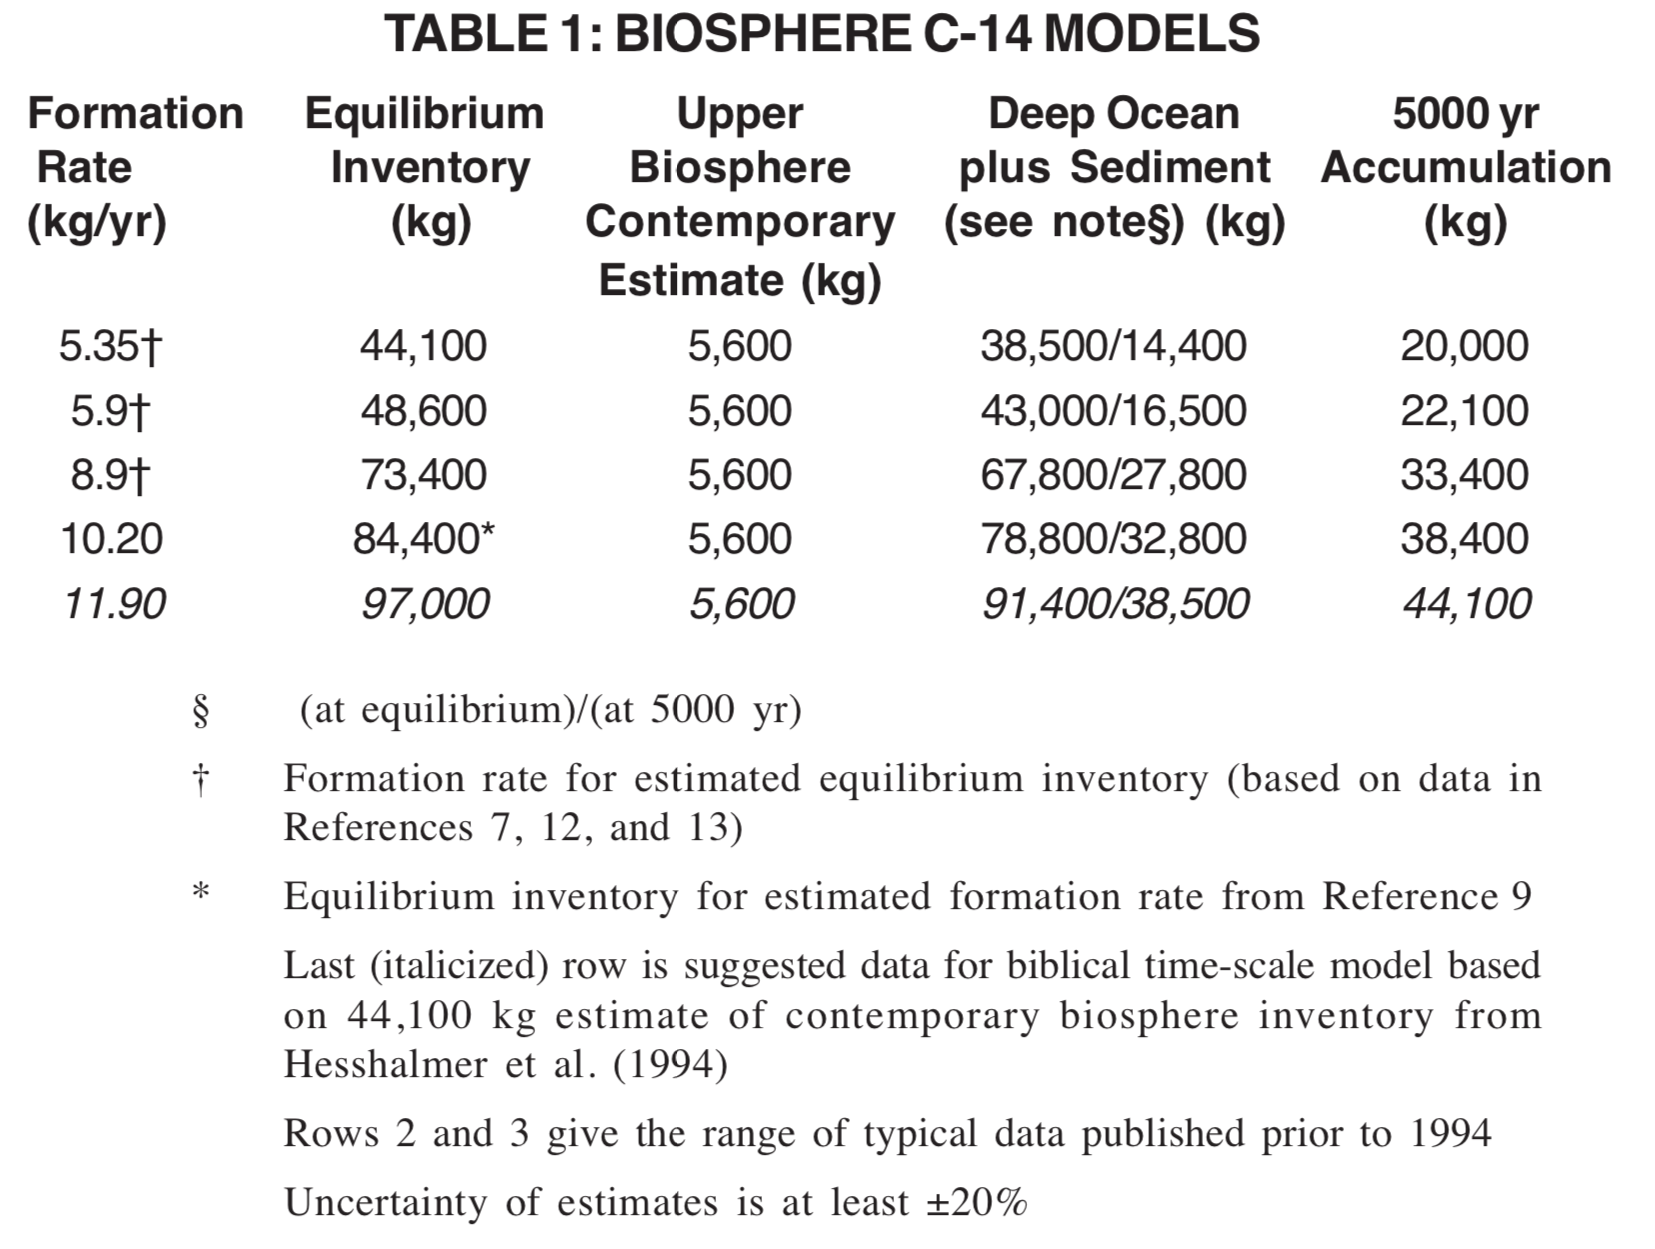
A recent geophysics and climatology group investigation of the distribution of C-14 produced by nuclear weapon tests indicates that previous estimates of the amount of C-14 in the Lower Biosphere (deep ocean and sediments) have been excessive.[7] As shown in Table 1 (row 1, columns 1 and 2) their estimate of the C-14 formation rate at 5.35 kg/yr is associated with a 44,100 kg estimate for the equilibrium inventory in the total biosphere (44,100/8245 = 5.35).
Significant data that must be taken into account in the development of a model for relating C-14 age to biblical chronology are given in Table 1.
A good estimate for the C-14 inventory in the contemporary Upper Biosphere is 5599 kg.[16] Since the other data in Table 1 are based on estimates that might be classed as educated guesses (uncertainties as great as ~±20% are specified in the original publications), 5600 kg is a suitable figure for column 3 of Table 1, and all data in this table should be considered uncertain within at least ±20%. With the uncertainty in determining the precise time since the flood from biblical specifications, 5000 years may be used as a satisfactorily approximate specification for this time, as determined from the Septuagint text. The last column specifies the C-14 accumulation in 5000 years (45.5% of equilibrium level) at the rate given in the corresponding row of the first column.
Column 4 lists Column 2 minus 5600, and column 5 minus 5600. Column 4 indicates the amount of the world inventory of C-14 that must be accounted for in the Deep Ocean and its related sediments.
The data in row 4 are based on a C-14 formation rate estimate obtained from data for cosmic ray intensity and geomagnetic field strength (Reference 10, Table V; kg/yr = 3.74 × atoms/cm2/sec), and do not involve an uncertain assumption as to whether the biosphere is or is not in equilibrium for C-14. For individuals who model the biosphere on the basis of presumed equilibrium and unrestricted time, a C-14 formation rate derived from an estimate of the equilibrium inventory is as significant as one derived from estimates of factors associated with the primary production process. For a model that specifies nonequilibrium, the only suitable C-14 formation rate estimate must be based on nuclear reaction probabilities, cosmic ray intensity, and magnetic field considerations.
The last row of Table 1 represents a biosphere C-14 exchange system model that incorporates the chronological limitations obtained from the Bible. It is based on the latest (1994) published estimate of the biosphere inventory (44,100 kg from Reference 7), considered as a 5000-year accumulation, rather than as an equilibrium state. (Compare row 1, column 2 with row 5, column 5.) This model requires an effective average C-14 formation rate that is within a ±20% uncertainty range of the best estimate based on cosmic ray intensity and geomagnetic field strength.
Taking extreme values for a ±20% uncertainty, Equations (1) and (2) with a present inventory of 1.2 × 44,100 kg (from line 5, column 5), a formation rate of 0.8 × 10.2 kg/yr (from line 4, column 1), and t = 8245 years, specify 12,734 years for buildup from a zero kg start to the postulated present inventory. With these assumptions, particularly zero initial inventory, one can place ~13,000 years as the maximum "real time" range that can be covered by C-14 age determinations.
To close the gap between the 11.9 and 10.2 kg/yr C-14 formation rates on lines 5 and 4 of Table 1, a more complex model could allow for possible higher cosmic ray intensity and/or lower geomagnetic field strength, with associated higher C-14 production rate, within the first two millennia following the flood. This model would require a lower production rate over the last 3500 years in order to produce the C-14 accumulation associated with the 12 kg/yr average specified in row 5. An initially higher production rate is reasonable in view of the cosmogenic nuclide (particularly Beryllium-10) concentrations in ice cores from Greenland, and sediment cores from the ocean, which indicate that at the height of the Ice Age C-14 production was at least 25% higher than at present[17] (greater Be-10 concentration per unit volume of ice in a thin section of ice core), and ~20% higher at the end of the Ice Age (~10,000 BP C-14 age).[18]
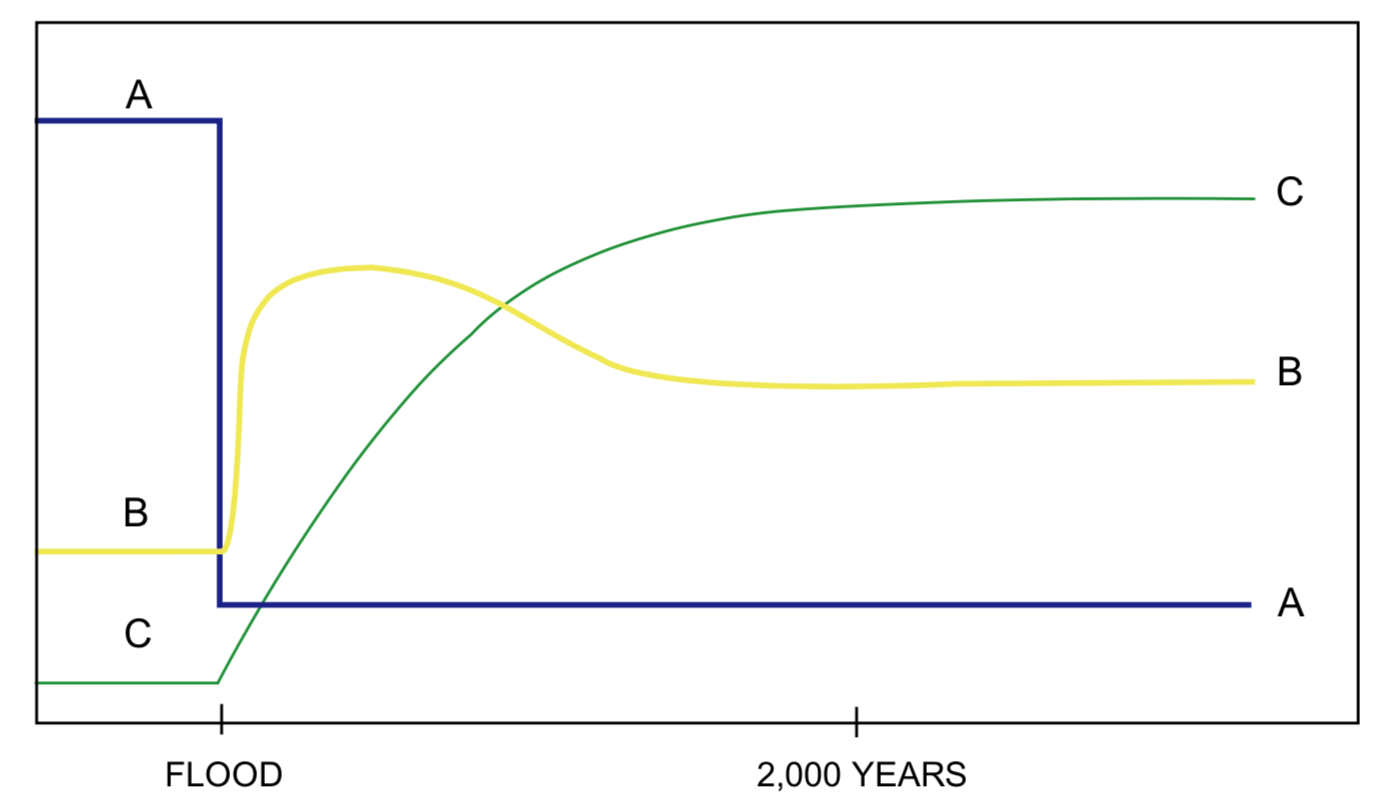
Hence at this stage in the development of a model for the C-14 exchange system a transiently higher C-14 formation rate may be postulated for the early centuries following the flood, as depicted by Line B of Figure 3. With such specification the requirement for a ~12 kg/yr average could be met with a modern formation rate closer to the 10 kg/yr estimate based on cosmic ray and geomagnetic field intensities. The initial portion of Line B represents the possibility that in order to provide greater protection of organisms from cosmic ray damage, the geomagnetic field prior to the flood was stronger than it has been over the last 3000 years. Line B of Figure 3 has been drawn only to indicate possible change, and not to designate magnitudes or rates of change.
FIGURE 3. Biosphere Transition. Ordinates indicate suggested trends only, and are arbitrary for both magnitude and scale. A: Total Active Biosphere Carbon. B: C-14 Formation Rate. C: Upper Biosphere C-14/C-12. Upper Biosphere equilibrium is presumed to have been essentially established by 2000 yrs after the flood.FIGURE 4. Upper Biosphere C-14/C-12 Ratio vs Time BP. Ordinates are first approximation of C-14/C-12 ratio as percent of the modern reference value. A: C-14 age based on equilibrium throughout all past time. B: C-14 age calibrated by tree rings and coral. C: C-14 age calibrated by biblical chronology. Above (below) 100% ratio C-14 ages are less (greater) than corresponding real-time age (see text). Concerning the range of uncertainty for BP date of the flood and C-14/C-12 ratio at the time of the flood, see References 8 and 11.
Line A total biosphere carbon in Figure 3 represents the transfer of a large portion of the carbon inventory from the active exchange system to a fossil state (coal, petroleum, fossil shell and bone, e.g.) at the time of the flood. The trends depicted in Figure 3 for transition from pre-flood to modern conditions accommodate both the first and second considerations specified previously on p. 67.
DENDROCHRONOLOGICAL CALIBRATION OF C-14 AGE
Master tree-ring sequences have been constructed for bristlecone pine in the USA, and for oak and pine in Northern Europe. When extrapolated beyond the range for which unquestioned historical records control the selection of ring overlap between wood specimens, these sequences indicate that conventional C-14 ages at ~10,000 BP are ~10% less than the corresponding real-time age as estimated by dendrochronology.[2] Recent dating of Barbados coral by both C-14 and uranium-thorium series disequilibrium techniques has extended this discrepancy to ~20% at 20,000 BP.[4] These extrapolations are represented by Line B in Figure 4. (A C-14/C-12 ratio greater than the ratio on which C-14 ages are based ratio greater than 100% represents a C-14 age less than the corresponding "real time" age.) Their near-universal acceptance in scholarly circles presents a major challenge to a chronological framework based on the Bible. As represented by Line B, C-14 ages beyond ~1500 BC are progressively less than the corresponding "real-time" age. As represented by Line C, they are progressively much greater than the corresponding "real-time" age.
The extension from coral dating can be questioned on the basis that U-Th disequilibrium dating is based on the assumption that uranium and thorium isotope ratios in seawater have always been the same as at present.[19] Volcanism and contact with fresh exposures of mineral surfaces during the crustal breakup associated with the flood, and during continental relocation that probably occurred in early post-flood time, would be expected to temporarily modify the traces of radioisotopes in seawater. If there has been a transition to modern isotope ratios, U-Th disequilibrium "ages" would have an unknown relationship with real time.
Some biblical creationists have tried to resolve the difficulty associated with a sequence of as much as 8000 tree rings by suggesting that trees produced multiple growth rings per year over several centuries following the flood. There may have been many years in which more than one growth ring was produced at some locations, but the production of as many as 4000 false "annual" rings over only 1500, or at most 2000, years is not a scientifically well-founded expectation. Extensive research beyond what has been attempted so far would be required to find any support that might exist for this suggestion.
The intellectual climate in which tree-ring master sequences have been constructed favored selection of the longest sequence that could be justified. The use of C-14 ages to roughly sequence a set of wood samples before "fine tuning" by ring matching favored development of a master ring sequence that relates C-14 age to real-time age on an approximate 1:1 basis, i.e., extension of the master dendrochronology scale to about 8000 years, rather than the limit of ~5000 years to be expected from biblical specifications. Individuals who include biblical testimony in their data base would seek wood sample growth-ring overlaps that could be justified on a sound biological basis without recourse to C-14 dating and also produced a minimal sequence. Given the subjective aspect of tree-ring sequence matching, there is a possibility that a master sequence developed from a biblical perspective would have a mathematical correlation coefficient equally good, if not better, than do the master sequences that have become the current standard for C-14 age calibration.
At least until someone with adequate qualifications attempts to develop a 5000-year-limited master tree-ring sequence, the current dendrochronologic calibration of C-14 ages will be a major test of faith for individuals who adhere to straightforward historical-grammatical exegesis of the Bible. This is not blind faith, because there are C-14 data that are incongruous on the basis of Curve B in Figure 4, but have clear significance when interpreted in accord with Curve C. Examples of such data are given in References 11 and 15.
CONCLUDING COMMENT
In full perspective there is a basis for confidence, and also room for doubt, regarding compatibility between C-14 age data and the chronological data in the Bible. For most individuals, selection between these options will be influenced by predilection, rather than a decision based merely on the weight of evidence.
ACKNOWLEDGMENT
The author wishes to express appreciation for the suggestions from unnamed pre-publication reviewers of this manuscript. The reader can thank them for many improvements in readability and technical clarity.
APPENDIX I
While Figure 1 indicates that the C-14/C-12 ratio in the Upper Biosphere has been approximately constant over the past 3000 years, it raises questions concerning the trend for negative correction to C-14 age in the 0-200 and the 600-2400 year ranges. These trends are much greater than the minor variations due to the 11-year cyclic pattern of cosmic ray output from the Sun.
The zero age reference for C-14 dating is the C-14/C-12 ratio that would be expected in the Upper Biosphere if there had been no "contamination" by carbon from the use of fossil fuels. Since fossil fuel (coal, petroleum, and natural gas) contains £~1% of the C-14/C-12 ratio that characterizes the modern situation, the use of fossil fuel adds to C-12 and reduces the C-14/C-12 ratio in the Upper Biosphere.
Plants and animals grown since the beginning of the Industrial Revolution would at their zero age have had a lower C-14/C-12 ratio than the reference C-14/C-12 ratio on which C-14 dating is based. Hence their C-14 age at present will be greater than it would have been if there had been an insignificant use of fossil fuel. This difference will be proportional to the accumulated consumption of fossil fuel,[20] as indicated by the left-most portion of Figure 1.
The negative correlation trend in the 600-2400 year range correlates with long-term changes in the geomagnetic field.
C-14 production is inversely related to geomagnetic field intensity, since the geomagnetic field deflects the primary cosmic rays, reducing the portion that interacts with the stratosphere to form C-14. Direct measurements of the geomagnetic field intensity over the time such capability has existed indicate that there has been a steadily decreasing trend over the last 150 years. The remnant magnetism in sediments and volcanic formations indicates that over an extended period prior to 2000 BP the geomagnetic field intensity was increasing. Over the range from ~500 BP to ~3500 BP the geomagnetic intensity has been greater than it was at the beginning of the Industrial Revolution.[21] A greater geomagnetic field intensity correlates with lower C-14 production, a lower C-14/C-12 ratio in the biosphere, and C-14 ages greater than would have been the case if the geomagnetic field had remained constant.
REFERENCES
[1] Whitelaw RL. 1993. Radiocarbon dating after forty years: Do creationists see it as supporting the Biblical Creation and Flood? Creation Research Society Quarterly 29(4):170-183. (See 30[3]:123,124 for comments.)
[2] Stuiver M, Pearson GW. 1993. High-precision bidecadal calibration of the radiocarbon time scale, AD 1950-500 BC and 2500-6000 BC. In: Long A, Kra RS, Devine JM, Stuiver M, editors. Radiocarbon 35(1):1-23.
[3] Pearson GW, Stuiver M. 1993. High-precision bidecadal calibration of the radiocarbon time scale, 500-2500 BC. In: Long A, Kra RS, Devine JM, Stuiver M, editors. Radiocarbon 35(1):25-33.
[4] Bard E, Arnold M, Fairbanks RG, Hamelin B. 1993. 230Th-234U and 14C ages obtained by mass spectrometry on corals. In: Long A, Kra RS, Devine JM, Stuiver M, editors. Radiocarbon 35(1):191-199.
[5] Libby WF. 1955. Radiocarbon dating. Chicago: The University of Chicago Press.
[6] Lide DR, Frederikse HPR, editors. 1994. CRC handbook of chemistry and physics. 75th ed., p 11-36. (Mean lifetime is half-life/ln2.)
[7] Hesshalmer V, Helmann M, Levin I. 1994. Radiocarbon evidence for a smaller ocean carbon dioxide sink than previously believed. Nature 370:201-203. For a different conclusion regarding the C-14 inventory in the ocean, see Duffy PB, Amthor JS, Caldeira K, Connell PS, Kinnison DE, Southon J, Wuebbles DJ. 1995. The global budget of bomb radiocarbon. EOS Transactions of the American Geophysical Union 76(46):F83, Abstract A21E-2.
[8] Brown RH. 1990. Correlation of C-14 age with the biblical time scale. Origins 17:56-65.
[9] Burchuladge AA, Pagava SV, Togonidze GI, Avtandilashvili MV. 1993. Radiocarbon and 11-year variations of cosmic rays. Radiocarbon 35(3):347-350.
[10] Lai D. 1988. Theoretically expected variations in the terrestrial cosmic-ray production rates of isotopes. In: Castagnoli GC, editor. Solar-terrestrial relationships and the Earth environment in the last millennia. Amsterdam: North-Holland Physics Publishing (Elsevier Science Publishers B.V.), p 216-233.
[11]Brown RH. 1992. Correlation of C-14 age with real time. Creation Research Society Quarterly 29(1):45-47.
[12]Stuiver M, Quay PD. 1980. Changes in atmospheric 14C attributed to a variable sun. Science 207:11-19.
[13]Damon PE, Sternberg RA. 1989. Global production and decay of radiocarbon. Radiocarbon 31(3):697-703.
[14]Sternberg RA, Damon PE. 1992. Implications of dipole moment secular variation from 50,000-10,000 years for the radiocarbon record. Radiocarbon 34(2):189-198.
[15] Brown RH. 1986. Radiometric dating from the perspective of biblical chronology. In: Walsh RE, Brooks CL, Crowell RS, editors. Proceedings of the First International Conference on Creationism, Vol. 2. Pittsburgh: Creation Science Fellowship, p 31-57.
[16] Damon PE. 1988. Production and decay of radiocarbon and its modulation by geomagnetic field-solar activity changes with possible implications for global environment. In: Stephenson FR, Wolfendale AW, editors. Secular solar and geomagnetic variations in the last 10,000 years. Dordrecht, The Netherlands: Kluwer Publishing Co., p 267-283.
[17] Lao Y, Anderson RF, Broecker WS, Trumbore SE, Hoffman HJ, Wölfi W. 1992. Increased production of 10Be during the Last Glacial Maximum. Nature 357:576-578.
[18] Beer J, Siegenthaler U, Bonani G, Finkel RC, Oeschger H, Suter M, Wölfi W. 1988. Information on the past solar activity and geomagnetism from 10Be in the Camp Century ice core. Nature 331:675-679.
[19] Faure G. 1986. Principles of isotope geology. 2d ed. NY: John Wiley & Sons, Chapter 21.
[20] Damon PE, Lerman JC, Long A. 1978. Temporal fluctuations of atmospheric 14C: causal factors and implications. Annual Reviews of Earth and Planetary Science 6:457-494.
[21] Sternberg RS, Damon PE. 1979. Sensitivity of radiocarbon fluctuations and inventory to geomagnetic and reservoir parameters. In: Berger R, Suess HE, editors. Radiocarbon dating. California: University of California Press, p 691-717 (particularly Figure 3, p 696).
COVER PICTURE
California woods. Our main article deals with Carbon-14 dating. Ancient wood is commonly used for this dating technique, and, as discussed in this article, tree rings are an important factor in calibrating Carbon-14 dates. Photo taken by Lenore Roth.