DNA normally exists in double-stranded form, each strand composed of molecular subunits called bases. The strength of attraction between the two strands depends on proper matching of their bases. The better the matching, the stronger the attraction, and the higher the temperature required to melt them (separate the strands). DNA distance is a measure of the extent of base matching of DNA strands from different species, and can be estimated from the effect of base mismatching on the melting temperature. One unit of DNA distance is equivalent to a melting point depression of 1oC.
DNA distances have been used to estimate the degree of genetic similarity between species. “Family trees” have been constructed from DNA distances for most families of songbirds. Species classified as closely related usually cluster together in a distinct group with DNA distances of less than about 5 to 7. Species groups often are separated from other such groups by distances of 10 or more units. At distances more than about 8 to 10, branches tend to be so close together that the relationships among groups may be difficult to interpret. In addition, the branching pattern at greater DNA distances often conflicts with branching patterns derived from other methods of classification, leaving one to wonder which system is best.
The clustering of species into distinct groups suggests they may be related by common ancestry. DNA distances seem to be useful in grouping species into higher taxonomic categories. The method sometimes suggests hypotheses of relationship between groups of species, or for unique species, that may not have been seriously considered previously. This is interesting, but, as with other methods of systematics, difficulties remain. One important question is the limit of resolution of the method. It seems likely that the reliability of the method decreases as DNA distance increases, and the method is probably best used for grouping species rather than determining relationships among such groups. Nevertheless, DNA distance, along with other methods of comparing species, will continue to be of interest to all who are interested in the relationships among living organisms.
Evolutionary classification methods attempt to group species according to how closely they are related. But how are relationships measured? A review of the literature pertinent to DNA distances indicates that independent approaches may give conflicting results.
INTRODUCTION
Two goals of evolutionary studies are to determine the relationships among organisms and the mechanisms by which change occurs (Sibley and Ahlquist 1986). For various reasons, both goals have been elusive. Relationships among species are often difficult to establish, especially because different methods of comparison may give different results. Such conflicting results are attributed to convergence, parallelism, reversals, and unequal rates of change. These problems are usually explained as the result of natural selection. By this reasoning, the best method for determining phylogeny would be to use some feature not controlled by selection.
If, as has been suggested (Kimura 1968), most point mutations are neutral to selection, such mutations could provide a record of ancestry. It should be possible to identify mutations and determine relationships by comparing DNA sequences. Several methods of estimating DNA differences have been devised. Comparison of amino-acid sequences gives an estimate of the corresponding differences in DNA sequence for relatively small amounts of DNA. Actual sequencing of entire genomes is not yet practical. Restriction framing mapping may be the most efficient molecular method of phylogenetic estimation at the present time. Discussion of these methods is beyond the scope of this article. DNA/DNA hybridization is a very crude method of estimating sequence differences, but is the subject of this paper because of the large amount of published data for birds, and especially the single order of perching birds. In this paper, the term DNA distance is used only to refer to results of the DNA/DNA hybridization technique.
Neutral mutation theory. Based on calculations of the rate of mutations thought to be needed to explain amino-acid differences in proteins from different species, Kimura (1968) proposed that most point mutations must be nearly neutral to selection in order to explain their apparently rapid rate of fixation (see also Kimura 1979). The suggestion that mutations might be neutral led to the development of a theoretical explanation for their neutrality.
Mutations may be neutral either because they occur in DNA that is non-functional or because the mutation does not alter the function of the sequence. In many organisms from 20% to 50% of the genome may consist of highly repetitive DNA (Britten and Davidson 1971), most of which has no known function. In addition, it appears that most of the single-copy DNA is present as intervening sequences (introns) that are not translated (e.g., see Wozney et al. 1981). Most mutations in multiple-copy DNA or in introns should theoretically have no effect on the organism (but see below).
Mutations may also be neutral because they do not change the function of a translated DNA sequence. Within coding sequences, many mutations in the third base of a codon do not alter the meaning of the codon (Jukes 1980). Such "silent substitutions" could account for as much as 17% difference between two functionally identical DNA sequences (McCarthy and Farquhar 1972). Also, mutations that result in substitution of an amino acid for a very similar amino acid might have no noticeable effect on the phenotype, and be essentially neutral.
The proposal that most mutations are neutral seems to have been generally accepted, although not universally (e.g., Bernardi and Bernardi 1986, Gillespie 1986). However, recent evidence shows that an active gene may be contained within an intron of another gene (Henikoff et al. 1986), and that two genes may overlap each other on opposite DNA strands (Adelman et al. 1987). Nesting and overlapping of genes are believed to be uncommon in vertebrates, but mutations in such DNA would probably not be neutral. It should be noted that the theory stressing the importance of neutral mutations in evolution was originally proposed (Kimura 1968) to explain the larger-than-expected differences in amino acid sequences among several species of mammals assumed to have a common ancestry datable from the fossil record. If one accepts the possibility of separately created lineages the problem of explaining large differences between species disappears, and the issue of neutral mutations becomes less important.
DNA clock and systematics. There are large numbers of genes in the genome of a multicellular organism, and it has been argued that, even if mutation rates vary for different genes, the average rate of nucleotide substitution for all genes would be uniform over long periods of time (Sibley and Ahlquist 1983a, 1986). If true, the difference in DNA sequences between two species would be a function of the time since their divergence. This concept forms the basis of the purported "DNA clock".
Sibley and Ahlquist (1983a) assert that DNA/DNA hybridization results give an accurate estimate of the overall sequence difference between any two species, and (1983a, 1986) that the resulting measurements of DNA distance provide a tool for accurately determining relationships and estimating times of origin of the species. Sibley, Ahlquist and Sheldon (1987) have suggested that DNA comparisons are more reliable than morphological comparisons in determining phylogeny because DNA sequences are not subject to convergence.
Recently it has been shown that differences in DNA sequences are not necessarily related to the supposed age of lineages (Sheldon 1987b, Catzeflis et al. 1987), thus invalidating the use of DNA/DNA hybridization distance data as a clock. However, the data show some interesting patterns and further investigation seems worthwhile.
DESCRIPTION OF TECHNIQUES
DNA preparation. The following description of the technique is based on Sibley and Ahlquist (1983a, 1986). DNA is collected from red blood cells or other appropriate tissue. After purification, the DNA is sheared by sonication into fragments that average about 500 base pairs in length. These fragments are boiled to separate the strands, then the mixture is partially cooled. Since the number of copies of repetitive sequences in the mixture is much greater than those of single-copy DNA, they will reassociate faster. When the mixture is passed over a hydroxyapatite column, double-stranded reassociated fragments bind to the column, while the single-stranded fragments of single-copy DNA are collected in the effluent. This single-copy DNA is believed to contain 95-98% of the different sequences present (Sibley and Ahlquist 1983a, p. 248). The single-copy DNA to be used as the "tracer" is labeled with radioactive Iodine-125. Single-copy DNA from a second species is used as the "driver", and is not labeled. When the DNAs are mixed in the proportion of 1000 parts "driver" to one part "tracer", each "tracer" fragment will reassociate with a "driver" fragment, forming a hybrid DNA fragment.
Measuring the DNA distance. The two strands of a DNA duplex are held together by hydrogen bonding, which depends on correct matching of base pairs. The greater the extent of matching, the higher the temperature required to separate ("melt") them. The DNA distance is a measure of the reduction in melting temperature of hybrid DNA fragments, caused by differences in their base sequences, and is presumably a measure of the difference between the DNAs of the two species.
To determine the melting temperature of the hybrid fragments, they are first bound to a hydroxyapatite column. The temperature is then raised in increments, typically of 2.5ºC, and the column is washed, removing any DNA which may have separated into single strands. The amount of DNA removed is measured by the level of radioactivity in the sample (due to the Iodine-125 labeling). The percentage of DNA removed at each temperature increment is plotted against temperature, producing a melting-point curve. In the most common procedure, the temperature is recorded when 50% of the tracer DNA is recovered in single-stranded form. This temperature is subtracted from the temperature at which 50% of the pure "tracer" DNA melts. The result is called the "DT50H" (delta T50H), and is used as a measure of DNA distance. In an alternative method, the measurements used are for only the tracer DNA fragments that form duplexes with driver DNA. This result is called the DTm (Sibley and Ahlquist 1983a, p. 257). The latter method should be used only when the proportion of tracer DNA forming hybrid duplexes is greater than 80% (Sheldon 1987a).
Normalized percentage of hybridization. It seems that each species has some unique sequences, so that there is never a 100% match of the DNA fragments of two species. The normalized percentage of hybridization (NPH) is the amount of a species' DNA that hybridizes with that of another species, standardized against the amount that hybridizes with DNA of its own species. High variances have been reported for the NPH values for comparisons of closely related species (Bledsoe 1987), which would make this measurement difficult to use in systematics. Under the experimental conditions used, the NPH is often less than 75%. Because the non-hybridizing DNA will not attach to the hydroxyapatite column, it is eliminated from the determination of the melting curve. If the NPH is small, only a small fraction of the DNA remains for study, making the results questionable.
Delta T50H and DNA distance. Experiments to determine the relationship between difference in DNA sequence and melting point change of DNA duplexes have shown that a change of 1ºC in the melting point represents from 0.7% to 3.2% difference in DNA sequence, the best average estimates ranging from 1% (Bonner et al. 1973) to 1.6% (McCarthy and Farquhar 1972). Usually a DT50H value of 1ºC is taken to indicate a difference of 1% in DNA sequences. Since the DT50H value and the percentage sequence difference are numerically the same, I will use the term "DNA distance" for DT50H values.
DISCUSSION OF RESULTS
Among the numerous papers published on the topic, two groups have been selected for discussion. The study of the large flightless birds (ratites) was used to calibrate the "DNA clock", and the studies of songbirds illustrate the complexity of the results.
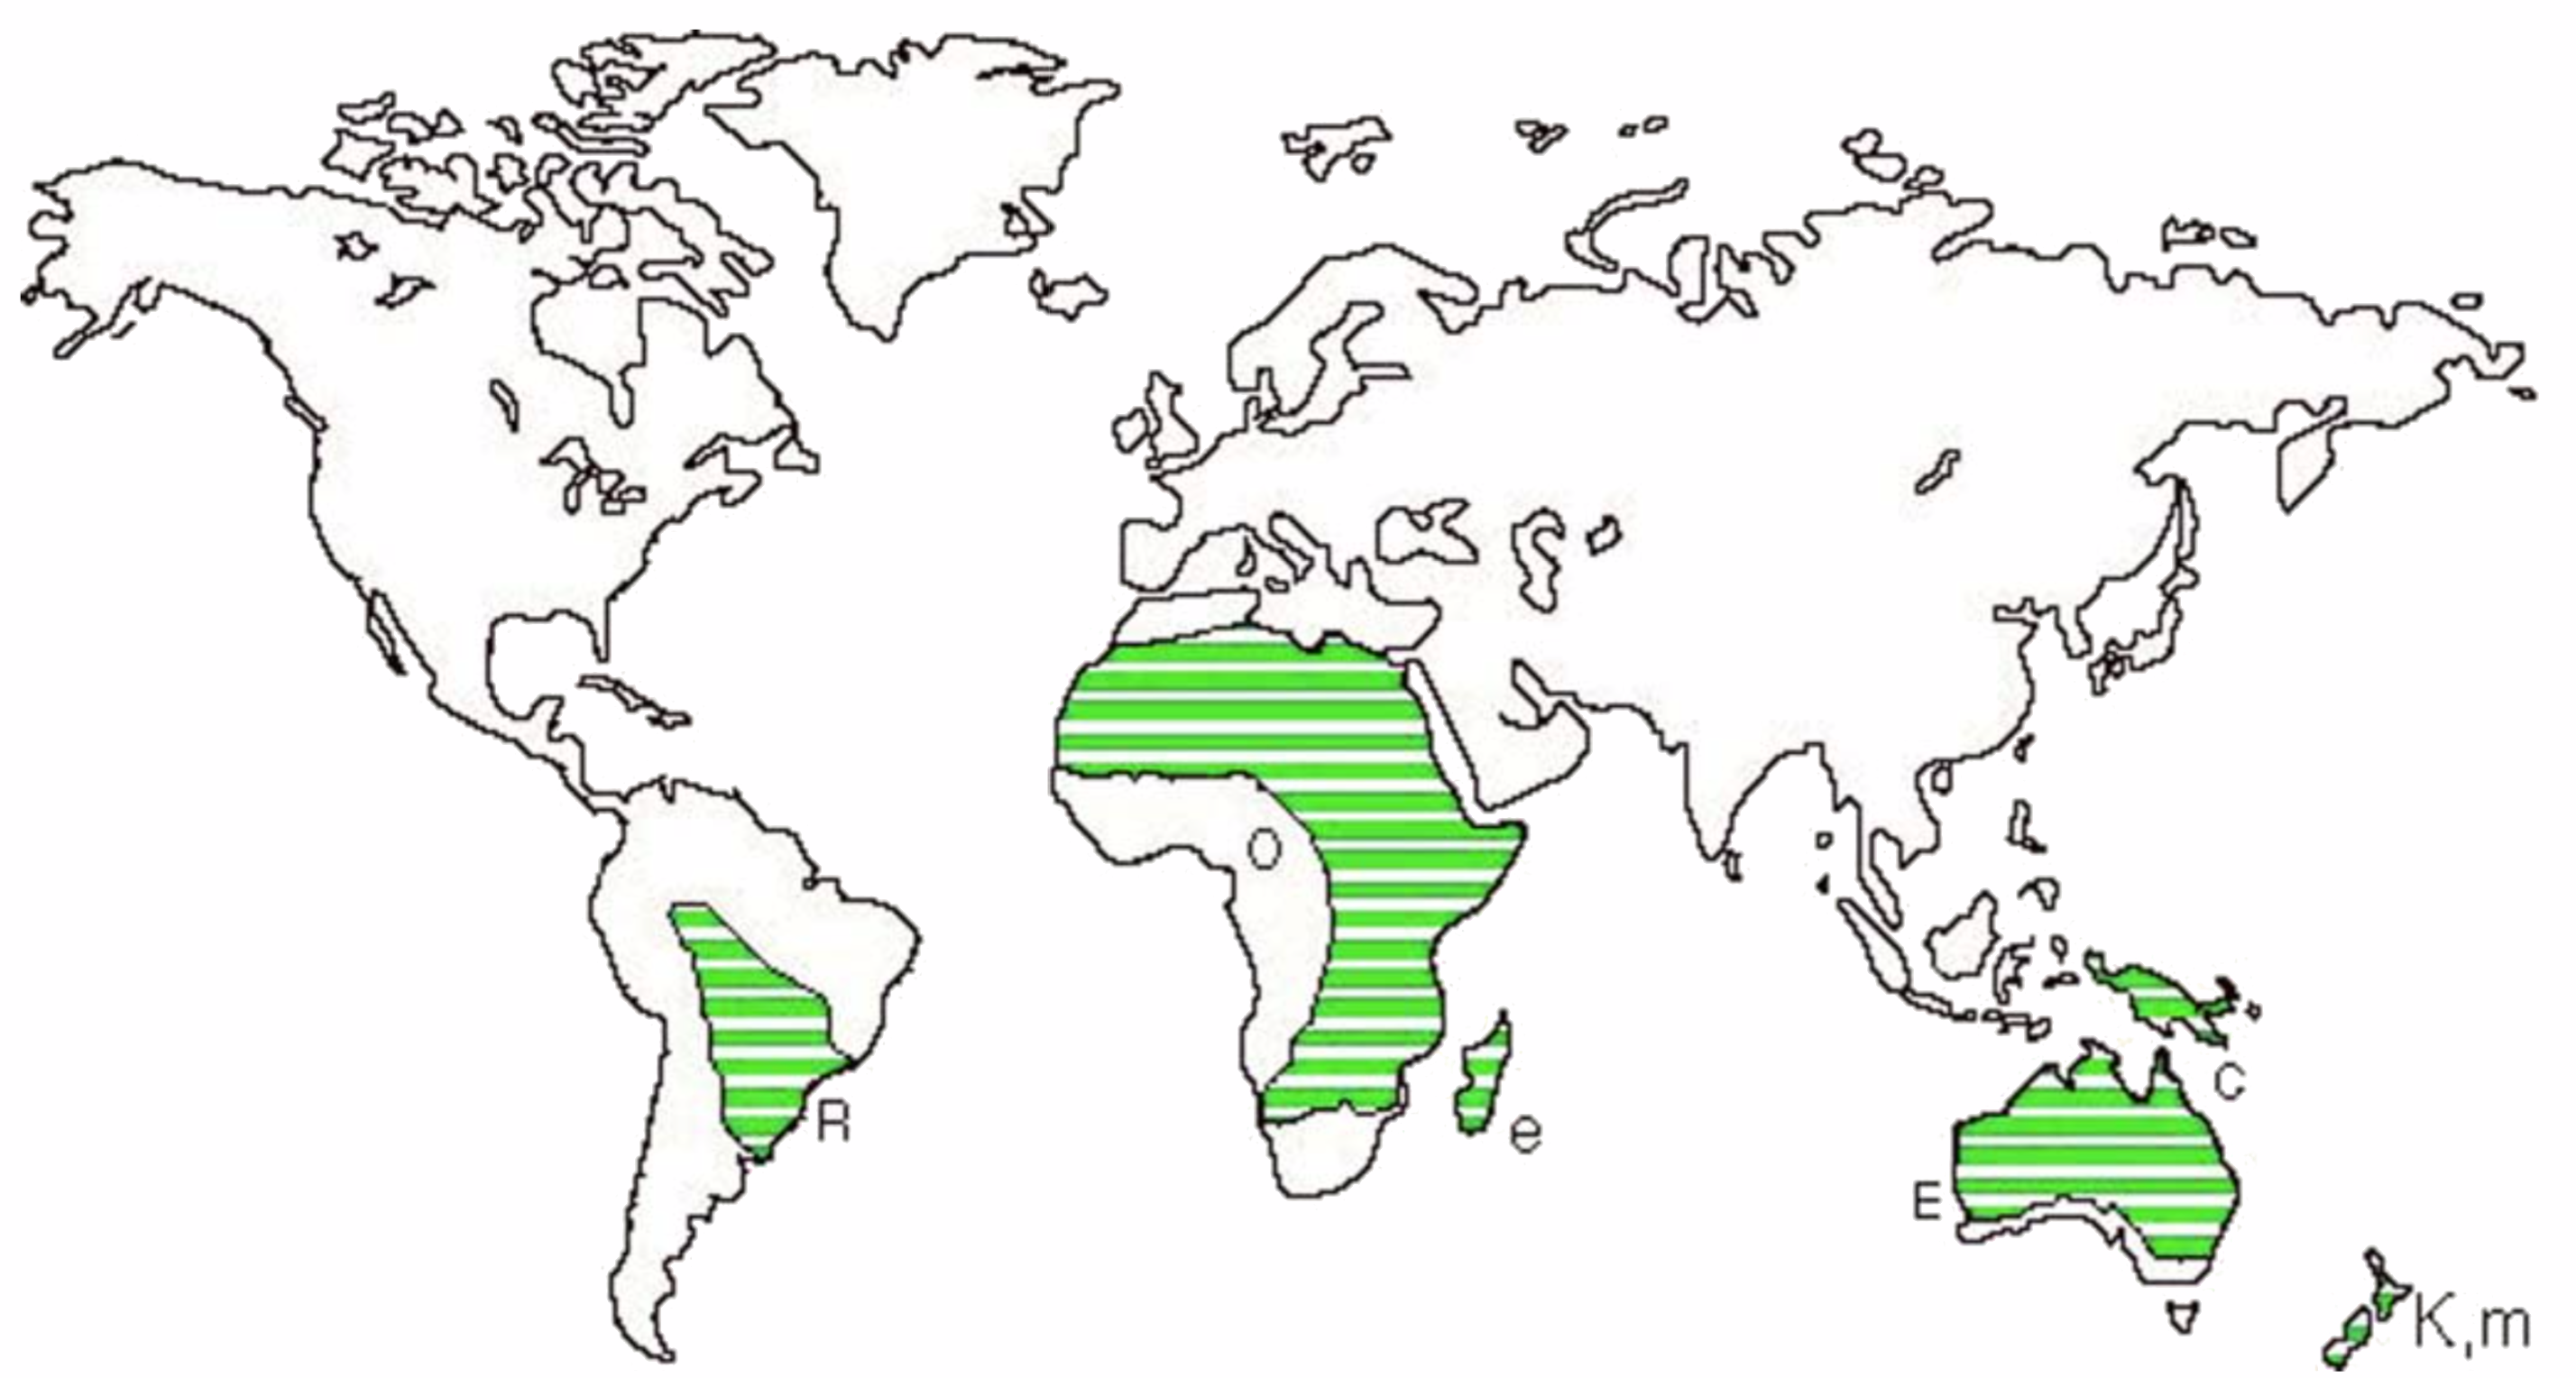
Phylogeny of the ratites. The ratites are a group of large flightless birds, including the ostrich, rheas, emu and cassowaries The kiwi and extinct moas are also usually included, and the extinct elephant birds and some other extinct groups are sometimes included as well (Cracraft 1974). The South American tinamous are considered to be the closest relatives of the ratites. Because all the living and recently extinct ratites are found on continental fragments of Gondwanaland (see Figure 1) and share certain skeletal features, it has been postulated that they form a natural group with a common ancestor which dispersed before the breakup of Gondwanaland.
FIGURE 1. Map showing distribution of living and recently extinct ratite birds. Key: C = Cassowary; E = Emu; e = Elephant Bird; K = Kiwi; m = Moa; O = Ostrich; R = Rhea.
The separation of Africa and South America due to the breakup of Gondwanaland is believed to have occurred by the Late Cretaceous, about 80 million years ago (Ma), according to conventional geological dating. This date has been used as an estimate of the time of divergence of the ostrich and rhea. These two species show a DT50H of about 17.4 (Sibley and Ahlquist 1985d; first calculated as 15.7, Sibley and Ahlquist 1981), indicating about a 17.4% divergence of their respective DNAs (Bonner et al. 1973). This figure was used to calibrate the "DNA clock" at about 1% divergence per 4.6 Ma.
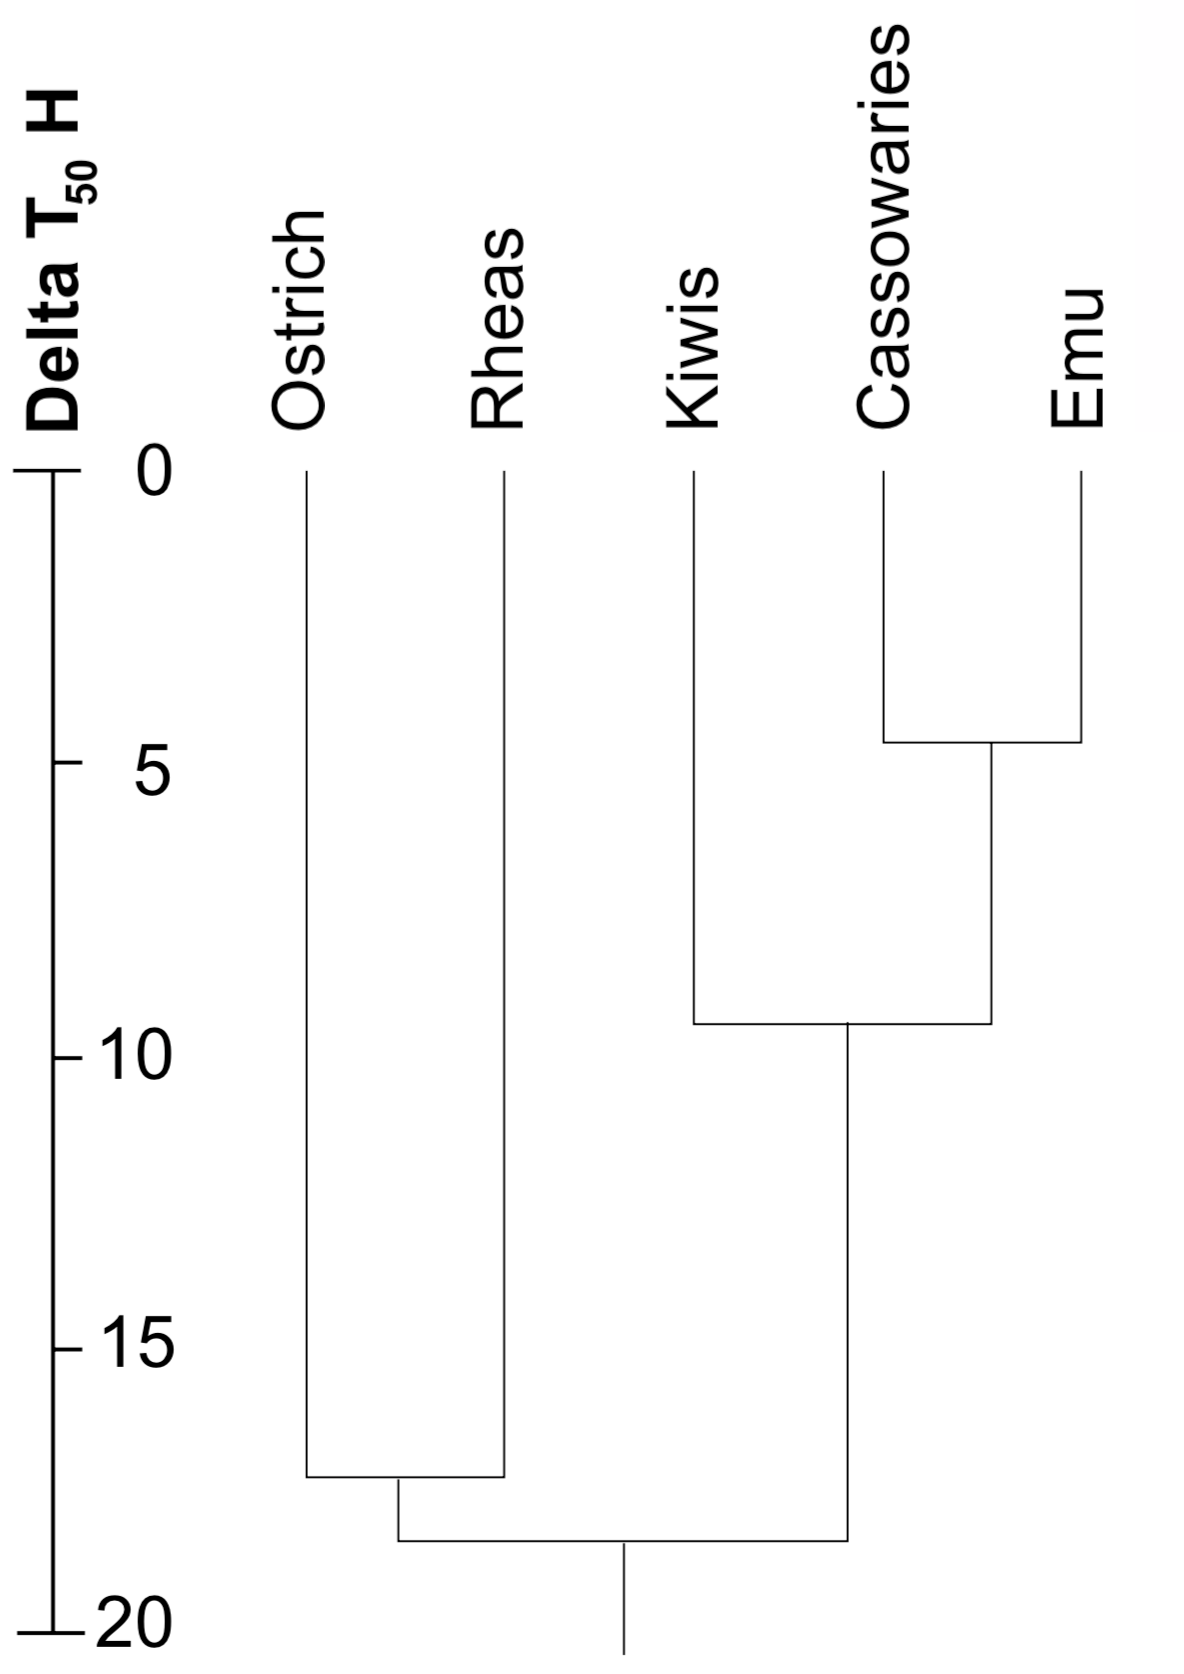
The DT50H values and calculated times of divergence of the living ratites are shown in Figure 2. Since the "DNA clock" is no longer considered reliable (Catzeflis et al. 1987), the divergence times should no longer be defended. It appears that most of the ratites have extensive differences in their DNAs, and may not be related. Fossil evidence (Houde and Olson 1981, Olson 1985) has proposed that the ratites are not all related.
FIGURE 2. DNA-distance tree for the living ratites. To determine the DNA distance between any two species, locate the point where the lines from the two species connect, and read the DNA distance from the scale on the left.
Phylogeny of the songbirds. The order of perching birds (Passeriformes) contains more than half the known species of birds (Bock and Farrand 1980). The New World flycatchers, ovenbirds and antbirds, and the Old World pittas and broadbills are grouped together in one or more suborders known collectively as the suboscines. The rest of the passeriforms are grouped in the suborder Passeres, or songbirds. Three main divisions of songbirds are generally recognized (Storer 1971): the corvine assemblage (crows, bowerbirds, birds of paradise, etc.), the predominantly Old World ten-primaried group (thrushes, babblers, Old World warblers and flycatchers, wrens, thrashers, etc.), and the predominantly New World "nine-primaried" assemblage (finches, woodwarblers, tanagers, blackbirds, etc.).
Sibley and Ahlquist (1985a,b,c,d and references therein) have applied the DNA/DNA hybridization technique to species representing most of the passeriform families. Based on their results, they have proposed a classification involving numerous taxonomic changes, many of which are significant departures from more traditional classifications. They recognize (Sibley and Ahlquist 1985c) two main lineages of songbirds: a crow-like assemblage, which includes a majority of the endemic Australian species, and a second assemblage which includes the thrushes, sparrows, warblers and most other species from non-Australian groups.
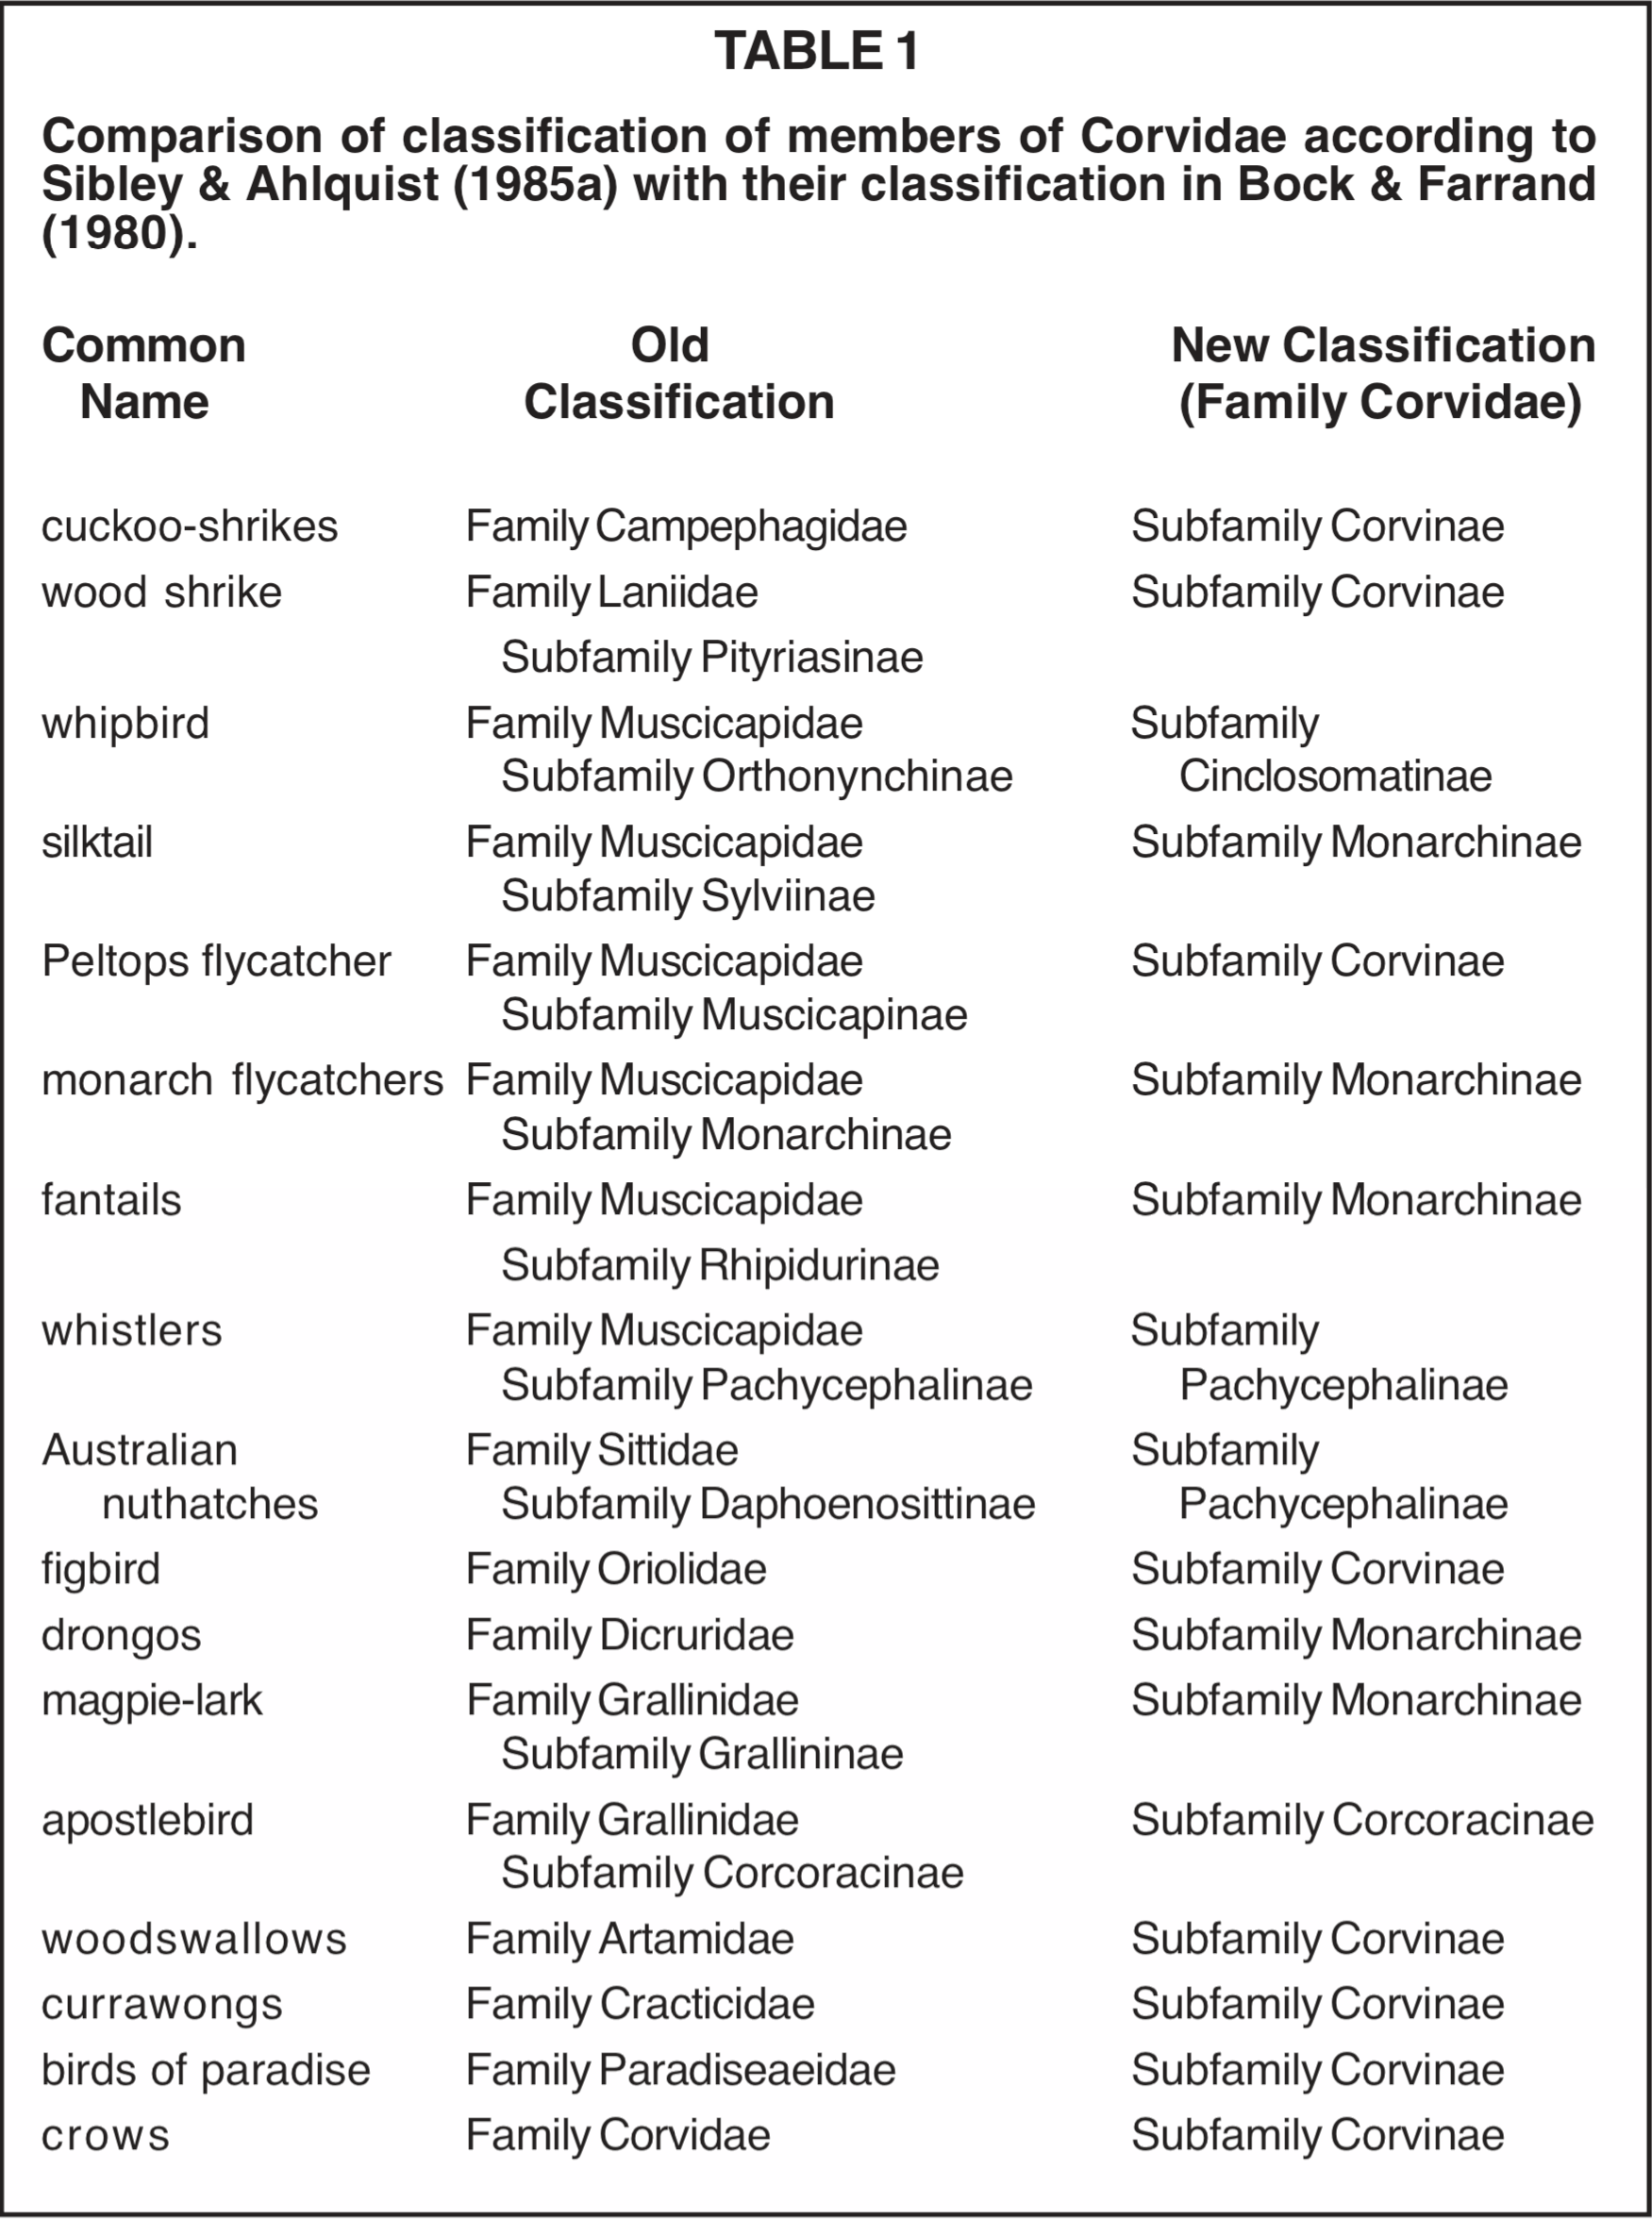
The taxonomic changes proposed by Sibley and Ahlquist involve considerable re-grouping of genera, splitting certain families and joining the fragments to various other families and erection of new families from pieces of old families. The extent of the proposed changes can be illustrated by comparing the composition of their family Corvidae with the more traditional classification (see Table 1). Quite naturally, there has been a certain amount of resistance to some of these suggestions. It should, however, be pointed out that several of the genera of birds involved in the controversy have been rather puzzling taxonomically. The DNA-based classification at least provides a new approach to the problem of classifying them. Several of the challenges to the method are discussed later in this paper.
TABLE 1. Comparison of classification of members of Corvidae according to Sibley and Ahlquist (1985a) with their classification in Bock and Farrand (1980).
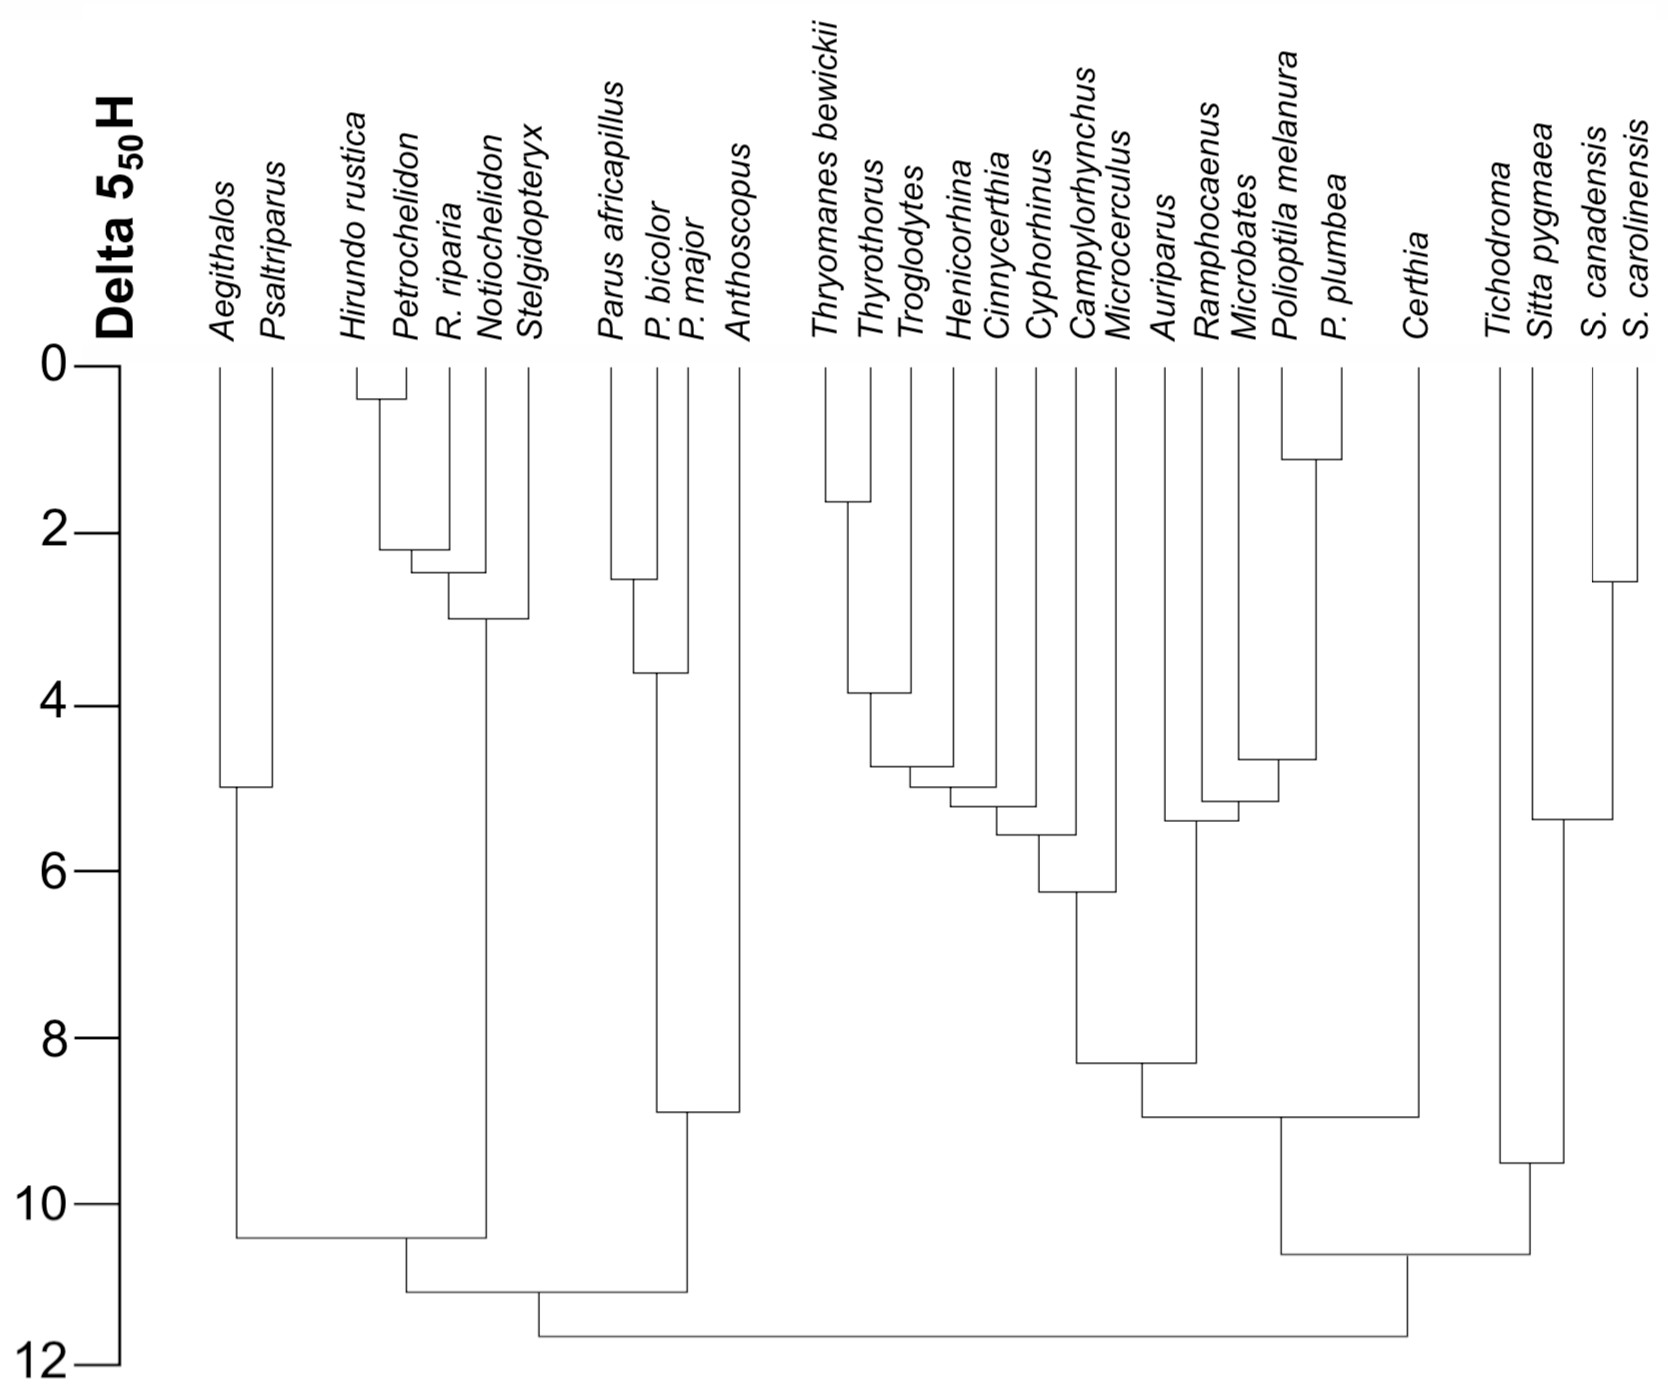
A diagram of a portion of the classification proposed by Sibley and Ahlquist (1985c) is shown in Figure 3. Note that the DNA distance between branching points is often very small. In such cases the order of branching is highly uncertain, even if the branches are statistically distinguishable. Note also that groups of species tend to form distinct clusters at lesser DNA distances, the clusters joining together in a series of closely spaced nodes at DNA distances of about 8 or greater. Some possible interpretations of these tendencies will be discussed later.
FIGURE 3. Partial phylogeny of songbirds. Based on DNA-DNA hybridization. To determine the DNA distance between two species, find the horizontal line joining the lines from the two species and read the DNA distance from the scale on the left of the diagram. After Sibley and Ahlquist 1985c, Fig. 16.
In considering the usefulness of DNA distances in classification, two aspects of systematics can be considered separately. One goal of systematics is to identify the group to which a particular species belongs. Another goal is to estimate the degree of relatedness of various species groups. Examples have been chosen from the literature to illustrate the use of DNA distances in attempting to satisfy each of these goals. The success of the technique will be evaluated by its ability to produce distinct clusters of species. Different clusters should be separated by gaps that are greater than the range of values for species within a cluster.
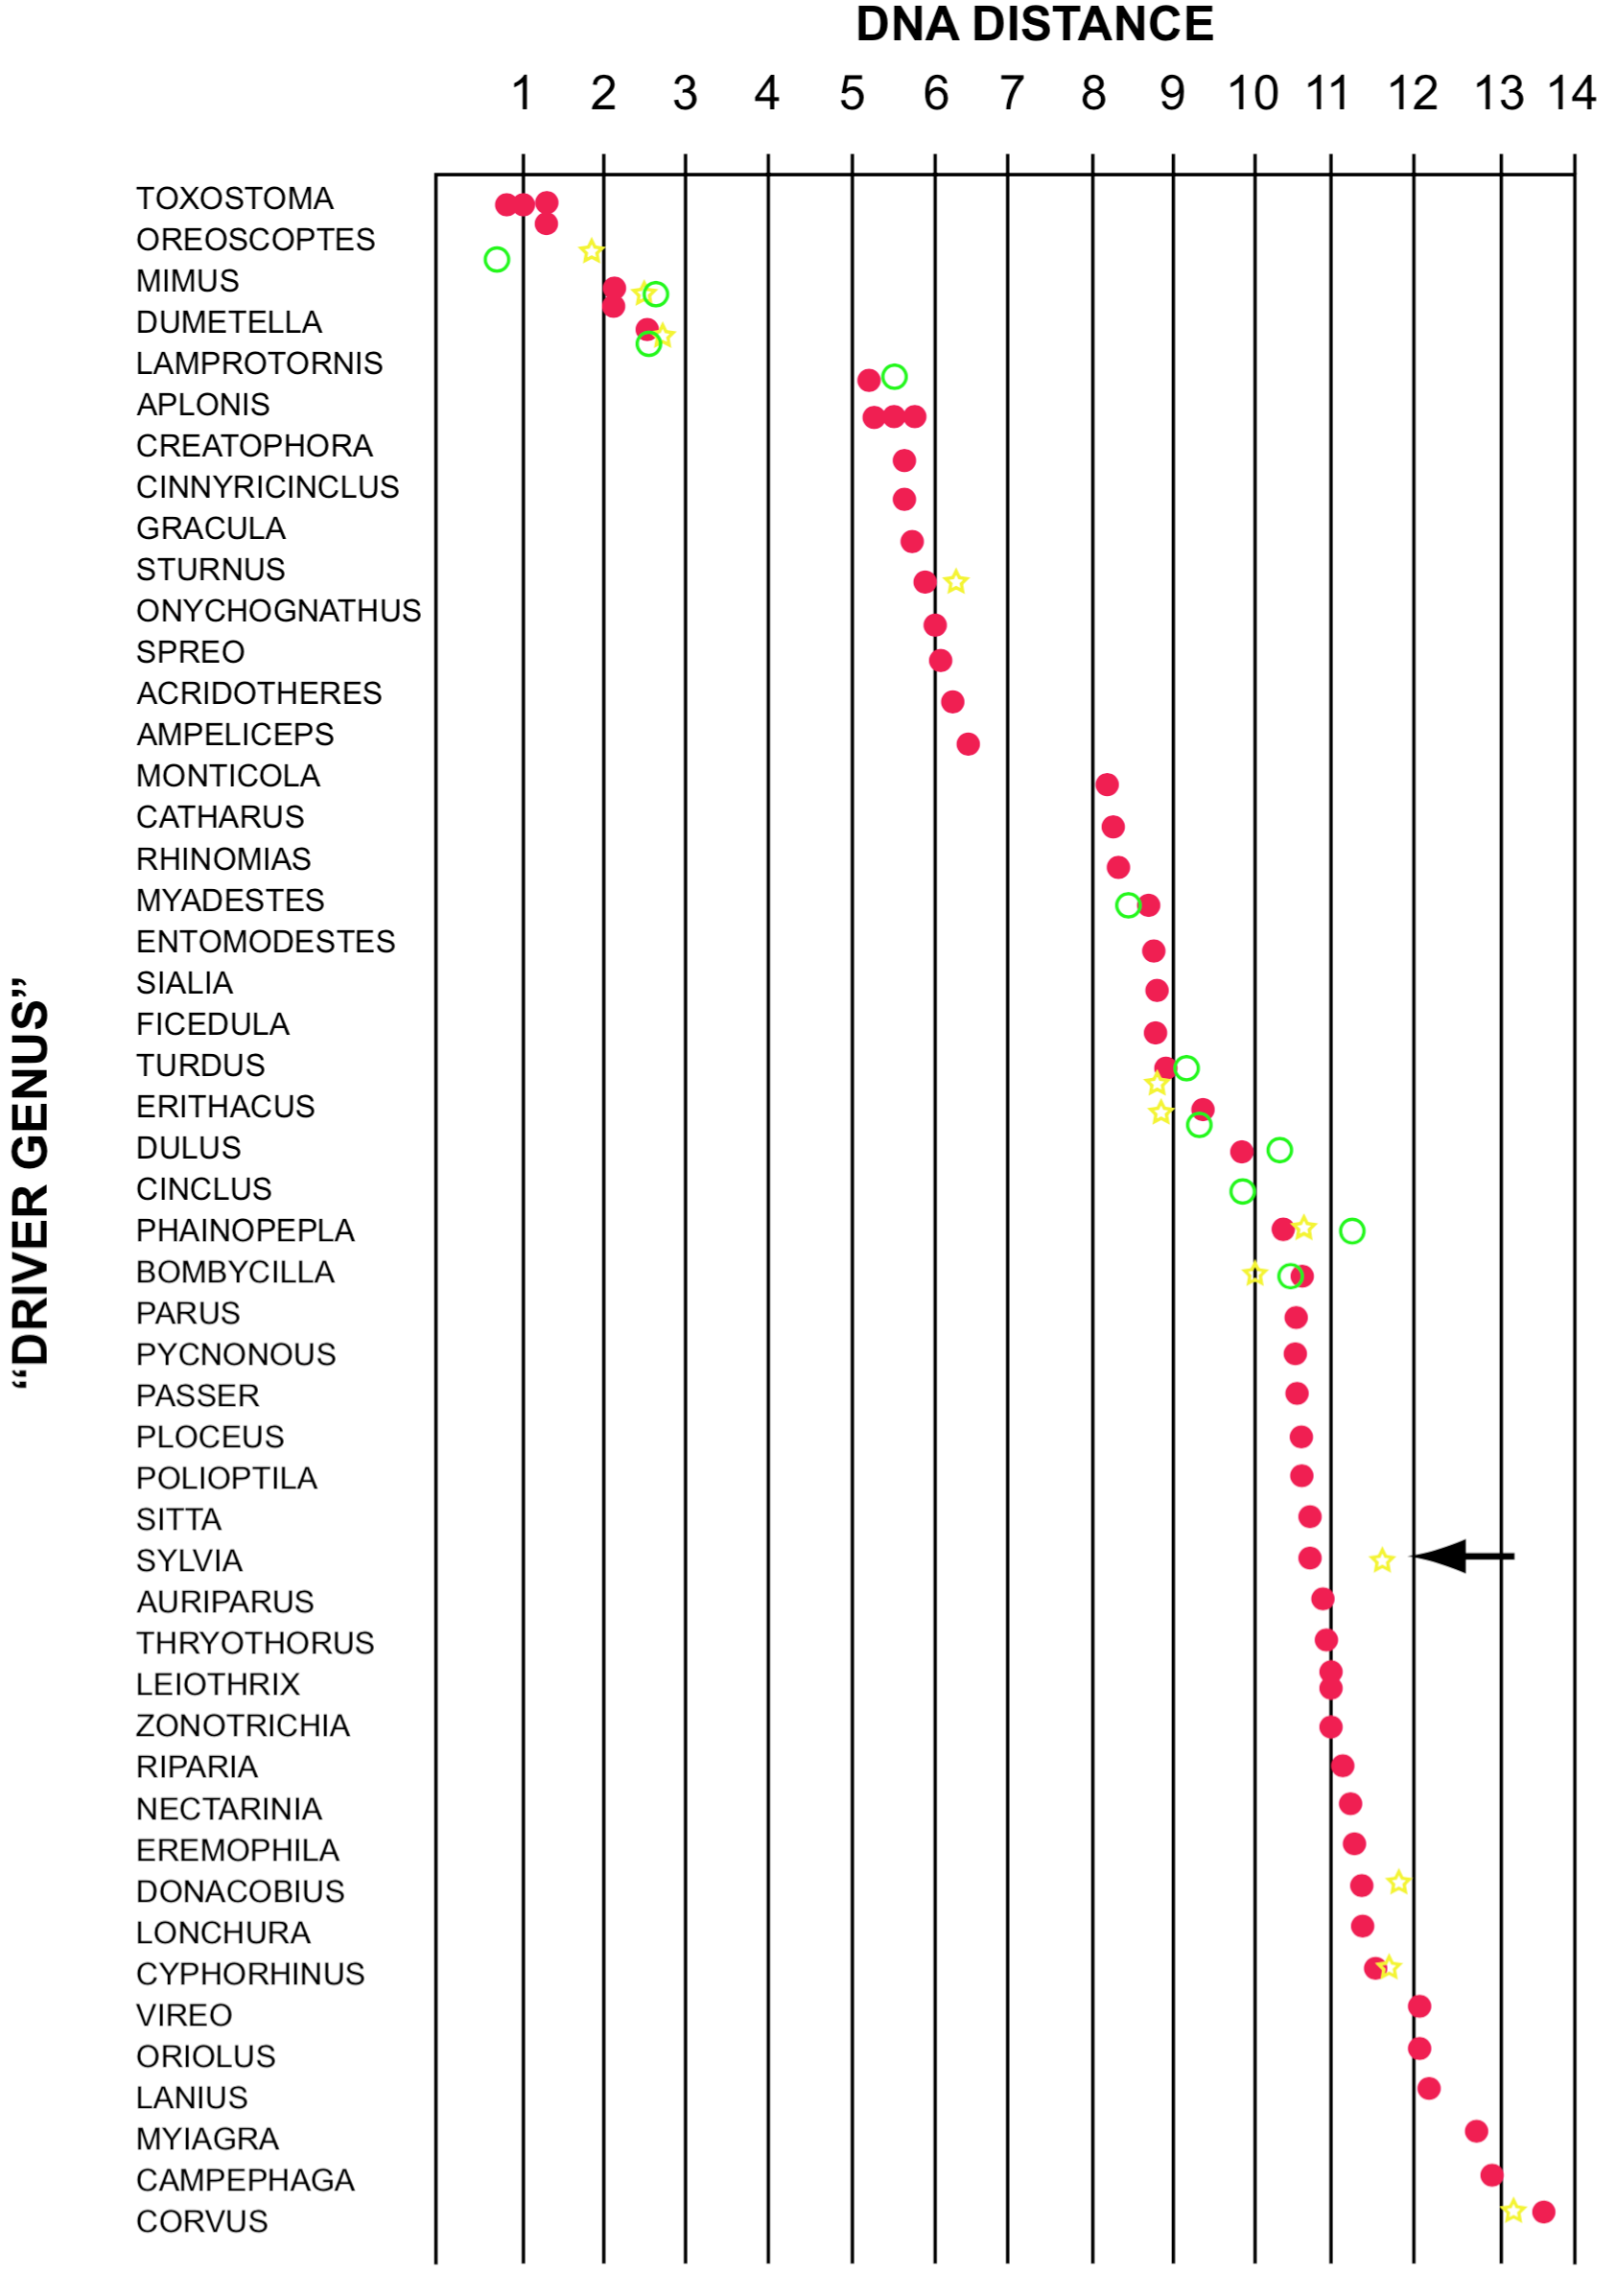
DNA distances for comparisons of three species of thrashers (Family Mimidae) to several species of songbirds are shown in Figure 4. Note the small distances among the thrashers, and their isolation from species in other families. One species, Donacobius atricapillus (see arrow in Figure 4), is classified with the thrashers in Peter's checklist (Mayr and Greenway 1960), but is far from the thrashers using DNA distances (Sibley and Ahlquist 1984b). The latter authors suggest it may be a wren, but have not measured the DNA distance involved. If Donacobius is truly a wren the usefulness of the DNA/DNA hybridization technique in classification would be supported.
FIGURE 4. DNA distances to several species of songbirds, for three species of thrashers, Toxostoma longirostre (·), Mimus polyglottus (*), and Dumetella carolinensis (o). The first four genera listed are thrashers (family Mimidae); the next ten are starlings (Family Sturnidae). Note that the DNA distance from any of the thrashers to any of the starlings falls in the range of 6.2 to 6.5. Note also the lack of values (gaps) between DNA distances of 2.8 to 5.2 and from 6.5 to 8.2. Data from Sibley and Ahlquist 1984b and Sibley, Ahlquist and Sheldon 1987.
Referring again to Figure 4, note that the starlings are grouped together, and are separated from the thrashers at DNA distances ranging from 5.0 to 6.4. Note also that the range of values within the starlings (1.4) is less than the gap (2.3) separating the family from the next closest group (Turdinae + Muscicapinae). This result suggests the surprising possibility that starlings may be the closest relatives of mockingbirds. If so, the DNA/DNA hybridization technique has been useful in the second goal of systematics mentioned above, determining which other groups are most similar to a given group of species. However, gaps between groups become less than ranges within groups for DNA distances above 8, and DNA distances between different groups run together at values over 10. This pattern of distinct clusters at values less than about 8, and joining of many clusters at values over about 8 or 10 is also seen in comparisons for several other genera (Sibley and Ahlquist 1982a,b; 1985d), and suggests that DNA distances are most meaningful for values less than perhaps about 8.
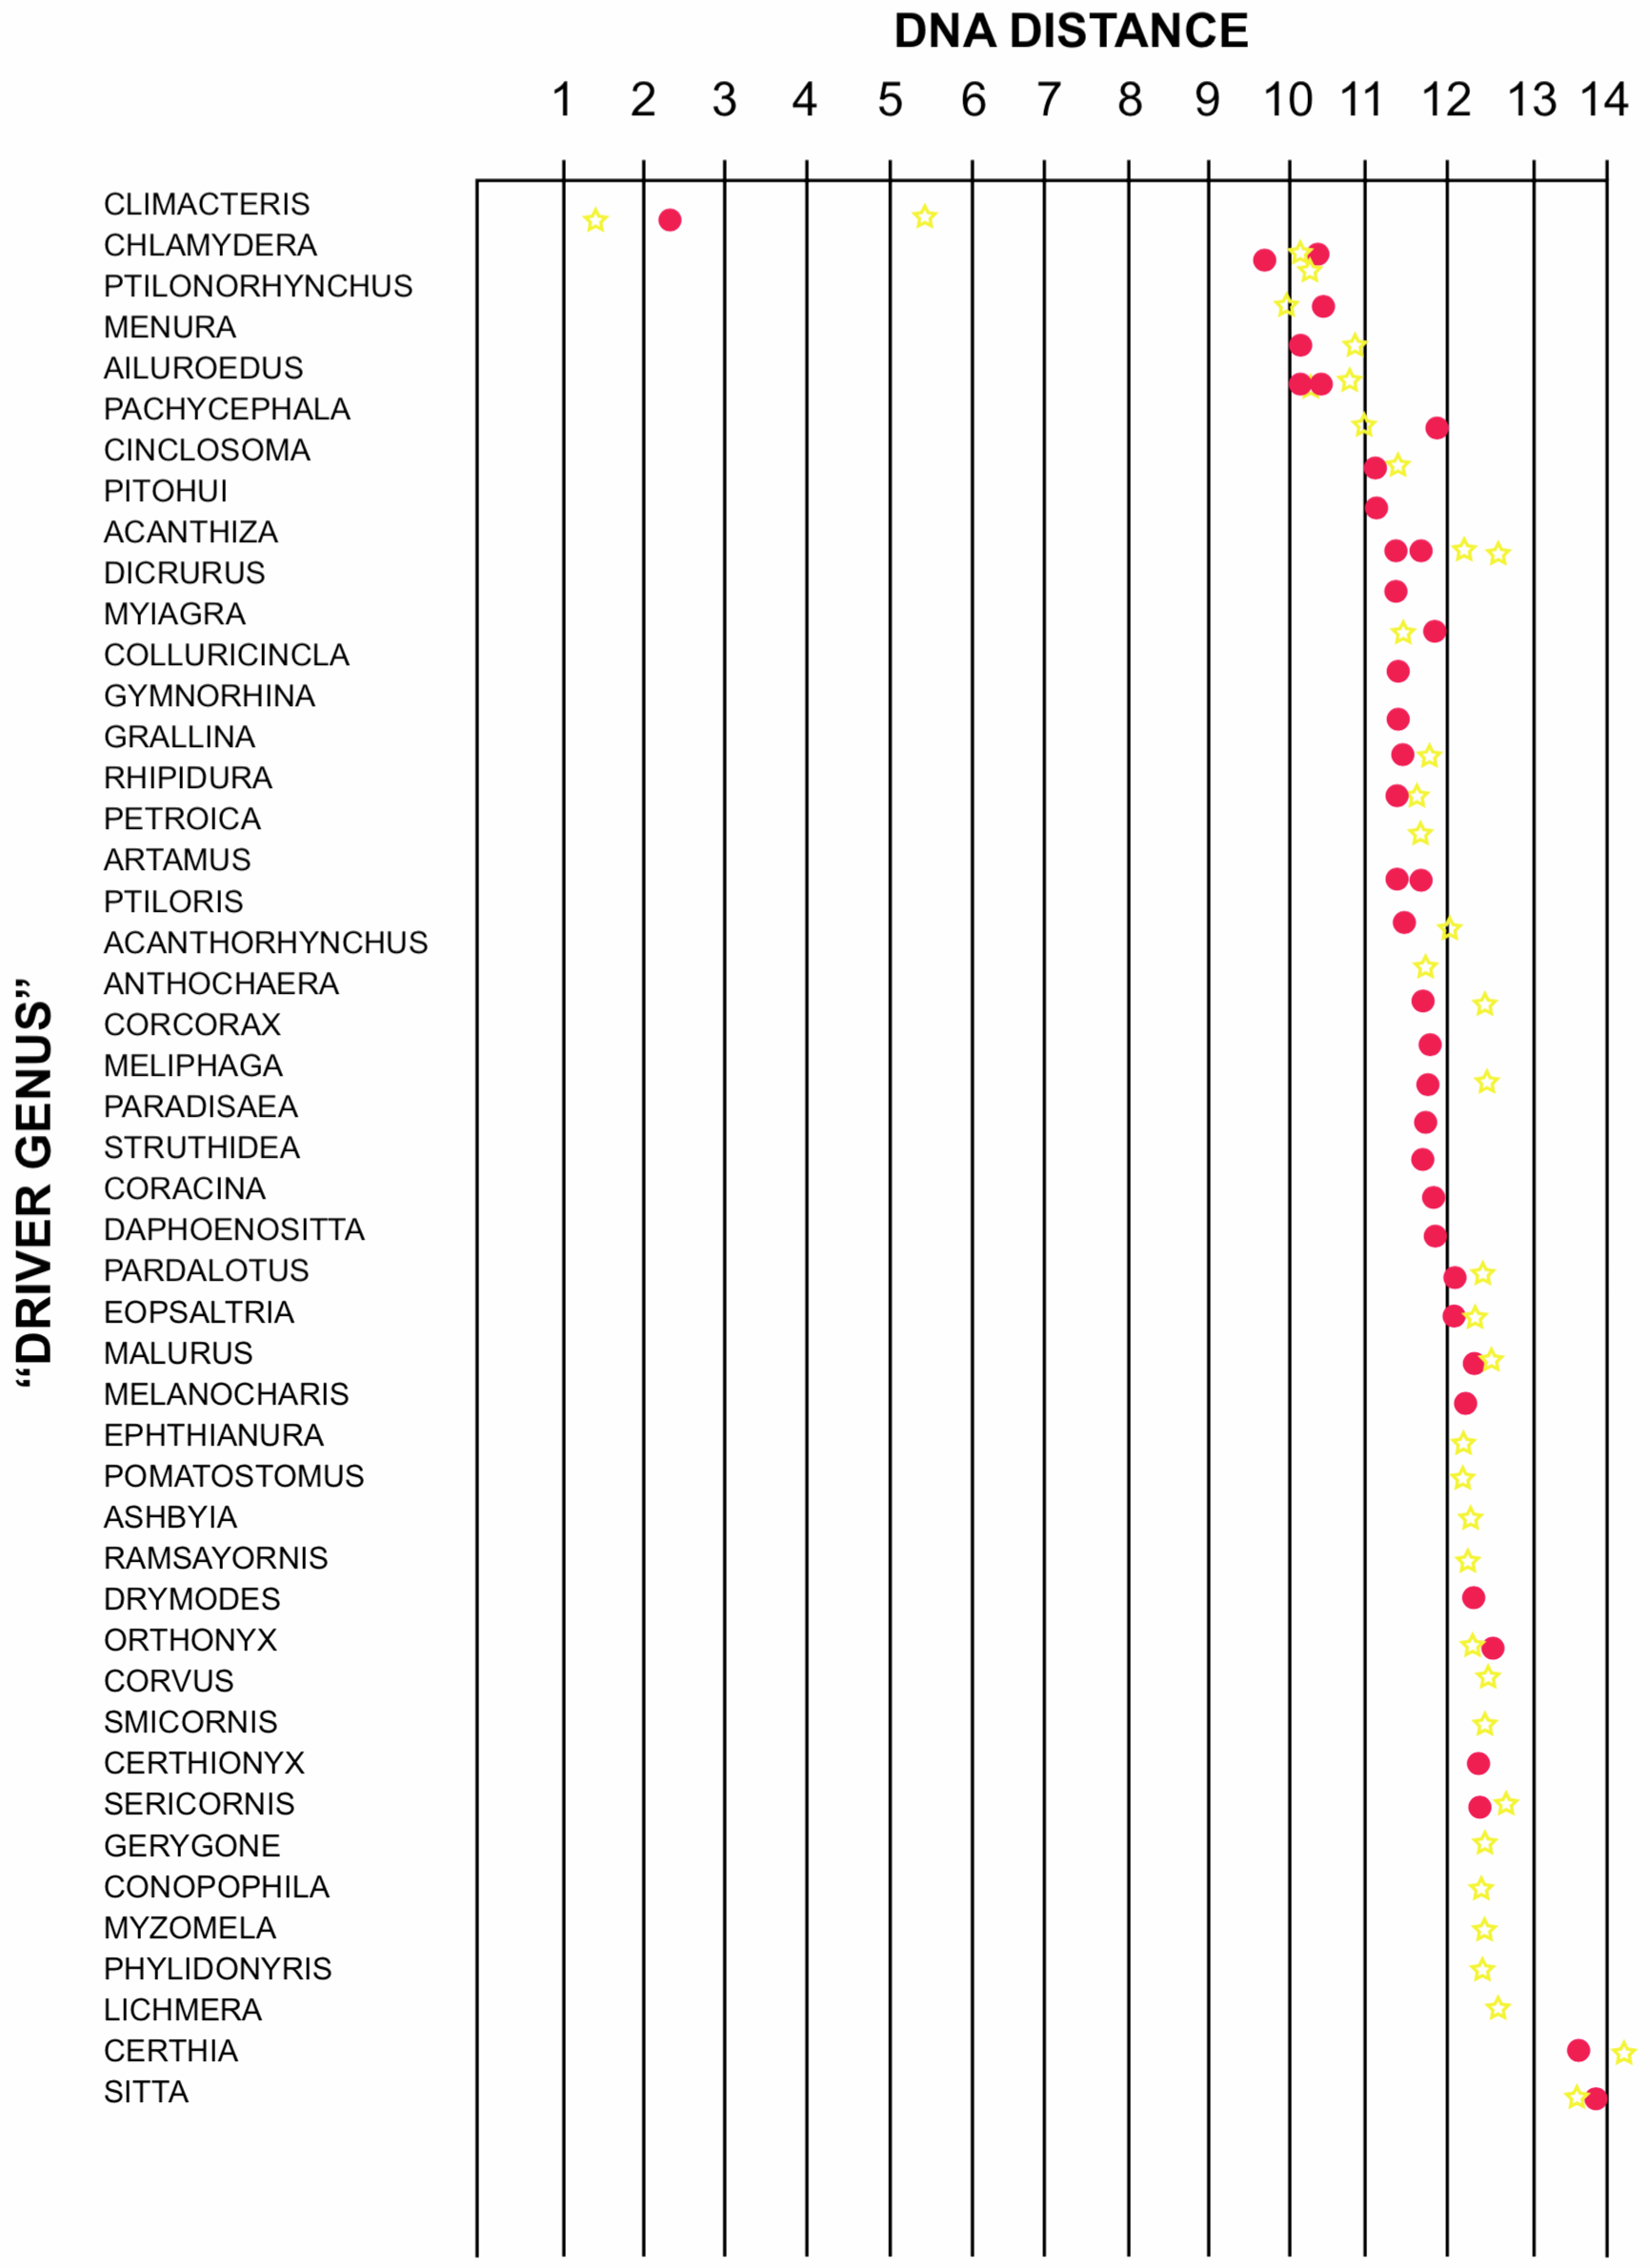
A somewhat different situation is illustrated by the DNA distances for Australian treecreepers, shown in Figure 5. Two species of treecreepers are separated by a DNA distance of 5.4, an unusually high figure for species in the same genus, leading to the suggestion they be placed in separate genera (Sibley, Shodde and Ahlquist 1984). No other family seems close to the treecreepers based on DNA distances. The closest species are bowerbirds, but the DNA distances (>10) are not sufficiently distributed to clearly indicate relationships. Thus it appears that either the treecreepers have no close relatives, or their relatives were not included in the tests, or the tests were unsuccessful in identifying them.
FIGURE 5. Some DNA distances for two species of Australian treecreepers, Climacteris rufa (*) and C. picumnus (·), Family Climacteridae. Note the unusually large DNA distance of 5.4 between the two species of Climacteris, and the large gap separating the genus Climacteris from all other genera. Data from Sibley, Schodde and Ahlquist 1984.
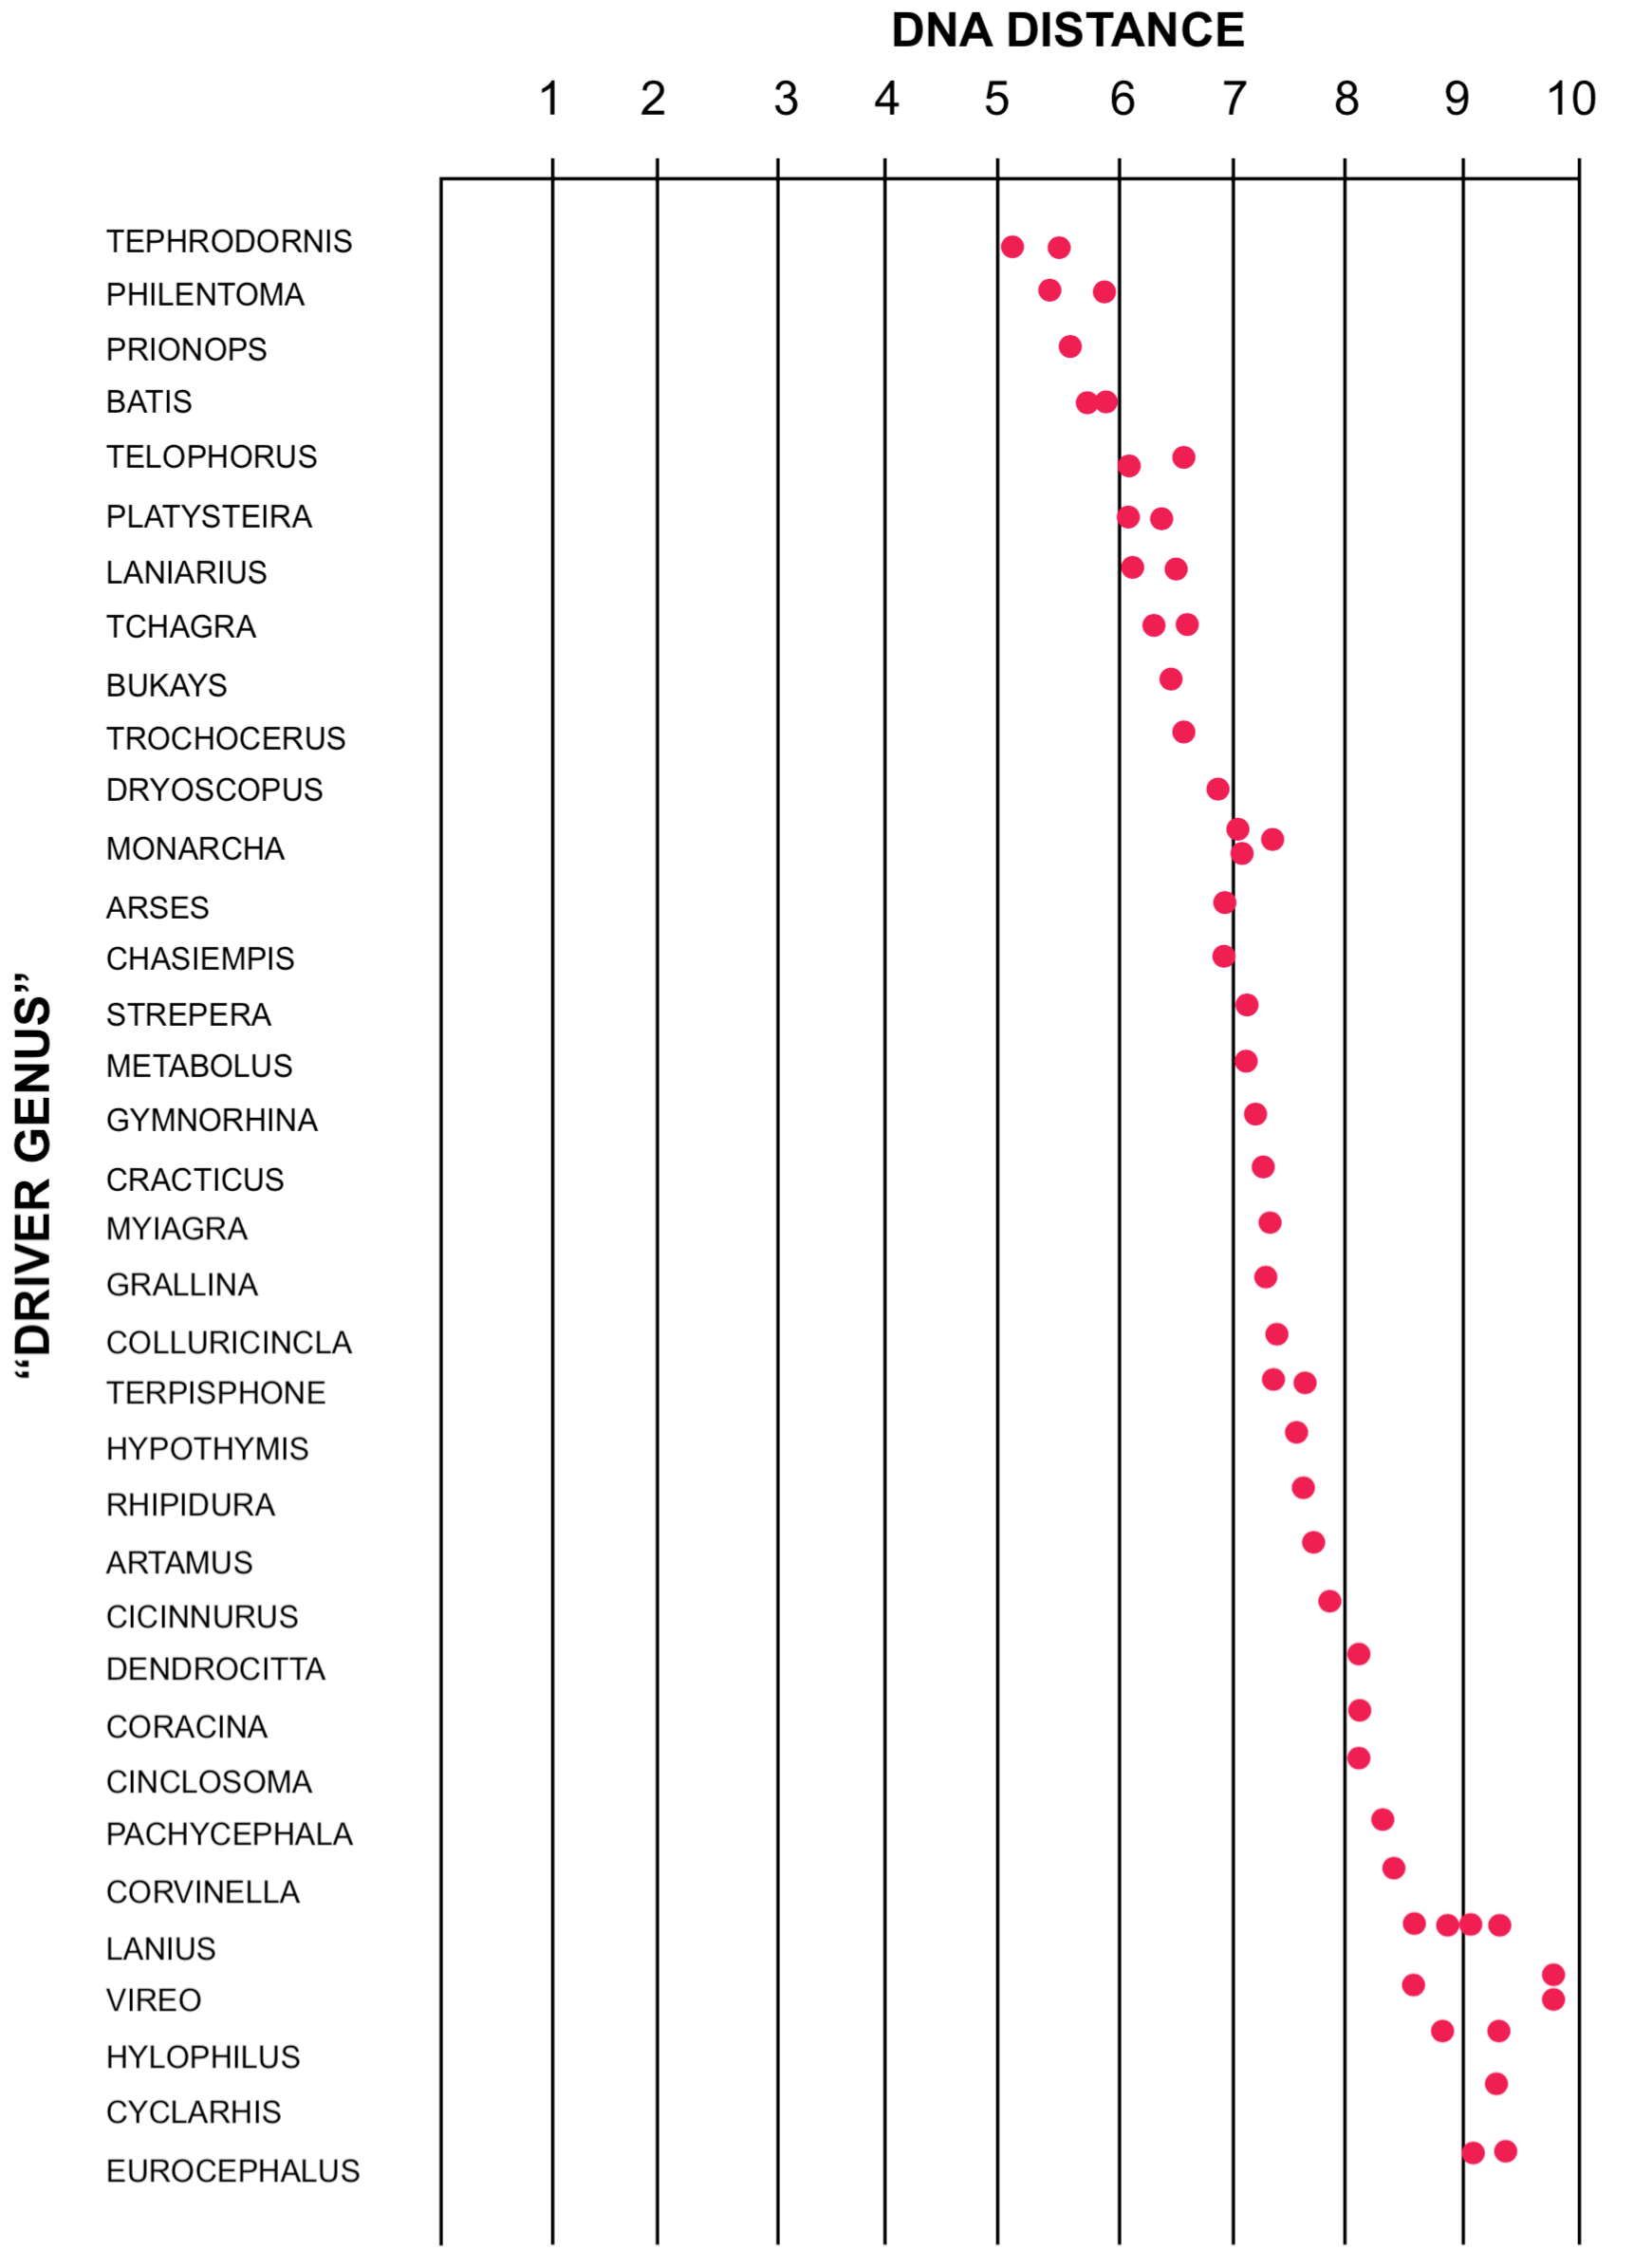
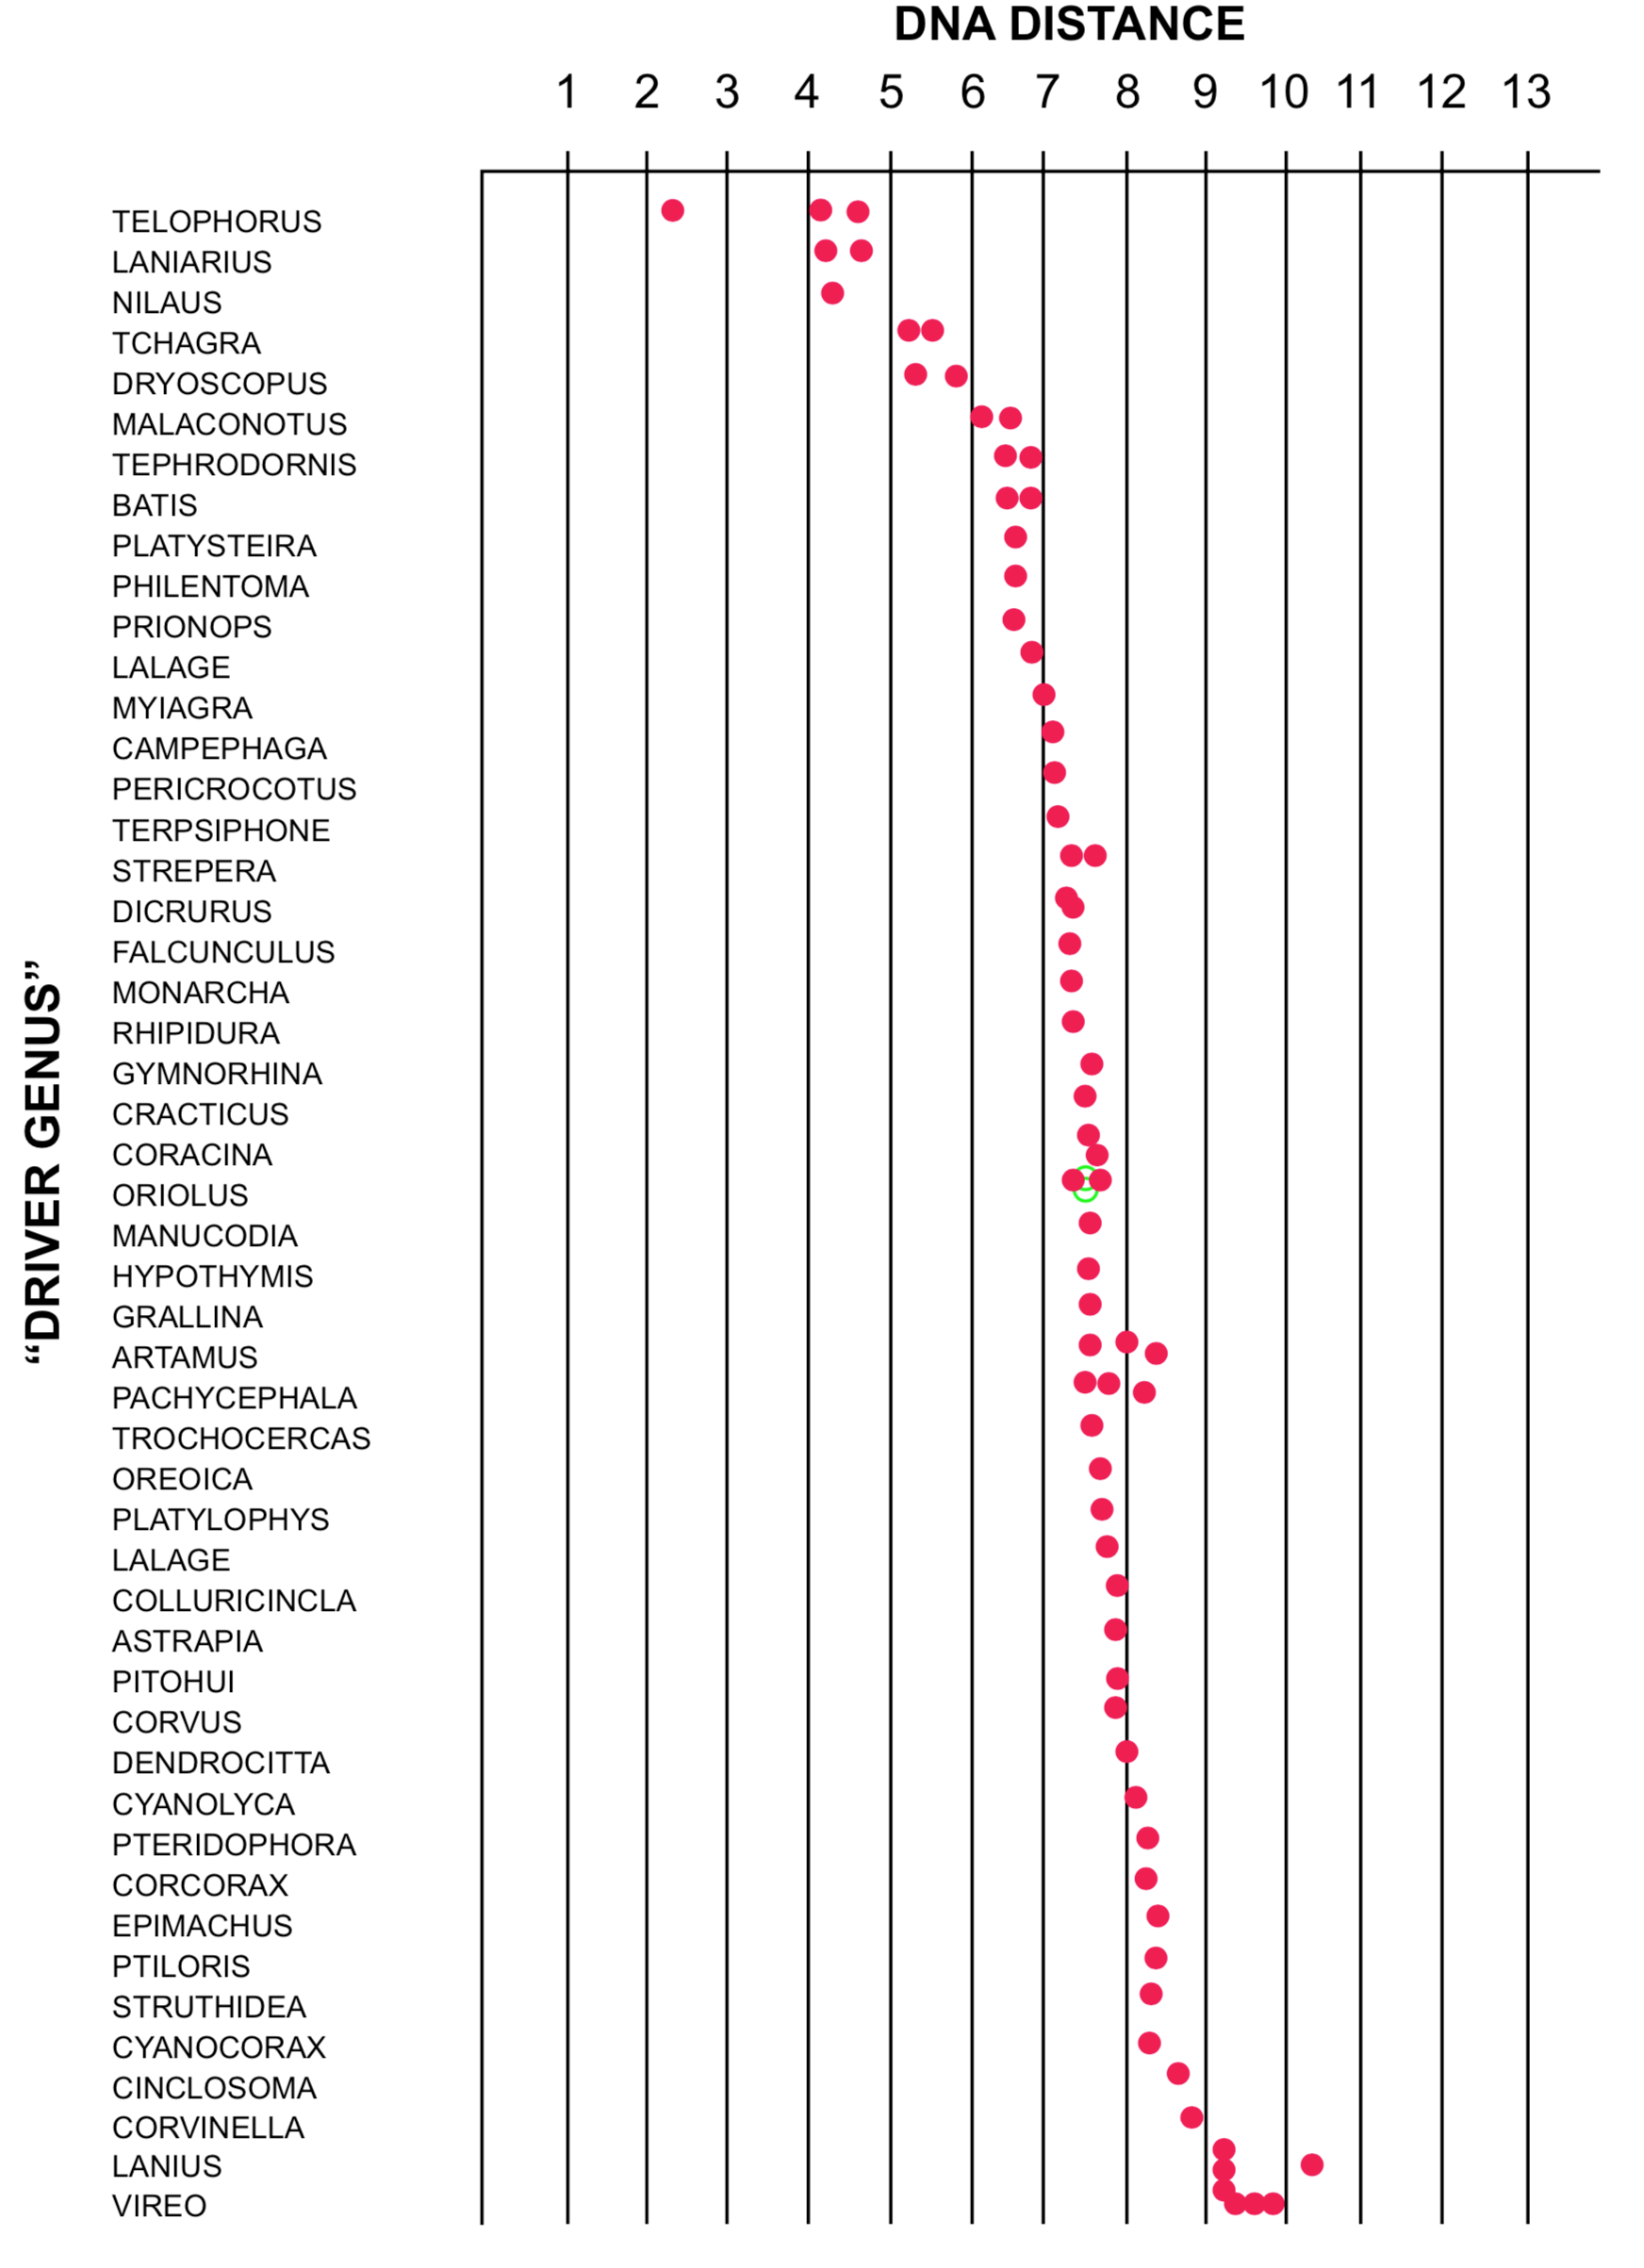
Not all DNA distance experiments produce distinct clusters of species. DNA distances for the blue vanga of Madagascar are shown in Figure 6. No distinct clusters are seen, nor any very close relatives. A similar lack of meaningful clustering is shown by the Australian "nuthatches" (Sibley and Ahlquist 1982c). Another problematic result is illustrated in Figure 7. Here the DNA distances for the olive bush-shrike are shown. Note the lack of distinct clustering among the values. The gaps that do exist are small, and do not appear to have biological significance. In these instances, the DNA/DNA hybridization method does not seem to have given a clear answer to the question of the relationships of the species involved.
FIGURE 6. DNA distances to several species of songbirds, for the blue vanga, Leptopterus madagascarinus, Family Vangidae. Note the lack of significant gaps in the range of values. Data from Sibley and Ahlquist 1985d.FIGURE 7. DNA distances to several species of songbirds, for the olive bush-shrike, Telophorus olivaceous, Family Laniidae. Note the lack of significant gaps in the distribution of the values. Data from Sibley and Ahlquist 1985d.
CRITICISMS OF DNA HYBRIDIZATION METHODOLOGY
Several papers critical of various aspects of DNA hybridization have recently been published (Templeton 1985, 1986; Britten 1986; Houde 1986, 1987; Cracraft 1987). The criticisms may be divided into those pertaining to the assumptions, the experimental technique and the interpretation of the data (Houde 1987). I will discuss several of the criticisms that have been raised.
Criticisms of the assumptions of the method. Acceptance of the method of DNA hybridization is based on the acceptance of certain assumptions, such as that all single-copy DNA sequences have homologs with which they can hybridize, and all degrees of divergence can be detected (Sibley and Ahlquist 1983a, p. 257). Another assumption is that nonhomologous sequences will not be similar enough to hybridize (Sibley, Ahlquist and Sheldon 1987, p. 114). However, each of these assumptions is sometimes violated (see Templeton 1986, Zweibel et al. 1982).
The first assumption is violated because different lineages probably have unique sequences, without homologs in other lineages. If homologous sequences have diverged beyond the 75-80% matching required for duplex formation (Sibley, Ahlquist and Sheldon 1987), homology could not be detected by the method.
The second assumption is violated because not all degrees of divergence can be detected. For example, random reassociation is reported below about 45ºC (Sibley and Ahlquist 1981, p. 305), making analysis impossible below this temperature. To avoid this problem, the beginning temperature used experimentally is usually about 60ºC. Since most homologous hybrids melt at about 80-85ºC, the method can be applied only for DT50H values less than about 20-25 units. Even this range may be too great, as a rapid departure from a linear relationship is reported at DT50H greater than about 15 (Houde 1987; Sibley and Ahlquist 1985d, p. 152).
The assumption that nonhomologous sequences will not form duplexes may be true in most cases, but it appears that some nonhomologous proteins do have similar amino acid sequences (see Hill and Hastie 1987, Schwabe and Warr 1984), implying similar DNA sequences and the possibility of nonhomologous matching in duplex formation.
Criticisms of experimental methodology. The experimental methodology has been criticized on two main counts: experimental uncertainty and the nature of the DNA sequences being compared.
Variation in fragment size may cause inconsistencies in experimental results (Sibley and Ahlquist 1981, p. 307; Sibley, Ahlquist and Sheldon 1987, p. 104). Differences in fragment length can alter the melting temperature by 1.5 to 2.5ºC (Caccone and Sbordoni 1987). Variation between individuals of a species can also affect experimental error (Cracraft 1987), and should be better analyzed. However, in hybridizations involving six species and subspecies of juncos, the maximum DTm distance detected was only 0.2 (Shields and Straus 1975). The range of DT50H values among 13 individuals of the American robin was 2.1 (Sibley and Ahlquist 1983a). Repeated measurements using the same material may vary by 0.6ºC (Sibley and Ahlquist 1983a, p. 265). Overall uncertainty has been estimated as from 0.4 (Shields and Straus 1975) to about 2 (Sibley and Ahlquist 1981, p. 319) or possibly even as high as 3.1 (Sibley and Ahlquist 1983a, p. 275). It appears that the total uncertainty in comparing two DNA distances based on single measurements could be large enough to cause problems in interpretation.
Another question concerns the nature of the DNA used in the experiments. The distinction between single-copy and multiple-copy DNA depends on experimental conditions (McCarthy and Farquhar 1972). If DNA from different species reacts in different ways, it seems possible that the DNA samples from the two species might not be equivalent qualitatively or quantitatively. How well the technique separates the single-copy DNA is not clear (see Sibley and Ahlquist 1981, p. 319), nor is it certain that the single-copy DNA contains the sequences that distinguish species. Species differences may be determined by developmental control sequences, which may be found among the moderately repetitive sequences. The sometimes considerable differences between phylogenies based on DNA distances and those based on morphology raise the question of whether the appropriate data are being collected. (For further discussion of this point, see below under section titled "DNA distance and relationships".)
Criticisms of data interpretation. The most severe criticisms of the DNA distance method have been directed against the method of tree construction and the accuracy of the "DNA clock".
The validity of using a single distance figure to construct phylogenetic trees is open to question. DNA distance may not be an accurate indicator of branching order if it is not well correlated with time. This is because the DNA distance is the sum of the differences between two species. Species that diverge slowly might have smaller DNA distances than species that diverged rapidly, regardless of time since divergence. Simply showing that two measurements are statistically different (e.g., Sibley and Ahlquist 1987) does not necessarily indicate their order of branching. Since it has been shown that rate differences exist (Catzeflis et al. 1987, Houde 1987, Sheldon 1987b), trees based solely on DNA distance should be checked against other methods.
Another problem with the method of tree construction is that branching points within a tree are often separated by less distance than the experimental uncertainty (usually estimated at about 1.0, but possibly up to 3.0 units, Sibley and Ahlquist 1983a, p. 275). Branches of a tree should be separated by distances greater than the experimental uncertainty if the data are to be used to determine the order of branching.
Another criticism of the method of tree construction is that it is not cladistic, that is, the DNA hybridization method makes no distinction between "shared derived" sequences and "shared primitive" sequences. Instead, it is simply an attempt to sum the unique (autoapomorphous) sequences of two species. In addition, Houde (1987) has pointed out that the branching pattern of a DNA distance tree depends on the clustering method used, and Lanyon (1985) has shown that omission of a single taxon can affect the branching order of the remaining taxa. This lack of stability of some DNA trees under differing conditions weakens confidence in the method.
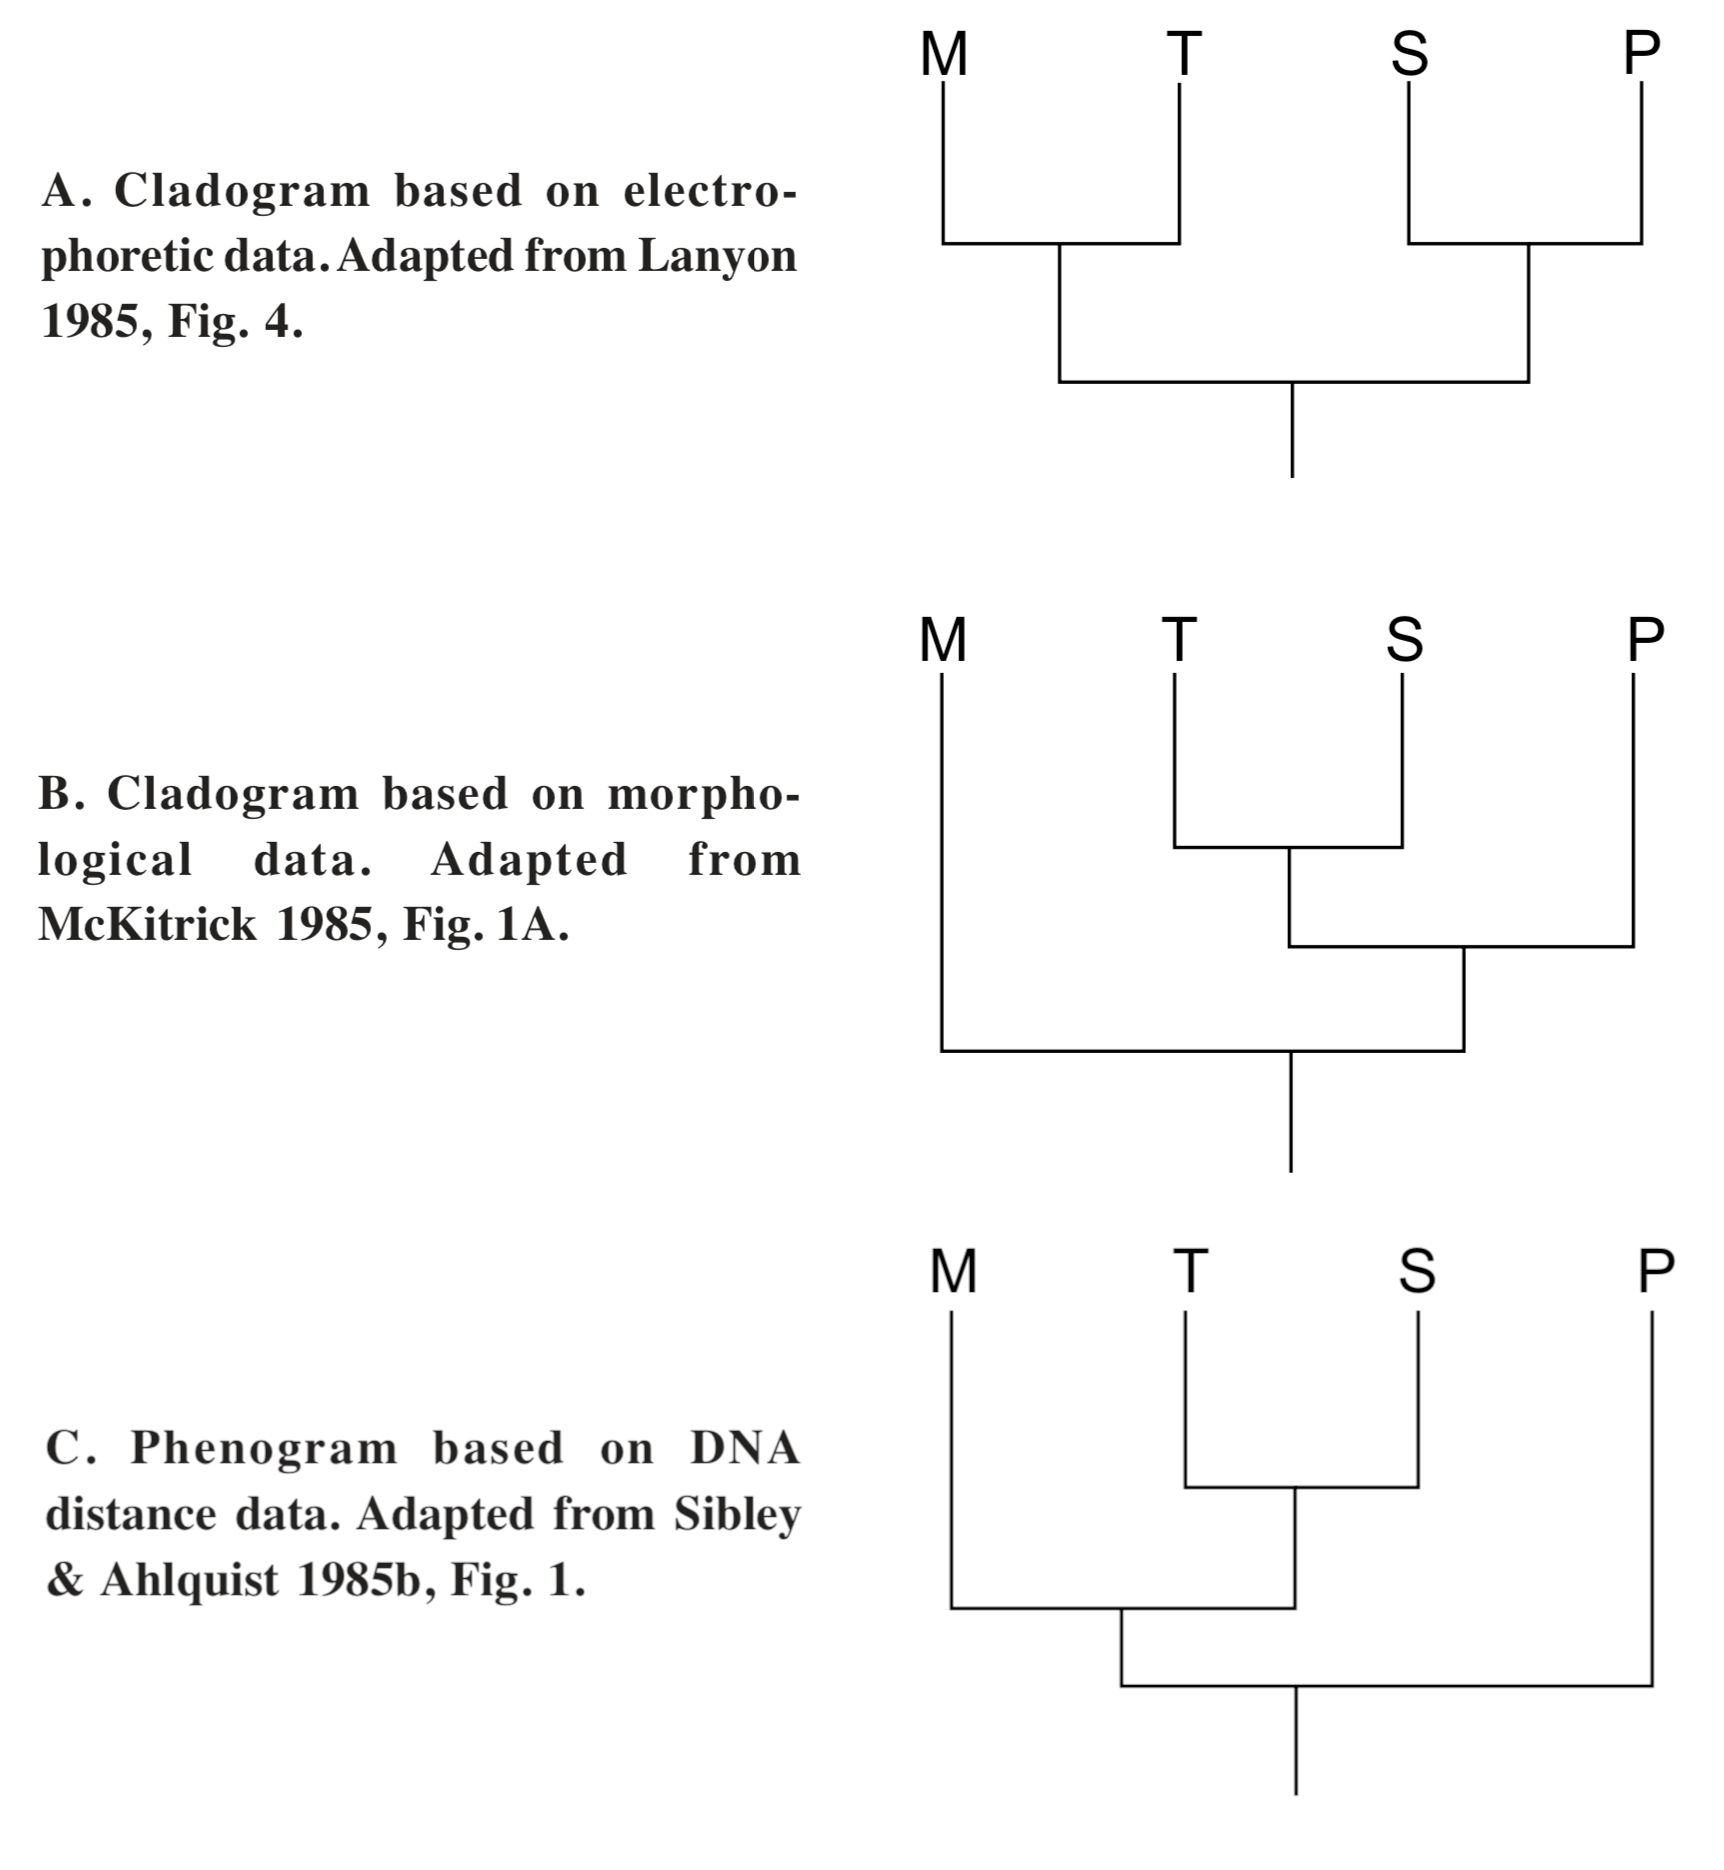
Phylogenetic trees based on DNA distance often conflict with trees based on other types of data (e.g., Sibley and Ahlquist 1984a, 1985a,b,d; Lanyon 1985). Agreement of DNA distance data with morphological data is good when species are morphologically similar, but declines as morphological differences increase, such as at the levels of family and order (Sibley and Ahlquist 1983a, p. 278). Three phylogenies of the superfamily Tyrannoidea, each based on a different database, were compared by Lanyon (1985). The three databases were based respectively on morphology, protein electrophoresis, and DNA/DNA hybridization (see Figure 8). Each phylogeny was different, with no agreement of all three methods on any relationships at the family or subfamily levels. Lanyon (1985) suggested that the three groups may all have arisen at essentially the same time. The lack of agreement between different methods may suggest the existence of separate lineages. On the other hand, it might be that the three groups are descended from a common ancestor with a high degree of genetic variability, or that point mutations are not the only factor affecting measurements of DNA distance.
FIGURE 8. Comparison of trees for four species of suboscines. Based on three different data sets M = Myiarchus, S = Schiffornis, T = Tityra, P = Pipra.
Some comments on the DNA clock. Although Sibley and Ahlquist have backed away from their earlier insistence that their method is clock-like (Catzeflis et al. 1987), the idea is still considered useful (Sibley and Ahlquist 1987) and a few comments concerning the "clock" are given below.
The theoretical basis for the DNA distance clock rests on the assumption of the importance of neutral mutations. Yet the method is designed to eliminate most of the DNA in which mutations seem most likely to be neutral, the repetitive DNA. Mutations in translated sequences of the single-copy DNA may be subject to natural selection to a significant extent. If true, different branches of a lineage might diverge at different rates, making it impossible to reconstruct the order of branching from the distance data. The importance of this effect would depend on the relative proportions of translated DNA and non-translated intervening sequences.
Mutation rate differences of 25-50% have been reported among herons (Sheldon 1987b) and primates (Fitch 1986; Bonner, Heinemann and Todaro 1980). Catzeflis et al. (1987) estimated the rate for rodents to be ten times the rate for hominoid primates. These estimates are based on evolutionary assumptions concerning the time since divergence from a hypothetical common ancestor, and show that the proposed clock is not consistent with the evolutionary assumptions.
It is difficult to compare estimates of time since divergence based on DNA distances, with estimates based on the fossil record. Fossil songbirds are not abundant and are difficult to identify even to family. However, no fossil songbirds are known before the Miocene (Brodkorb 1987, Olson 1985), while the proposed DNA distance clock suggests divergence of most families by the end of the Eocene (Sibley and Ahlquist 1985c). This difference has not been resolved satisfactorily.
The reason for differences in mutation rates is not yet known. It has been suggested (Britten 1986; Li, Tanimura and Sharp 1987) that mutation rate may depend on the number of DNA replications per year. This hypothesis has not been adequately studied, but does not appear to be satisfactory. Another suggestion (Britten 1986) is that differences in mutation rates are due to differences in efficiency of DNA replication and repair enzymes. Another possibility that deserves more attention is that many differences in DNA sequences maybe the result of the original creation of separate lineages rather than to divergence from a common ancestor.
WHAT DOES DNA DISTANCE MEAN?
Despite the shortcomings of the DNA/DNA hybridization method, there appear to be some interesting patterns in the results. It seems useful to attempt to evaluate the data to determine whether it can be meaningfully interpreted within a creationist philosophical framework.
Causes of DNA sequence similarities. Similarities in organisms could come about from a number of different causes (see Coyne and Barton 1988, Gibson 1986). Neither chance nor convergence seem plausible as causes of DNA sequence similarity. Sibley and Ahlquist (1985c, p. 84) state that 80% homology is required to form a stable DNA duplex at 60ºC. Random changes do not seem likely to create 80% similarity in a sequence of 500 base pairs, even if aided by selection. The possible importance of constraints on genetic variation as a cause of convergence is not known. Cross-species gene exchange has been suggested as a cause of DNA similarity (Syvanen 1987), but it is not well understood, and seems to be uncommon.
There are at least two other possibilities for explaining similarities in DNA sequence: common ancestry and common design. Creationists accept both factors as valid. The question of interest here is whether the DNA distance data show any pattern that might be useful to distinguish common ancestry from common design. The following sections pursue this question further.
How rapidly do DNAs diverge? The rate of change of DNA sequences has never been measured directly, so it is difficult to estimate how much DNA divergence is plausible within 5,000 to 10,000 years. No practical method is available that detects all point mutations in an entire genome, although it is possible to clone and sequence a gene and compare genes from different species. To be meaningful, variation within a population would have to be distinguished from variation between populations. It is problematic whether the results could be extrapolated to entire genomes.
Experimentally detected spontaneous mutations appear to be rare. Most estimates of mutation rate are based on protein electrophoresis, and are minimum rates because electrophoresis detects only mutations resulting in a substitution of an amino acid having different charge characteristics. Overall mutation rates are greater by an unknown amount. Mutation rates for laboratory mice have been estimated at about 10-6 per locus (gene) per generation (Neel, Mohrenweiser and Mesiler 1980; Russell et al. 1979; Johnson and Lewis 1981; Johnson et al. 1985). This is about 10-9 per nucleotide per generation (assuming an average of 103 amino acids per locus, see Table 2 in Jukes 1980). A mutation rate of 10-8 (per nucleotide) as an average for the entire genome would suggest a rate of DNA divergence on the order of 1% per Ma, or 0.01% per 10,000 years.
The highest mutation rate known for a human genetic disease (Duchenne muscular dystrophy) is about 10-4 (Rotter and Diamond 1987, Moser 1984). This seems a very high rate for a deleterious mutation, and suggests that there is much more to learn about mutation rates, such as the causes of mutational "hot spots". The DNA/DNA hybridization technique is probably sensitive to major differences in DNA sequence, but may not be able to distinguish small differences from experimental uncertainty. The questionable ability of the method to identify homologous sequences also weakens any confidence one might like to have in any estimate of mutation rate based on DNA distance. Since DNA distance is not considered to be linear with time (Sibley and Ahlquist 1985c, Catzeflis et al. 1987), estimates of mutation rates based on DNA distance might not be meaningful. Rough estimates are from about 0.1% per Ma to more than 1% per Ma (Britten 1986, Table 1). These estimates are based on assumptions of a hypothetical common ancestor and a datable speciation event.
Determinations of DNA distance between populations of known historical age are not available. Many historically dated introductions are known, and measurements of DNA distances among them would be of interest. If different individuals of a species may differ by more than 2 DNA distance units (Sibley and Ahlquist 1983a), it seems likely that newly formed daughter species could differ by that amount at the time of their formation.
Based on a study by Fitch and Atchley (1985), Lewin (1985) suggested that mutation rates in inbred laboratory mice may be as high as about 5×10⁻⁴ per locus, which would be about 5×10⁻⁷ per nucleotide pair per generation. The rate of DNA divergence calculated from this mutation rate would be on the order of 0.5% divergence per 10,000 years, far higher than previous estimates. However, other explanations of the data have been offered (Bishop et al. 1985, Bonhomme et al. 1987, Green et al. 1985, Johnson et al. 1985). The present interpretation (Fitch and Atchley 1987) seems to be that the original breeding stock came from a cross between two subspecies and that a high degree of heterozygosity has been maintained in the breeding stock. Thus there seems to be no presently accepted evidence that inbred mice have high mutation rates.
DNA distance and relationships. It seems likely that all species in a genus of birds share a common ancestry. DNA distances for congeneric birds are usually less than about 3.0, although distances as high as 5.3 have been recorded (Sibley and Ahlquist 1985d). Experimental uncertainty can easily explain distances of 2.5 (see above under criticisms of methodology). Distances greater than 4 or 5 are not so easily explained by experimental uncertainty, and another explanation should be sought.
Differences in DNA among genetically related species may not be due exclusively to point mutations. Viruses, movable elements, and chromosomal deletions and rearrangements may affect comparisons of DNA sequences. The effects of these factors should be investigated. Natural selection may also affect DNA sequences greatly enough to affect DNA distances. If most mutations are subject to natural selection rather than being neutral, it will be necessary to reevaluate the use of DNA sequence comparisons in estimating mutation rates and in estimating the importance of neutral mutations in evolution.
On the other hand, species may have been created with a high degree of genetic variability, with many different genes acting on single traits (polygenes) and many alternative forms of genes (multiple alleles). Speciation could then result in division of the original gene pool with concomitant differences in DNA sequences without the need for mutations (see Lester and Bohlin 1984, p. 168). The result would be increasing specialization and loss of adaptability, trends well illustrated in insular faunas.
The fact that DNA distance is sometimes poorly correlated with other methods of classification illustrates the difficulties in classification. The example of the groups of New World tyrant flycatchers has already been mentioned. A few other examples are described in the paragraphs below.
The barbets (family Capitonidae) are believed to be related to the woodpeckers, and are found in both Africa and South America. DNA distances between species of this family are as high as 17.4 (Sibley and Ahlquist 1985d). The explanation given is that the African and South American groups are only distantly related, although they are morphologically similar. On the other hand, the DNA distance between pelicans and New World vultures, classified in different orders, is only 9.7 (Sibley and Ahlquist 1985d). This latter figure is about the same as the DNA distance between kinglets and Old World warblers, both from the same subfamily (Sibley and Ahlquist 1985c).
Species from different subfamilies of vireos may have DNA distances of only 4.1 (Sibley and Ahlquist 1982b). Compare this with the DNA distance of 5.3 for two species in the same genus of treecreepers (Sibley, Schodde and Ahlquist 1984). One would expect species from the same genus to have smaller DNA distances than species from different subfamilies. It appears that similar DNA distance values may not have the same significance in different groups, and may not always be accurate indicators of relationships.
Although taxonomic groupings determined by DNA distances are often congruent with those determined by morphology, the number of inconsistencies is substantial. Unless some independent evidence can be found to support the relationships proposed from DNA distances, it seems reasonable to suggest that a point is reached beyond which the DNA/DNA hybridization method is not useful in determining relationships. On the other hand, if morphology is truly subject to convergence as much as is suggested by the DNA/DNA hybridization technique, classifications based on morphology need to be reevaluated. The usefulness of fossils in tracing ancestry would also be seriously challenged, since morphology is the basis for comparing fossils.
Design vs. ancestry. One goal of creationism would be to search for some method of distinguishing differences in design from differences resulting from divergence from a common ancestor. It would be desirable to find a method that clusters species into separate and distinct groups. The DNA distance method seems to be able to do this for some groups of songbirds (see Figure 4) but does not do so well with others (see Figures 6,7).
Since DNA distances for songbirds seem to produce species clusters at low values, and these clusters often seem distinct at DNA distances of about 8 or less (see Figure 3), one could propose that the species within such a cluster may be truly related by ancestry. Distances greater than 8 or 10 appear to be of limited usefulness in determining relationships, either because of limitations of the technique, or because such differences are due to separate ancestries.
Additional data would be helpful in testing whether these figures are plausible. Especially interesting would be determination of DNA distances for the following: populations of known historical age, such as various breeds of pigeons or other domesticated species; similar species with greatly differing chromosomal banding patterns, such as the muntjacs; and groups with disjunct distributions, such as parrots or trogons. Complete matrices of DNA distances for all species in a few related groups would also be of interest. Such information could significantly affect the above tentative interpretations.
SUMMARY AND CONCLUSIONS
DNA strands are held together by hydrogen bonding between complementary bases in the DNA. The closer the matching of the two strands, the higher the temperature required to separate them. DNA distance is the number of degrees Celsius the melting temperature of a hybrid DNA duplex is lowered because of mismatching of DNA bases from the two different species. DNA distance is used as a measure of the similarities in base sequence of DNA from two species, and is used as an estimate of the closeness of their relationship. However, as the difference between two species increases, the amount of DNA able to form duplexes decreases. If the portion forming duplexes is less than perhaps 90-95% of the DNA fragments, the results may be of questionable significance.
Phylogenies based on DNA/DNA hybridization have been constructed for several groups, including ratites, herons and songbirds. Among songbirds, the following trends are noted:
DNA distance values using a single tracer species are typically not continuously distributed, but show gaps at values less than about 8. At values above about 10, the values become more nearly continuously distributed (Figure 4).
Species often tend to form clusters that are separated from other clusters at DNA distances of about 6 to 9 (Figure 3).
Nodes joining species clusters at distances of about 10 or more are so close together as to make sequencing of the nodes highly questionable (Figure 3).
DNA distances seem to be useful in assigning a species to a group for values less than about 6 or 8. Occasionally, a DNA distance value is unexpectedly high, suggesting a species has been misclassified (e.g., Donacobius, Figure 4).
DNA distances sometimes indicate a probable genetic similarity of two groups of species (e.g., mimids and sturnids, Figure 4) at values less than about 8.
DNA distances of the same magnitude do not necessarily have the same significance in different groups (see above discussion under DNA distance and relationship).
These trends suggest the following tentative conclusions:
Low DNA distances (less than 5 or 6) between species of songbirds suggest genetic similarity, and probable common ancestry if supported by other data.
High DNA distances (above 10) suggest genetic differences, but are not necessarily indicative of evolutionary relationships between groups. Instead, they may suggest different ancestries.
The results of DNA distance experiments are sometimes unclear and should not be used as the sole basis for a phylogeny.
Equal DNA distances in different groups do not necessarily have equivalent meaning. Results from one group should not be extrapolated to another group.
To this creationist, the DNA-distance data present interesting hypotheses that might not have been thought of without the technique. From this view, the method is interesting and stimulating. However, the method is fraught with difficulties similar to those of other methods of systematics. The ability to cluster species into groups is interesting and may be useful. Attempting to infer time since divergence or the precise order of speciation events seems to require too much from the method. More data would be of interest, especially complete matrices for family groups, and DNA distances between isolated populations of known historical age. Such data will continue to be of interest to those interested in developing a modern creationary theory of systematics.
LITERATURE CITED
Adelman, J.P., C.T. Bond, J. Douglass, and E. Herbert. 1987. Two mammalian genes transcribed from opposite strands of the same DNA locus. Science 235:1514-1517.
Bernardi, G. and G. Bernardi. 1986. Compositional constraints and genome evolution. Journal of Molecular Evolution 24:1-11.
Bishop, C.E., P. Boursot, B. Baron, F. Bonhomme, and D. Hatat. 1985. Most classical Mus musculus domesticus laboratory mouse strains carry a Mus musculus musculus Y chromosome. Nature 315:70-72.
Bledsoe, A.H. 1987. DNA evolutionary rates in nine-primaried passerine birds. Molecular Biology and Evolution 4:559-571.
Bock, W.J. and J. Farrand. 1980. The number of species and genera of recent birds: a contribution to comparative systematics. American Museum Novitate 2703:1-29.
Bonhomme, F., J-L. Guenet, B. Dod, D. Moriwaki, and G. Bulfield. 1987. The polyphyletic origin of laboratory inbred mice and their rate of evolution. Biological Journal of the Linnean Society 30:51-58.
Bonner, T.I., D.J. Brenner, B.R. Neufeld, and R.J. Britten. 1973. Reduction in the rate of DNA reassociation by sequence divergence. Journal of Molecular Biology 81:123-135.
Bonner, T.I., R. Heinemann, and G.J. Todaro. 1980. Evolution of DNA sequences has been retarded in Malagasy primates. Nature 286:420-423.
Britten, R.J. 1986. Rates of DNA sequence evolution differ between taxonomic groups. Science 231:1393-1398.
Britten, R.J. and E.H. Davidson. 1971. Repetitive and non-repetitive DNA sequences and a speculation on the origins of evolutionary novelty. Quarterly Review of Biology 46:111-133.
Brodkorb, P. 1978. Catalogue of fossil birds. Part 5 (Passeriformes). Bulletin of the Florida State Museum, Biological Sciences 23:139-228.
Caccone, A. and V. Sbordoni. 1987. Molecular evolutionary divergence among North American cave crickets. II. DNA-DNA hybridization. Evolution 41:1215-1238.
Catzeflis, F.M., F.H. Sheldon, J.E. Ahlquist, and C.G. Sibley. 1987. DNA-DNA hybridization evidence of the rapid rate of muroid rodent DNA evolution. Molecular Biology and Evolution 4:242-253.
Coyne, J.A. and N.H. Barton. 1988. What do we know about speciation? Nature 331:485-486.
Cracraft, J. 1974. Phylogeny and evolution of the ratite birds. Ibis 116:494-521.
Cracraft, J. 1987. DNA hybridization and avian phylogenetics. Evolutionary Biology 21:47-96.
Fitch, W.F. 1986. Commentary. Molecular Biology and Evolution 3:296-298.
Fitch, W.M. and W.R. Atchley. 1985. Evolution in inbred strains of mice appears rapid. Science 228:1169-1175.
Fitch, W.M. and W.R. Atchley. 1987. Response to Bonhomme et al. Biological Journal of the Linnean Society 30:59-61.
Gibson, L.J. 1986. A creationist view of chromosome banding and evolution. Origins 13:9-35.
Gillespie, J.H. 1986. Natural selection and the molecular clock. Molecular Biology and Evolution 3:138-155.
Green, M.C., D.W. Bailey, E.L. Green, T.H. Roderick and E.S. Russell. 1985. Rapid mutations in mice? Science 230:1407-1408.
Henikoff, S., M.A. Keene, K. Fechtel, and J.W. Fristrom. 1986. Gene within a gene: nested Drosophila genes encode unrelated proteins on opposite DNA strands. Cell 44:33-42.
Hill, R.E. and N.D. Hastie. 1987. Accelerated evolution in the reactive centre regions of serine protease inhibitors. Nature 326:96-99.
Houde, P. 1986. Ostrich ancestors found in the Northern Hemisphere suggest new hypothesis of ratite origins. Nature 324:563-565.
Houde, P. 1987. Critical evaluation of DNA hybridization studies in avian systematics. Auk 104:17-32.
Houde, P. and S.L. Olson. 1981. Paleognathous carinate birds from the early Tertiary of North America. Science 214:1236-1237.
Johnson, F.M. and S.E. Lewis. 1981. Mutation-rate determinations based on electrophoretic analysis of laboratory mice. Mutation Research 82:125-135.
Johnson, F.M., C.F. Aquadro, L.C. Skow, C.H. Langley and S.E. Lewis. 1985. Rapid mutations in mice? Science 230:1406-1407.
Jukes, T.H. 1980. Silent nucleotide substitutions and the molecular evolutionary clock. Science 210:973-978.
Kimura, M. 1968. Evolutionary rate at the molecular level. Nature 217:624-626.
Kimura, M. 1979. The neutral theory of evolution. Scientific American 241(5):98-126.
Lanyon, S.M. 1985. Molecular perspective on higher-level relationships in the Tyrannoidea (Aves). Systematic Zoology 34:404-418.
Lester, L.P. and R.G. Bohlin. 1984. The natural limits to biological change. Zondervan, Grand Rapids, Michigan.
Lewin, R. 1985. Why do inbred mice evolve so quickly? Science 228:1187.
Li, W-H., M. Tanimura, and P.M. Sharp. 1987. An evaluation of the molecular clock hypothesis using mammalian DNA sequences. Journal of Molecular Evolution 25:330-342.
Mayr, E. and J.C. Greenway (eds.). 1960. Check-list of birds of the world. Vol. IX. Museum of Comparative Zoology. Cambridge, Massachusetts.
McCarthy, B.J. and M.N. Farquhar. 1972. The rate of change of DNA in evolution. In H.H. Smith (ed.), Evolution of genetic systems, pp. 1-43. Brookhaven Symposium in Biology No. 23. Gordon and Breach, New York.
McKitrick, M.C. 1985. Monophyly of the Tyrannidae (Aves): comparison of morphology and DNA. Systematic Zoology 34:35-45.
Moser, H. 1984. Duchenne muscular dystrophy: pathogenetic aspects and genetic prevention. Human Genetics 66:17-40.
Neel, J.V., H.W. Mohrenweiser, and M.H. Meisler. 1980. Rate of spontaneous mutation at human loci encoding protein structure. Proceedings of the National Academy of Sciences, USA 77:6037-6041.
Olson, S.L. 1985. The fossil record of birds. In D.S. Farner, J.R. King, and K.C. Parkes (eds.), Avian Biology, Vol. 8, pp. 79-238. Academic Press, New York.
Rotter, J.I. and J.M. Diamond. 1987. What maintains the frequencies of human genetic diseases? Nature 324:289-290.
Russell, W.L., E.M. Kelly, P.R. Hunsicker, J.W. Bangham, S.C. Maddux, and E.L. Phipps. 1979. Specific-locus test shows ethylnitrosurea to be the most potent mutagen in the mouse. Proceedings of the National Academy of Sciences, USA 76:5818-5819.
Schwabe, C. and G.W. Warr. 1984. A polyphyletic view of evolution: the genetic potential hypothesis. Perspectives in Biology and Medicine 27:465-485.
Sheldon, F.H. 1987a. Phylogeny of herons estimated from DNA-DNA hybridization data. Auk 104:97-108.
Sheldon, F.H. 1987b. Rates of single-copy DNA evolution in herons. Molecular Biology and Evolution 4:56-69.
Shields, G.F. and N.A. Straus. 1975. DNA-DNA hybridization studies in birds. Evolution 29:159-166.
Sibley, C.G. and J.E. Ahlquist. 1981. The phylogeny and relationships of the ratite birds as indicated by DNA-DNA hybridization. In G.G.E. Scudder and J.L. Reveal (eds.), Evolution Today, Proceedings of the Second International Congress of Systematics and Evolutionary Biology, pp. 301-335. Hunt Institute for Botanical Documentation. Carnegie-Mellon University, Pittsburgh.
Sibley, C.G. and J.E. Ahlquist. 1982a. The relationships of the Hawaiian honeycreepers (Drepaninini) as indicated by DNA-DNA hybridization. Auk 99:130-140.
Sibley, C.G. and J.E. Ahlquist. 1982b. The relationships of the vireos (Vireoninae) as indicated by DNA-DNA hybridization. Wilson Bulletin 94:114-128.
Sibley, C.G. and J.E. Ahlquist. 1982c. The relationships of the Australo-Papuan sitellas Daphoenositta as indicated by DNA-DNA hybridization. Emu 82:173-176.
Sibley, C.G. and J.E. Ahlquist. 1983a. Phylogeny and classification of birds based on the data of DNA-DNA hybridization. In R.F. Johnson (ed.), Current Ornithology, vol. 1, pp. 245-292. Plenum Press, New York.
Sibley, C.G. and J.E. Ahlquist. 1983b. The relationships of the Australo-Papuan fairy-wrens as indicated by DNA-DNA hybridization. Emu 82:251-255.
Sibley, C.G. and J.E. Ahlquist. 1984a. The phylogeny of the hominoid primates, as indicated by DNA-DNA hybridization. Journal of Molecular Evolution 20:2-15.
Sibley, C.G. and J.E. Ahlquist. 1984b. The relationships of the starlings (Sturnidae: Sturnini) and the mockingbirds (Sturnidae: Mimini). Auk 101:230-243.
Sibley, C.G. and J.E. Ahlquist. 1985a. The phylogeny and classification of the Australo-Papuan passerine birds. Emu 85:1-14.
Sibley, C.G. and J.E. Ahlquist. 1985b. Phylogeny and classification of New World suboscine passerine birds (Passeriformes: Oligomyodi: Tyrannides). In P.A. Buckley, M.S. Foster, E.S. Morton, R.S. Ridgely, and F.G. Buckley (eds.), Neotropical Ornithology, pp. 396-428. Ornithological Monographs No. 36. American Ornithologists' Union, Washington, D.C.
Sibley, C.G. and J.E. Ahlquist. 1985c. The phylogeny and classification of the passerine birds, based on comparisons of the genetic material, DNA. In V.D. Ilyichev and V.M. Gavrilov (eds.), ACTA, vol. 1, pp. 83-121. Proceedings of the 18th International Ornithological Congress, Moscow, August 16-24, 1982. Academy of Sciences of the USSR.
Sibley, C.G. and J.E. Ahlquist. 1985d. The relationships of some groups of African birds, based on comparisons of the genetic material, DNA. In K-L. Schuchmann (ed.), Proceedings of the International Symposium on African Vertebrates: Systematics, Phylogeny and Evolutionary Ecology, pp. 115-161. Zoologisches Forschungsinstitut und Museum Alexander Koenig, Bonn.
Sibley, C.G. and J.E. Ahlquist. 1986. Reconstructing bird phylogeny by comparing DNA's. Scientific American 254(2):82-92.
Sibley, C.G. and J.E. Ahlquist. 1987. DNA hybridization evidence of hominoid phylogeny: results from an expanded data set. Journal of Molecular Evolution 26:99-121.
Sibley, C.G., J.E, Ahlquist, and F.H. Sheldon. 1987. DNA hybridization and phylogenetics. Reply to Cracraft. Evolutionary Biology 21:97-125.
Sibley, C.G., R. Schodde, and J.E. Ahlquist. 1984. The relationships of the Australo-Papuan treecreepers Climacteridae as indicated by DNA-DNA hybridization. Emu 84:236-241.
Storer, R.W. 1971. Classification of birds. In D.S. Farner, J.R. King and K.C. Parkes (eds.), Avian Biology, vol. 1, pp. 1-18. Academic Press, New York.
Syvanen, M. 1987. Molecular clocks and evolutionary relationships: possible distortions due to horizontal gene flow. Journal of Molecular Evolution 26:16-23.
Templeton, A.R. 1985. The phylogeny of the hominoid primates: a statistical analysis of the DNA-DNA hybridization data. Molecular Biology and Evolution 2:420-433.
Templeton, A.R. 1986. Further comments on the statistical analysis of DNA-DNA hybridization data. Molecular Biology and Evolution 3:290-295.
Wozney, J., D. Hanahan, V. Tate, H. Boedtker, and P. Doty. 1981. Structure of the pro a2(1) collagen gene. Nature 294:129-135.
Zweibel, L.J., V.H. Cohn, D.R. Wright, and G.P. Moore. 1982. Evolution of single-copy DNA and the ADH gene in seven drosophilids. Journal of Molecular Evolution 19:62-71.