Growth lines found in several invertebrates show promise of serving as a basis for many avenues of investigation. Their value as an independent method for geochronometry is presently questioned, while other methods of using them are being developed.
INTRODUCTION
Periodic growth structures (lines, bands, and rings) are preserved in the skeletons or hard parts of many organisms. Although the best known example is the annual tree rings (not further considered in this paper), periodic growth structures have also been long observed and studied in other organisms (Orton 1923, 1926; Ma 1937; Davenport 1938; Stevenson and Dickie 1954; Sakai 1960). Most current interest, however, was initiated by Wells (1963) when he described "daily" growth lines in living and fossil corals and used these in conjunction with annual growth structures in proposing the growth-line method of "absolute" age-dating (geochronometry). Shortly thereafter, Wells' data was used in studies on the origin of the earth-moon system and the rotational history of the earth (MacDonald 1964; Runcorn 1964). Most recent papers (including Newton 1969; Runcorn 1970; Lamar et al. 1970; Pannella 1972; Scrutton and Hipkin 1973) have used growth lines in this way, rather than as a geochronometric technique. A third application of growth lines, antedating Wells' (1963) paper, is in life history, ecology, and paleoecology studies (e.g., Orton 1926; Ma 1937, 1938; Davenport 1938). This application has been made more recently by Rhoads and Pannella (1970), Farrow (1971, 1972), and Tevesz (1972).
Although all three applications of growth lines have philosophical significance, it was their use in geochronometry that caused greatest perplexity to those believing in the Biblical creation account and a short chronology. According to Wells (1963) the importance of the growth-line method was its apparent independence from radiometric age-dating methods and its capability of directly dating fossils. (Radiometric methods for older samples can usually date only certain rocks surrounding the fossils). If this clock independently gave ages similar to the radiometric ages, the confidence in these ages would be increased. Although recent research does not support its use as an independent geochronometric method, preliminary results were in partial agreement with radiometric ages.
In this paper, I will first describe the growth-line method, then discuss problems in its application. Finally, consideration will be given to geophysical and paleoecological implications of periodic growth structures that might have positive use in creation theory and in construction of a flood model.
GROWTH-LINE METHOD OF GEOCHRONOMETRY
To understand the method, the periodic growth structures and a phenomenon called tidal friction need explanation. Periodic growth structures are produced by a living organism and are a record of cyclic changes that occur in growth rate and/or density and composition of growth material. The growth structures used in geochronometry are preserved in coral skeletons, clam and brachiopod shells, fish otoliths (earbones), and stromatolites (algae). They are observed in both living and fossil forms.
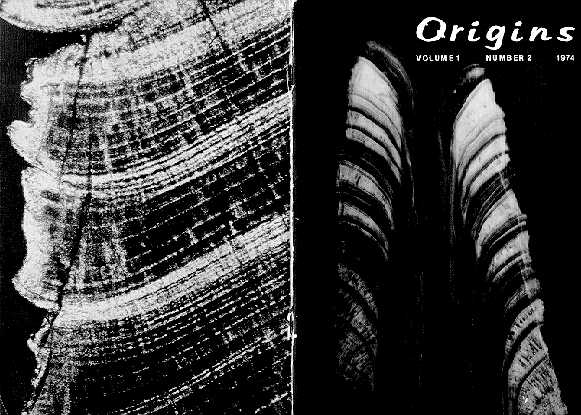
The simplest component of these periodic growth structures consists of a dark band, high in organic content, alternating with a light band of mainly inorganic material, usually CaCO3 (see picture on back cover). This simplest component will here be considered as a circadian (approximately daily) line, although often two or more of these single components are produced each day (Barker 1964). The circadian line is usually from 5 to 60 microns wide. Other growth structures or patterns are constructed by cyclic fluctuations in the width, density, or composition of the circadian lines. Fortnightly, monthly, and annual patterns occur this way. These patterns are correlated with, and are presumably a response of, the organism to various physical environmental factors such as the light-dark cycle, tidal fluctuations, temperature, and sedimentation.
Although sophisticated mathematics is required for a complete treatment of tidal friction and its effects, the basic concept can be understood intuitively. As the earth rotates, the moon, through gravitational attraction, continuously raises tidal bulges on the earth. Due to tidal friction, the bulges lag in time and are carried forward by the rotation of the earth, causing a misalignment of the tidal bulges with respect to the line of centers of moon and earth. (Tidal friction is mainly friction in the tidal currents between water molecules and between the water and the coastline or ocean bottom.) This misalignment produces a torque between the earth and moon causing a deceleration of the earth's rotation and an increase in the moon's angular momentum. The result is a slight increase in day length and a slight decrease in the number of days per month and days per year. (See Goldreich 1972 for a detailed but non-mathematical treatment of the effects of tidal friction.)
The increase in day length is estimated at two thousandths of a second per century (2 msec/century). This is based on observed perturbations in the orbits of artificial satellites and from comparing reported with expected times of ancient eclipses or other astronomical events (Newton 1969; Scrutton and Hipkin 1973). Although the magnitude of change seems insignificant and undetectable, it would be significant in two instances. First, since the increase in day length is additive, the cumulative time shift would be significant even in historical time. For example, the time shift would be 36 seconds in a century, one hour in a millennium, and about 6 hours in 2500 years. An eclipse 2500 years ago would then be reported as occurring 6 hours earlier than expected from present observations and calculations. This type of information was used originally to establish the 2 msec/century value.
The second instance where the change in day length would be significant occurs when the geologic (radiometric) time scale is accepted. One hundred million years ago the day would have been 0.55 hours (2 msec/century × 1,000,000 centuries = 2,000,000 msec = 0.55 hours) shorter than the present day, giving 374 days/year (8766 hours/day ÷ 23.45 hours/day = 374 days/year). At 600 million years (the oldest radioactive dated material where abundant well-defined fossils occur), the day would have been 3.3 hours shorter, giving 424 days/year. It is on this basis that the growth-line method was proposed.
Wells (1963) suggested that if both daily and yearly growth structures could be identified in fossils, the fossil's age could be determined by counting the number of daily bands per yearly band. Thus, from our previous example, a fossil containing 374 daily bands per yearly band would be 100 million years old, and one containing 424 daily bands per yearly band would be 600 million years old. Other ages could be obtained in the same way from other daily bands per yearly band values.
Using fossil coral specimens from the Devonian and Pennsylvanian geologic strata, Wells (1963) counted respectively 385 to 410 and 385 to 390 daily bands per yearly band. From the radiometric dates assigned these strata, the expected number of daily bands would have been 399 and 392 respectively. Approximately 360 daily bands per yearly band were counted in one species of living West Indian coral. Although interesting, this data is inconclusive because of the small number of specimens used and the large range in values
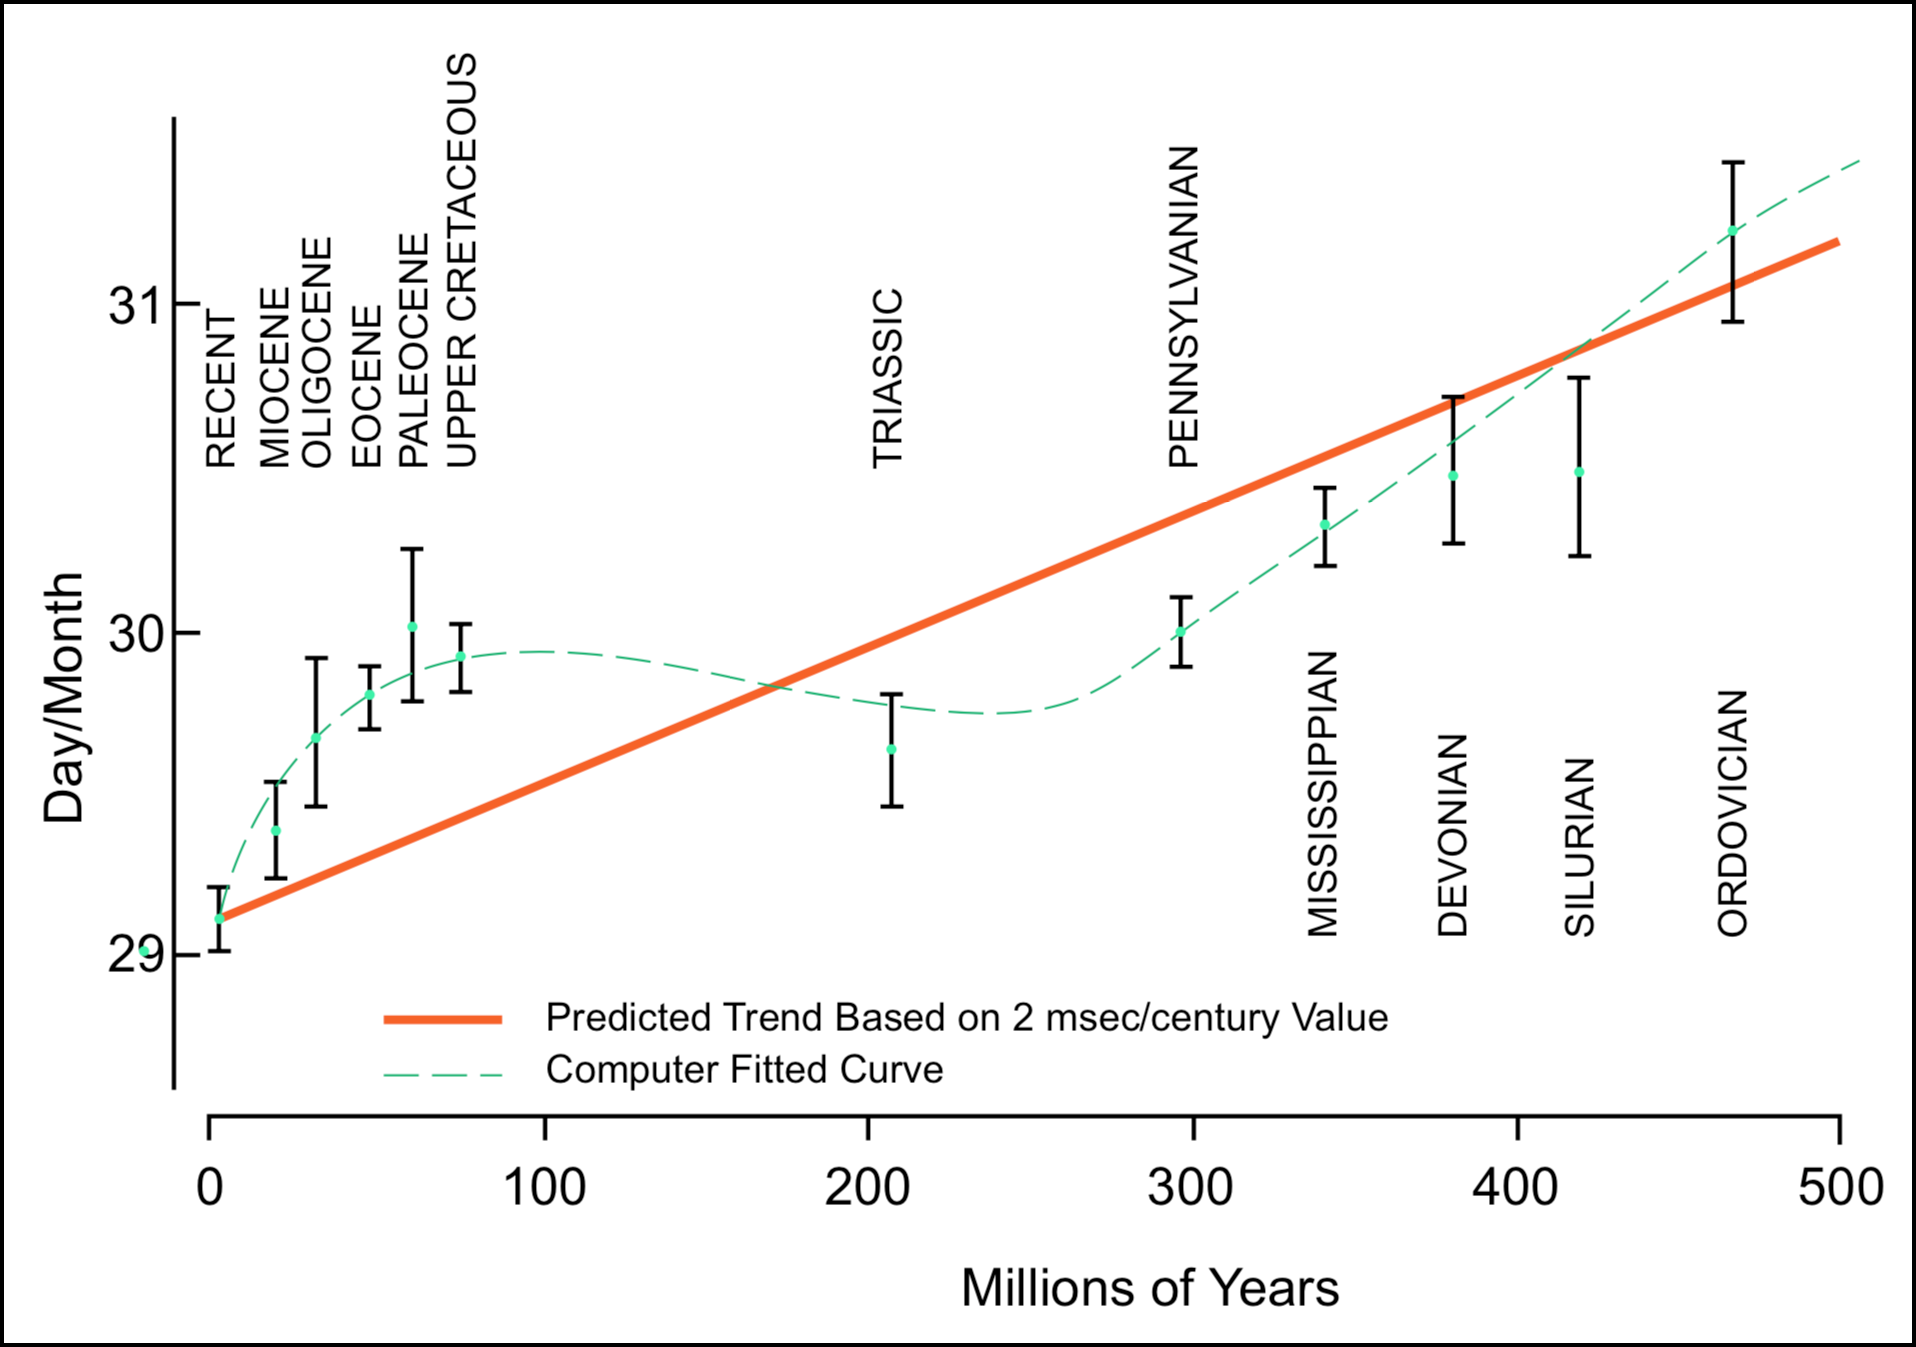
Since this initial paper, most work has been done on clams and results are expressed in terms of changes in days per month rather than days per year, since complete monthly sequences are more commonly preserved in the fossil record. This data is summarized by Pannella (1972). While some of the growth-line ages agree with the radiometric ages, there are two serious anomalies in the present data. One of these is apparent in Figure 1 where the slope of the computer-fitted curve often deviates from the predicted trend. A more striking, but less well substantiated, anomaly based on Precambrian stromatolite data (Pannella 1972) suggests a great reduction of the 2 msec/century value in Archeozoic time if the radiometric ages are correct. These anomalies indicate that either the deceleration of the earth's rotation rate has not always been constant (i.e., it has deviated from 2 msec/century), the radioactive dates are not correct, or insufficient data has been collected. Pannella maintains that while more data is necessary to establish the exact shape of the curve, the present data do strongly support a non-uniform deceleration rate. Implicitly, the radiometric dates are accepted as correct and the growth lines are not used as a geochronometric technique.
FIGURE 1. Variations in the number of days per month during geologic time according to Pannella (1972). Vertical bars indicate ±1 standard error. The computer best fit curve is a fourth order polynomial. (Redrawn from Pannella 1972).
PROBLEMS WITH THE GROWTH-LINE METHOD
Already alluded to, the most serious problem in applying the growth-line method concerns the magnitude and constancy of the deceleration of the earth's rotation rate. The ancient astronomical records on which the historical deceleration values (2 msec/century) are based are not easily interpreted. Some are definitely not reliable. Newton (1969) discusses this problem at some length. The evidence does indicate, though, that the deceleration of the earth's rotation rate has not been constant even within relatively recent historic time. Newton states that "ancient astronomical data show with high confidence that the amount of tidal friction ten centuries ago was twice what it is now." No method exists for independently (i.e., independent from growth lines) determining the magnitude of tidal friction or deceleration prior to the ancient astronomical observations. Geophysicists are now using the growth-line data to obtain prehistoric deceleration rates (Newton 1969; Runcorn 1970). However, if the growth-line data is used to determine deceleration values, it cannot be used as an independent geochronometric method as this would involve circular reasoning. It could be used in geochronometry by calibration with radiometric dates, but then the independence between the two methods is lost and the value of the method greatly reduced.
The use of daily bands per monthly band in most of the recent work poses a second problem. While the rate of revolution of the earth around the sun is assumed to have remained constant, the rate of revolution of the moon around the earth has probably not remained constant. Exactly how it has changed is not known. This introduces a second variable and the possibility of confusion of variables.
Presently insufficient data is available on growth lines in living organisms to properly evaluate their meaning in fossil species. It is not always simple to determine of what a daily, monthly, or yearly band consists (e.g., the bands in the back cover picture). Subdaily bands often occur. These may be confused with daily bands. Apparently lines are at times missing; thus some researchers urge the use of maximum line counts rather than average counts (Clark 1968; Mazzullo 1971). However, this has problems since in one recent species anywhere from 283 to 425 circadian bands per yearly band were found (Farrow 1971). Maximum counts would give high values. If large ranges (283 to 425) in values are typical, large sample sizes (many fossils) would be necessary to get sufficiently good resolution for the method to be meaningful (i.e., the inherent variability or range in values within a single species is of the same magnitude as the range expected from changes in deceleration rate in many hundred million years). In fact, sufficiently well-preserved fossils are rare and subjective bias can be introduced in interpreting unclear growth patterns. Objective methods of identifying and counting these bands are not now available. Environmental factors change the nature of the lines in ways that are far from being completely understood. Some of these problems could disappear with future work, others seem insurmountable.
ALTERNATIVE INTERPRETATIONS OF GROWTH-LINE DATA
The use of growth lines in geochronometry does not seem feasible and is not advanced as such in recent papers on the subject (Pannella 1972; Scrutton and Hipkin 1973). However, other types of information that they might provide could be useful. The available data on growth lines does need to be interpreted in terms of a flood model, and they may be useful in constructing such. One possible explanation of an increase in number of circadian increments per month or year towards the bottom of the geologic column could be related to the depth at which the preflood living specimen occurred. Although depth is known to have an effect on the nature of the growth line in recent organisms (Rhoads and Pannella 1970), no present evidence is available on the relation between depth and number of lines. If valid, this explanation would fit with Clark's ecological-zonation model (Clark 1967, pp. 76-80).
Another possible explanation would be a relatively rapid change in the earth's rotation rate at about the time of the flood. Changes in the magnitude of tidal friction are usually explained in terms of changes in the extent of shallow seas or extent of ice cover particularly in the Antarctic (Goldreich 1972; Newton 1969). Rotation rate could also change by other means than tidal friction, e.g., changes in the moment of inertia could occur through accretion or through redistribution of the earth's mass. It would be surprising if some such activities did not occur at or following the flood, given the violent nature of the event as recorded in inspired writings. While the present growth-line data is not easily interpreted in terms of this explanation, the anomalies that occur in the data do partially support it.
Another way the growth lines may be useful in the support or construction of a flood model is through their use in paleoecology. Growth lines are often sensitive indicators of environmental conditions. Present research in this area is mainly concerned with gathering sufficient data on growth lines in living organisms to allow interpretation of fossil ones. It is suggested that such information as water temperature, depth, and age and season of death may be contained in the growth-line patterns (Barker 1964; Rhoads and Pannella 1970). Clark (1968) suggests that by comparing the individual growth patterns within a fossil assemblage, the assemblage may be determined as a community with a catastrophic death (growth patterns have same endpoint), as a normal life span community (overlapping growth patterns), or no community, e.g., not in position of growth (no correlation between growth patterns). In a flood-model explanation of the geologic column, the first and third cases should have greatest prevalence.
CONCLUSIONS
Relatively little work has been done with these invertebrate growth lines. Their use in geochronometry, geophysics, or paleoecology is still very much in the initial state; therefore, caution should be used in saying just how they can or cannot be used. Present information does not support their use as an independent geochronometric method (Pannella 1972). They may be useful in developing geophysical theory (regarding movements of the earth and moon), although the precision and resolution of the method has not yet been sufficient for really significant contributions in this way either (Scrutton and Hipkin 1973). Further research is necessary to determine their potential as paleoecological indicators.
REFERENCES
Barker, Richard M. 1964. Microtextural variation in pelecypod shells. Malacologia 2:69-83.
Clark II, George R. 1968. Mollusk shell: daily growth lines. Science 161:800-802.
Clark, Harold W. 1967. Genesis and science. Southern Publishing Association, Nashville, Tennessee. 128 pp.
Davenport, C. B. 1938. Growth lines in fossil pectens as indicators of past climates. Journal of Paleontology 12:514-515.
Farrow, G. E. 1971. Periodicity structures in the bivalve shell: experiments to establish growth controls in Cerastoderma edule from the Thames estuary. Palaeontology 14:571-588.
Farrow, G. E. 1972. Periodicity structures in the bivalve shell: analysis of stunting in Cerastoderma edule from the Burry inlet (South Wales). Palaeontology 15:61-72.
Goldreich, P. 1972. Tides and the earth-moon system. Scientific American 226(April):42-52.
Lamar, D. L., McGann-Lamar, J. V., and Merifield, P. M. 1970. Age and origin of earth-moon system. In S. K. Runcorn, ed. Palaeogeophysics, pp. 41-52. Academic Press, New York.
MacDonald, Gordon J. F. 1964. Tidal friction. Reviews of Geophysics 2:467-541.
Ma, Ting Ying H. 1937. On the growth rate of reef corals and its relation to sea water temperature. Palaeontologia Sinica, Series B, 16. 426 pp.
Ma, Ting Ying H. 1938. On the water temperature of the western Pacific during early and late Pleistocene as deduced from the growth rate of fossil corals. Geological Society of China Bulletin 18:349-418.
Mazzullo, S. J. 1971. Length of the year during the Silurian and Devonian periods: new values. Geological Society of America Bulletin 82:1085-1086.
Newton, Robert R. 1969. Secular accelerations of the earth and moon. Science 166:825-831.
Orton, J. H. 1923. On the significance of "rings" on the shells of Cardium and other molluscs. Nature 112:10.
Orton, J. H. 1926. On the rate of growth of Cardium edule. Part 1. Experimental observations. Journal of the Marine Biological Association United Kingdom 14:239-279.
Pannella, Giorgio. 1972. Paleontological evidence on the earth's rotational history since early Precambrian. Astrophysics and Space Science 16:212-237.
Rhoads, Donald C. and Pannella, G. 1970. The use of molluscan shell growth patterns in ecology and paleoecology. Lethaia 3:143-161.
Runcorn, S. K. 1964. Changes in the earth's moment of inertia. Nature 204:823-825.
Runcorn, S. K. 1970. Palaeontological measurements of the changes in the rotation rates of earth and moon and of the rate of retreat of the moon from the earth. In S. K. Runcorn, ed. Palaeogeophysics, pp. 17-23. Academic Press, New York.
Sakai, Seiichi. 1960. On the formation of the annual ring on the shell of the abalone, Haliotis discus var. hannai Ino. Tohoku Journal of Agricultural Research 11:239-244.
Scrutton, Colin T. and Hipkin, Roger G. 1973. Long-term changes in the rotation rate of the earth. Earth-Science Reviews 9:259-274.
Stevenson, J. A. and Dickie, L. M. 1954. Annual growth rings and rate of growth of the giant scallop Placopecten magellanicus (Gmelin) in the Digby area of the Bay of Fundy. Journal of Fisheries Research Board Canada 11:660-671.
Tevesz, Michael J. S. 1972. Implications of absolute age and season of death data compiled for recent Gemma gemma. Lethaia 5:31-38.
Wells, John W. 1963. Coral growth and geochronometry. Nature 197:948-950.
FRONT COVER. Cross-section through right and left valves of the clam Protothaca tenerrima. Notice similarities in growth-line patterns between the valves (38× nonpolarized negative). See article by Conrad D. Clausen for further details. BACK COVER. Higher magnification of part of front-cover picture (290× polarized positive). Groups of wide bands represent periods of rapid growth, while groups of narrow bands represent slow growth which probably reflect a fortnightly tidal cycle.