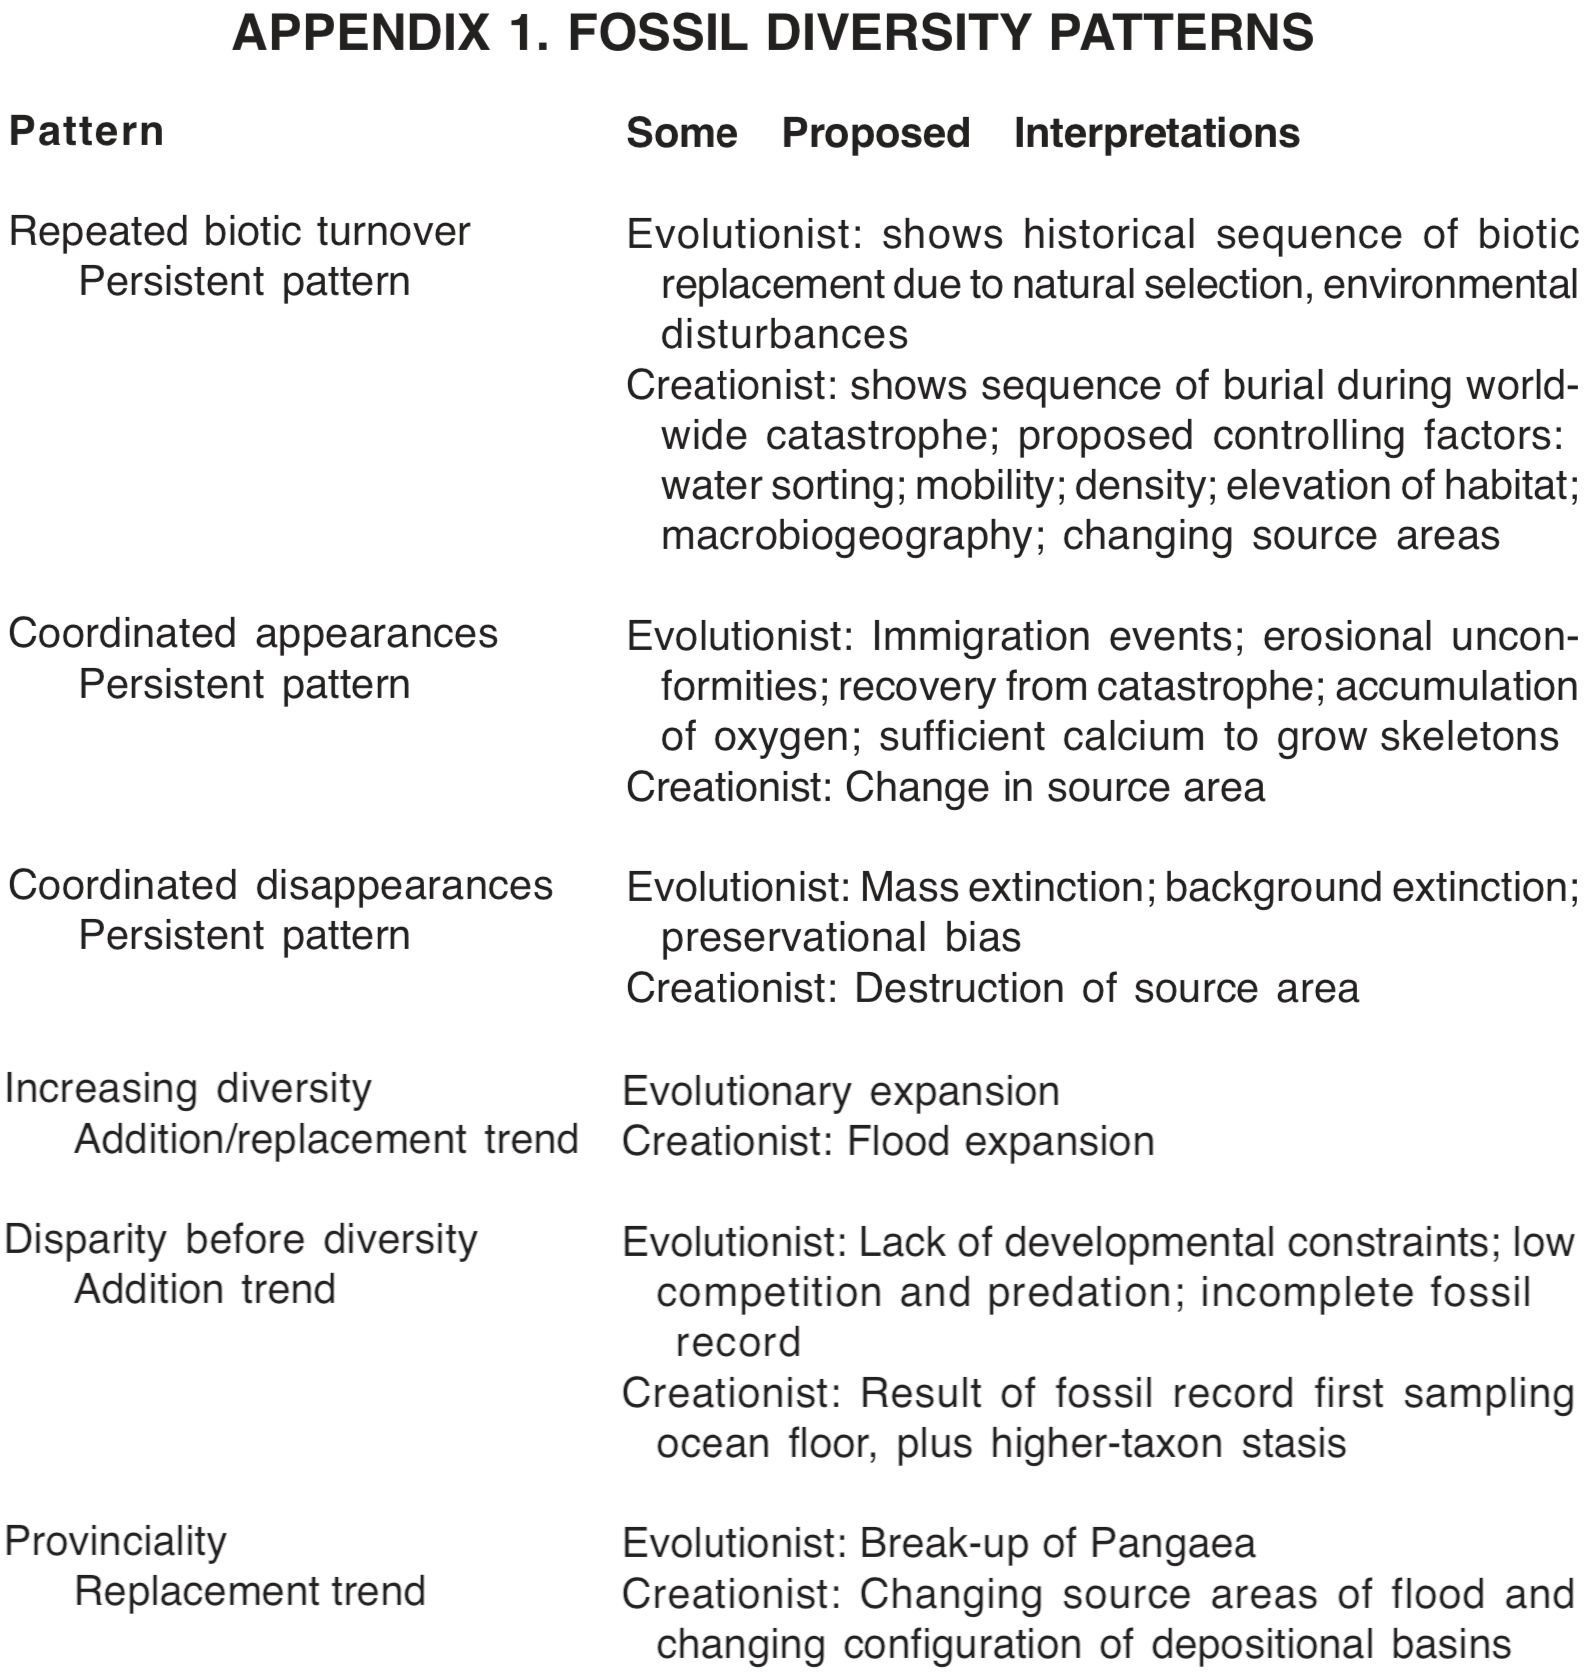
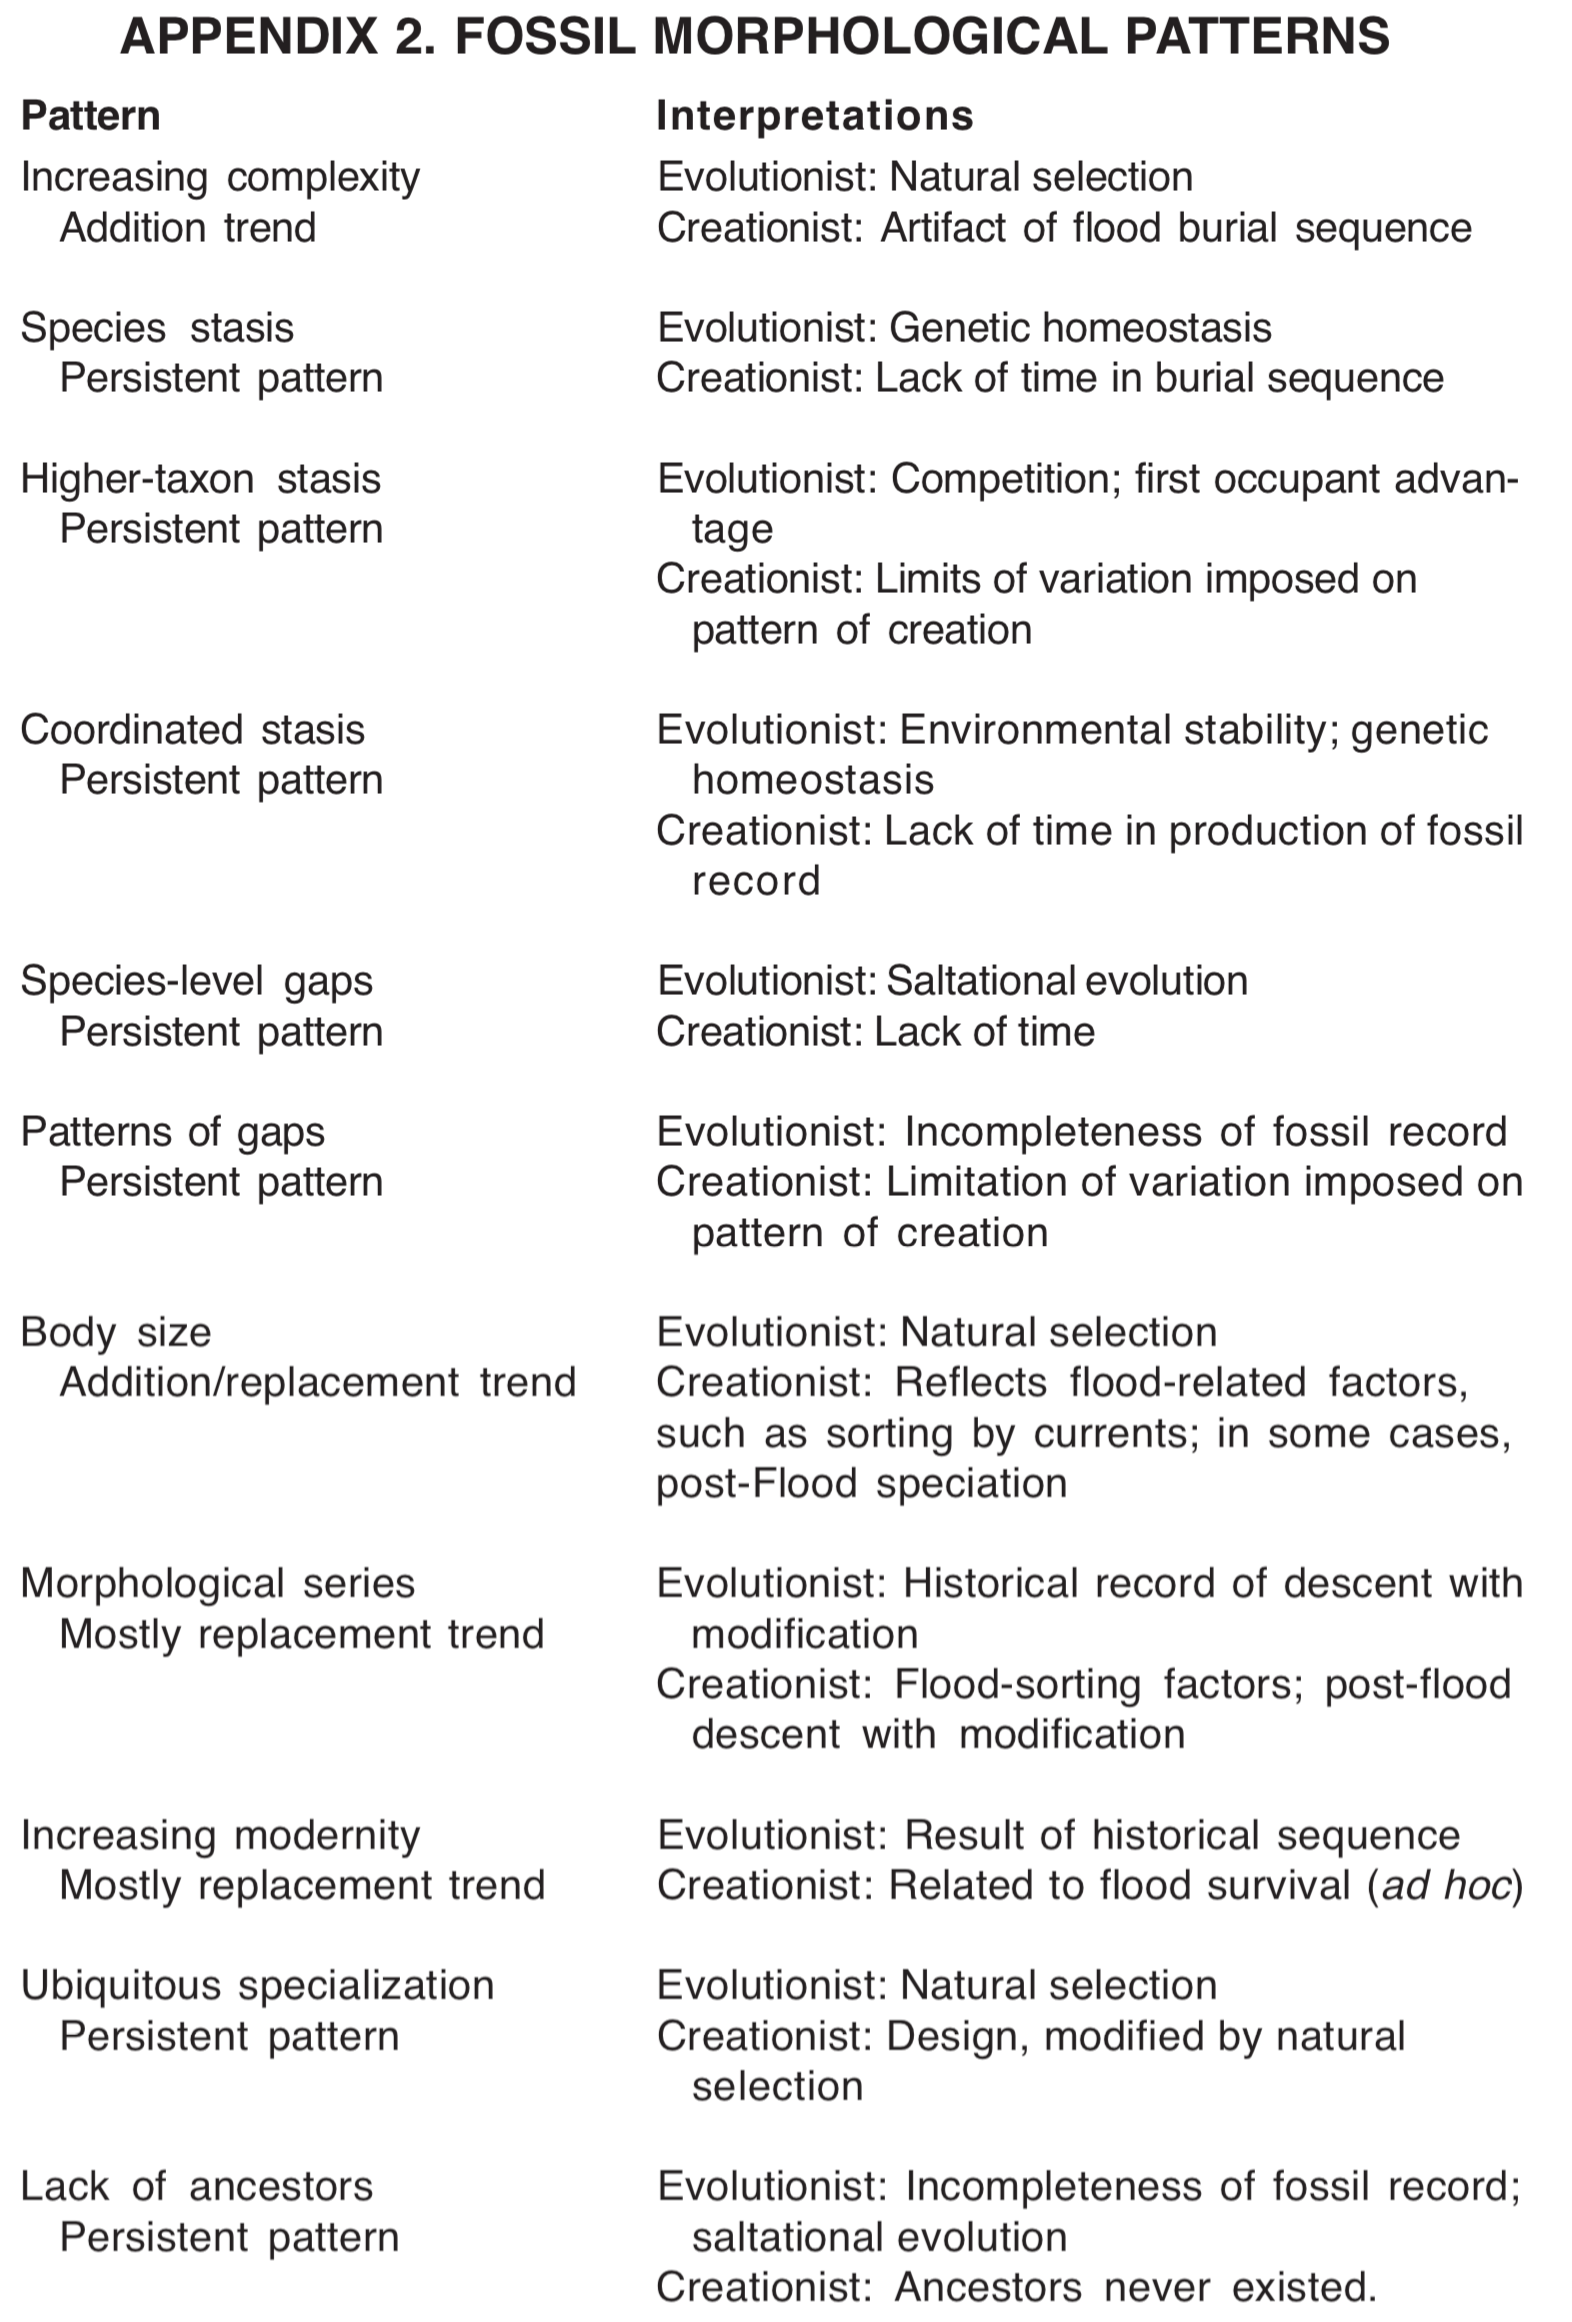
One of the most interesting challenges in understanding Earth history is explanation of the order in the fossil record. Identification and analysis of fossil patterns may provide one of the tools needed to reach a better understanding of the fossil record. Fossil patterns and fossil trends that extend through the fossil record imply that some processes acted throughout the production of that record. In this paper, 25 reported fossil patterns are classified into four categories: fossil diversity patterns; fossil morphological patterns; fossil ecological patterns; and depositional patterns. Possible creationist and evolutionary interpretations of these fossil patterns and trends are described. Some fossil patterns seem difficult to explain from a creationist viewpoint; others seem difficult to explain from an evolutionary viewpoint. Further research of fossil patterns and fossil trends may aid in our understanding of the processes that were responsible for producing the order in the fossil record.
Study of the fossil record has revealed much about the past. Our knowledge has been developed through the study of such features as anatomical structures, the degree of preservation, the types of fossils found together, and the nature of the surrounding sediments. With the accumulation of such data, it is natural that comparative studies would be undertaken to determine what patterns can be identified. Patterns in the fossil record may provide valuable clues to identifying processes active during production of the fossil record. This paper is intended to survey and classify the types of fossil patterns that have been reported in the literature, and to comment on their possible significance. Most of the fossil patterns reported here are from the Phanerozoic portion of the geologic column (see Figure 1), but some Precambrian patterns are included.
Figure 1. A greatly simplified outline of the biostratigraphic column.
Many general patterns in the fossil record have been reported. Fossil patterns that show a sustained directional change are here referred to as fossil trends. We may distinguish two types of fossil trends. [1] A replacement fossil trend exists when fossils with certain characteristics are replaced by fossils with different characteristics. An addition fossil trend occurs where fossils with certain characteristics are joined by fossils with different characteristics. Both types of trends are found in the fossil record. These different types of trends may have different causal explanations, so it is important to note which kind of trend is involved in any given pattern. All patterns are generalizations, and exceptions may occur.
Most fossil patterns can be placed in one of four categories. (1) Diversity patterns are those that relate to the frequencies of fossil taxa. (2) Morphological patterns are those that relate to morphological characteristics of fossil taxa. (3) Ecological patterns involve consideration of the types of habitats represented by the fossils, without concern for taxonomic group. (4) Depositional patterns are those that relate to the types of sediments in which fossils are preserved; for example, whether catastrophic burial conditions are indicated.
Hundreds of examples of fossil patterns have been reported, far greater than can be mentioned here. By grouping them in categories, it is possible to describe representative fossil patterns and attempt an evaluation of their significance (see Appendices 1-3).
MAJOR PATTERNS IN THE FOSSIL RECORD
Diversity Patterns
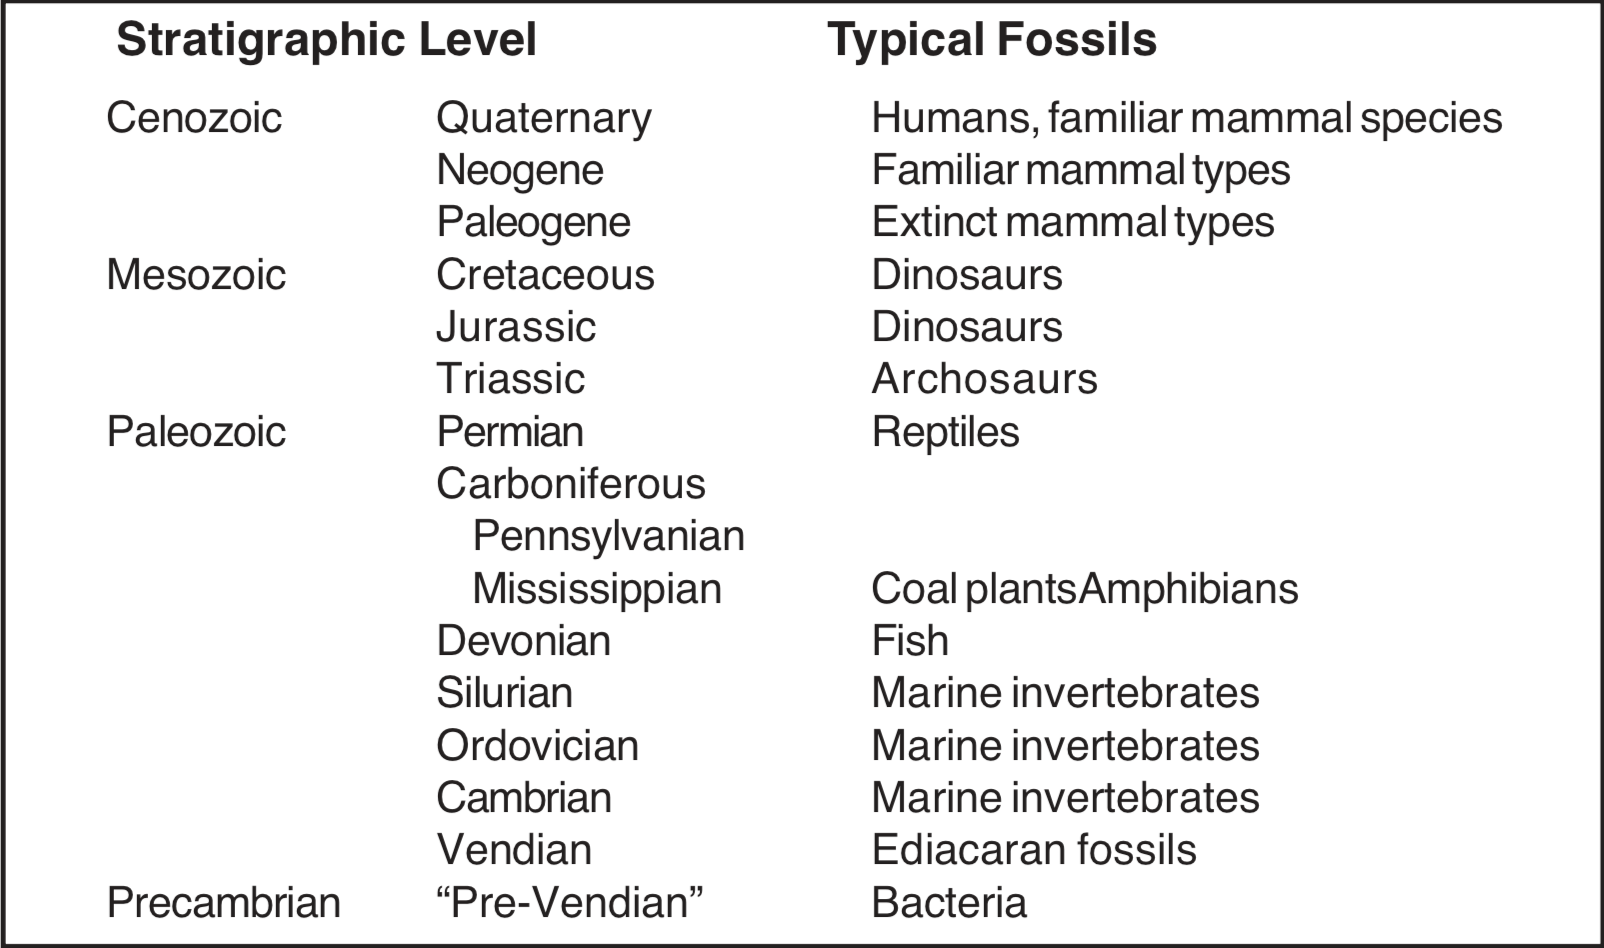
Repeated biotic turnover. Diversity patterns form some of the most conspicuous and significant features of the fossil record. One of the most important features of the fossil record is the separation of different types of fossils into different strata. [2] (This pattern does not show so well in the Precambrian strata. [3]) This separation of fossils into different layers is so consistent that scientists often use the fossils to assist in classifying the sediments. As an example, consider the extinct group of arthropods known as trilobites. Trilobites are found only in Paleozoic rocks. Certain types of trilobites occur only in Cambrian sediments, others occur only in Ordovician sediments, and some occur only in other layers. Likewise, dinosaurs are found only in Mesozoic rocks, with different types of dinosaurs in Triassic, Jurassic and Cretaceous layers. Biotic turnover is a replacement pattern, and contains two striking component patterns, discussed in the following two sections.
Scientists have noted how consistently the fossils are arranged in layers, and have arranged these layers in sequence, and compared them with layers from other regions. A kind of "master sequence" has been prepared. This master sequence of fossils is known as the biostratigraphic column (see Figure 1). Strata with Cenozoic fossils occur at the top of the column, with strata containing Mesozoic fossils beneath them, and rocks containing Paleozoic fossils beneath the Mesozoic strata. The Precambrian layers occur below the Paleozoic.
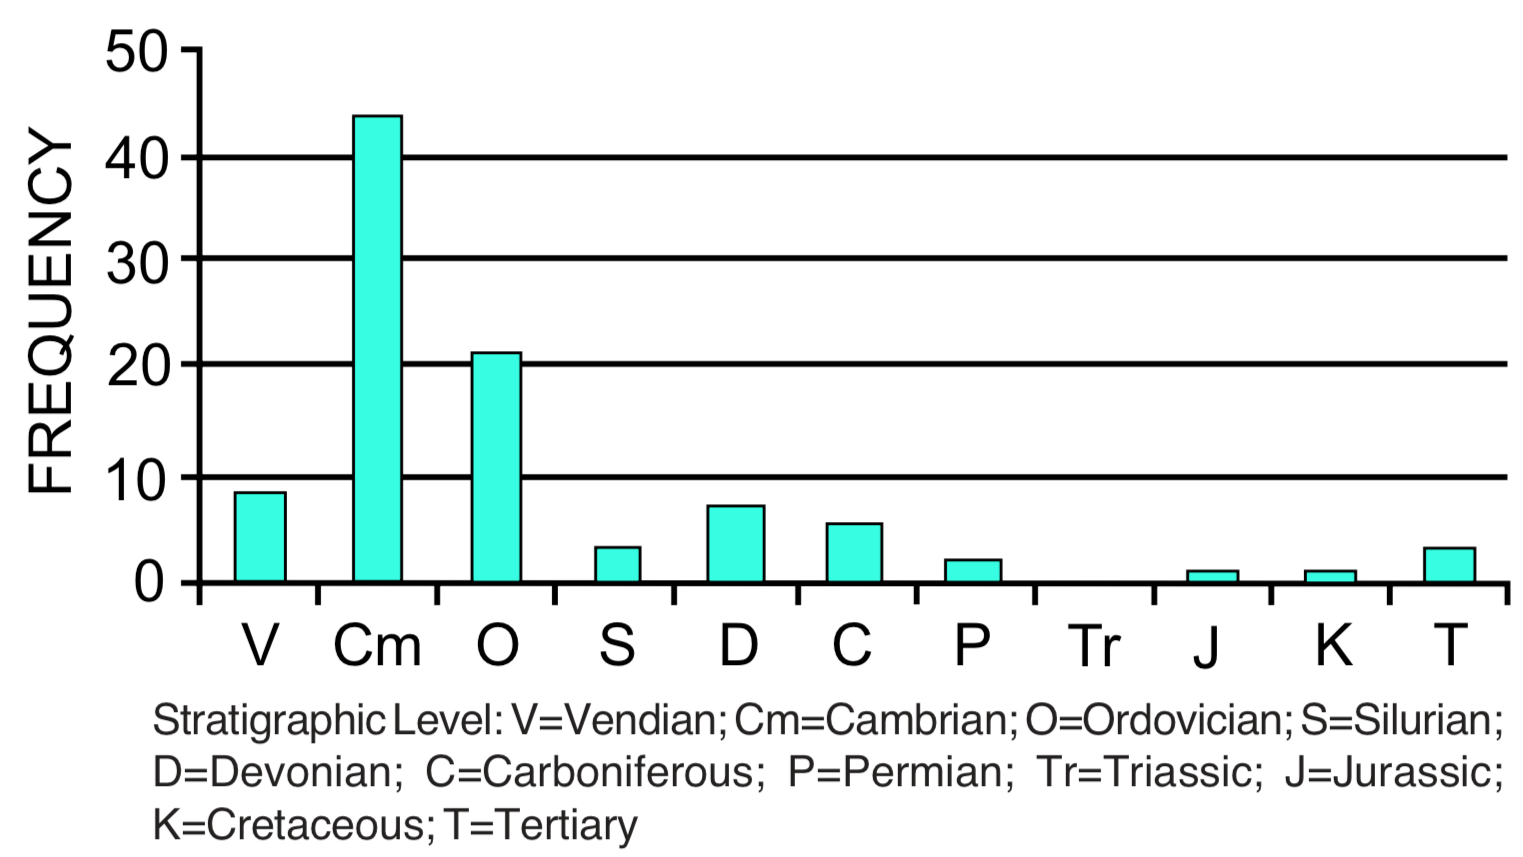
Coordinated appearances. A striking feature of the fossil record is the sudden appearance of numerous types of fossils in various locations over the Earth at about the same point in the geologic column. The most famous example occurs in the Cambrian rocks, which lie at the base of the Paleozoic rocks, [4] and is called the "Cambrian Explosion." Precambrian rocks contain relatively few fossils, most of which appear to be bacteria. There are a few strange fossil impressions below the Cambrian, known as Ediacaran fossils, that may represent multicellular organisms. But a large proportion of the major groups of invertebrates with hard skeletal parts are represented as fossils in the Cambrian strata (see Figure 2). Many phyla of soft-bodied animals are missing from the Cambrian record, but this is thought to reflect the incompleteness of the fossil record, not the absence of these phyla during deposition of Cambrian sediments. Many other examples of coordinated appearance occur, [5] but the Cambrian Explosion is by far the most spectacular example. Coordinated appearance is an addition pattern that persists throughout the fossil record. No trend has been reported for this pattern.
Figure 2. Frequencies of first appearances of classes of marine animal fossils. (Data from Erwin, Valentine and Sepkoski 1987; see Endnote 5.)
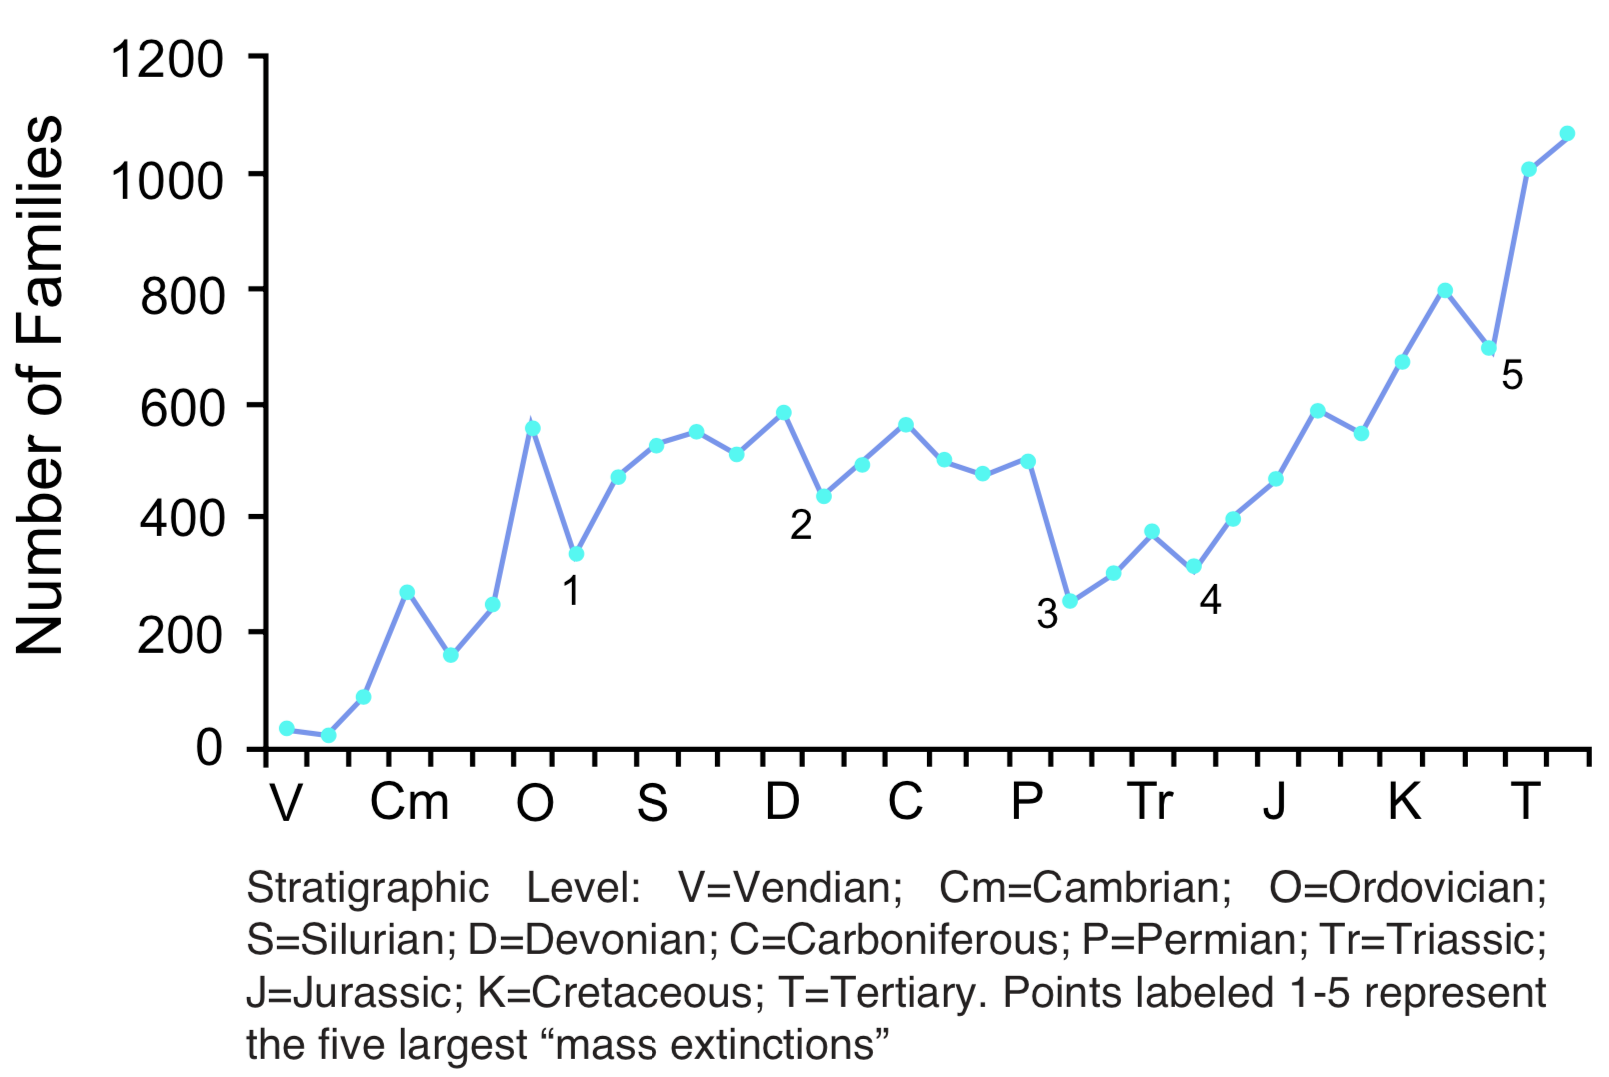
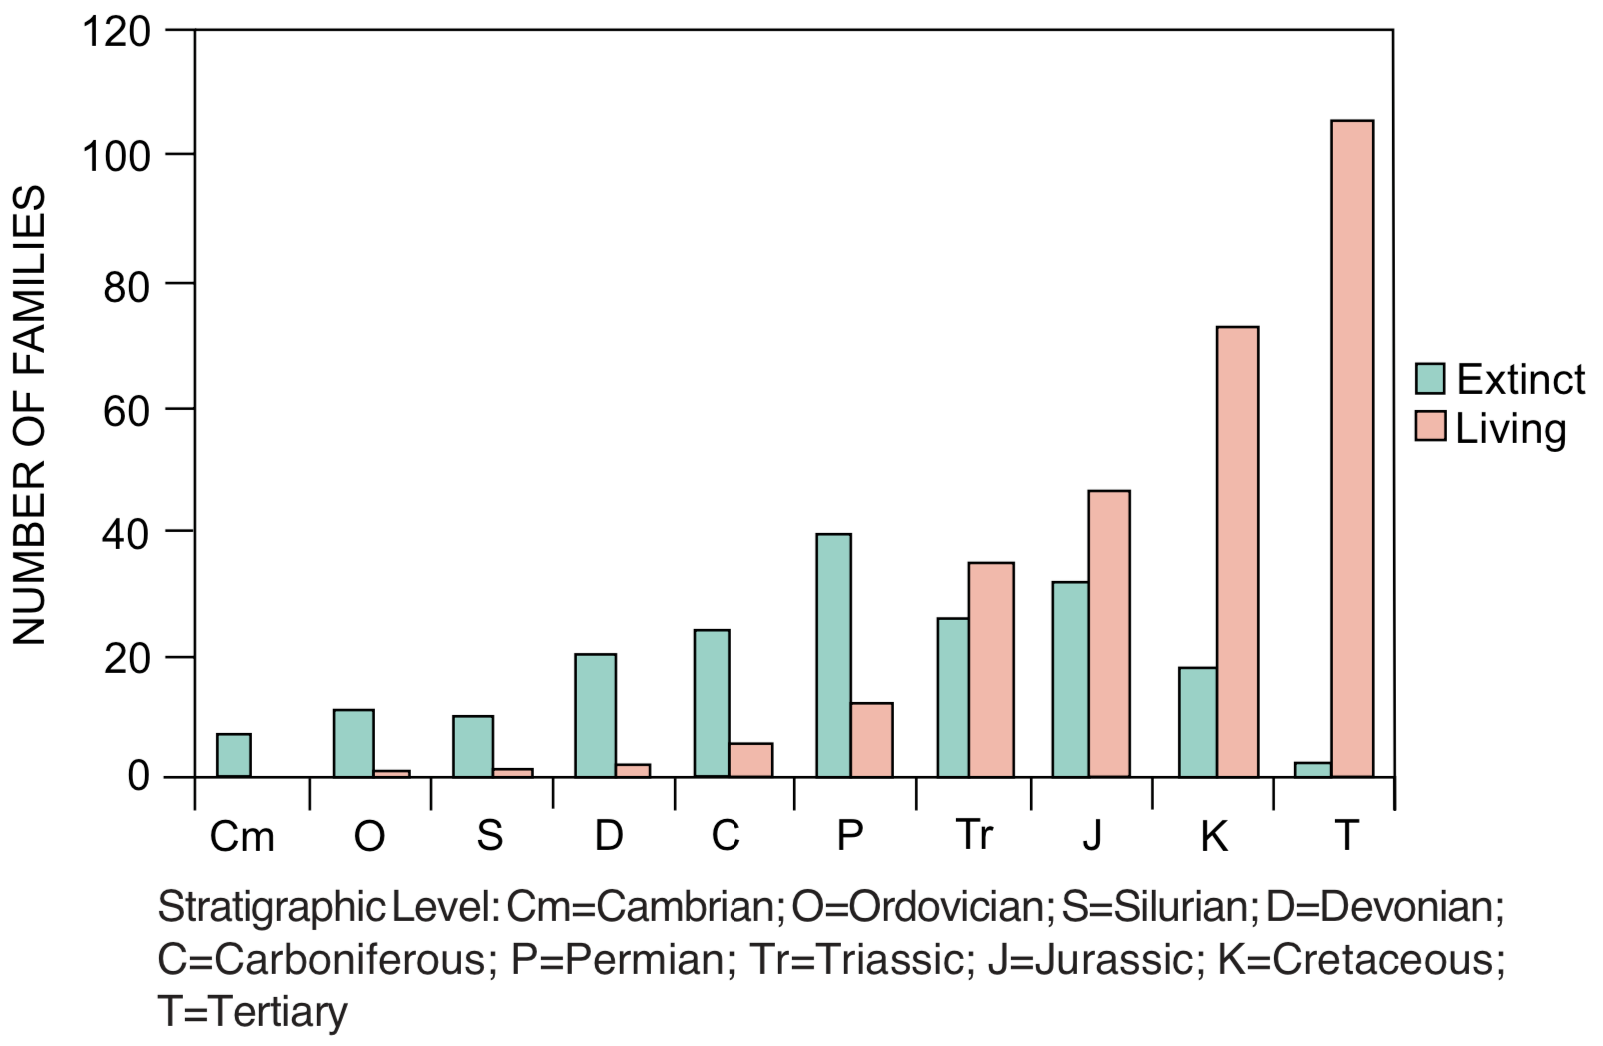
Coordinated disappearances. Large numbers of fossil species may disappear from the geologic record at a specific stratigraphic level (see Figure 3). The disappearance is never complete, but there are several examples where estimates indicate that more than 50% of the species disappear at the same stratigraphic level. [6] Boundaries between stratigraphic levels are often identified on the basis of coordinated disappearances. The greatest example of this is the disappearance of nearly half of the families (see Figure 3) and an estimated 95% of all species at the top of the Paleozoic. Dinosaurs and many other groups of reptiles and marine invertebrates disappear from the record at the top of the Mesozoic. Other examples of large-scale coordinated disappearances occur at the top of the Ordovician, near the top of the Devonian, and the top of the Triassic. Coordinated disappearance is a subtraction pattern. No sustained trends in this pattern have been reported.
Figure 3. Stratigraphic pattern of the number of families of marine invertebrates represented by the fossils in each stratigraphic level. (After Sepkoski 1993; see Endnote 6.)
Increasing diversity. The number of species generally increases as one moves upward through the fossil record. The increase is highly irregular, but the overall trend is clear. [7] For example, the number of species known from Cambrian rocks is approximately 8,000, increasing to 15,000 in the Carboniferous (upper Paleozoic). Total species diversity then drops, but increases to 22,000 in Cretaceous rocks, and to 43,000 in Cenozoic rocks. Similar trends toward increased diversity are observed for genera and families (see Figure 3), but not for phyla and classes (see next section). Diversity also often increases within a taxon; for example, the number of species or genera may increase within a family or higher category. Increasing diversity is a trend involving both addition and replacement, with addition dominating. A notable exception to this pattern is the increase and then decrease in microfossil diversity in Precambrian rocks. [8]
Disparity before diversity. Disparity refers to the extent of morphological divergence among members of a group, while diversity refers to the number of taxa within a group. Remarkably, the number of fossil species (diversity) in the Cambrian is low, but the number of phyla and classes (disparity) is high, compared to the numbers in other portions of the geologic column. In general, each phylum or class of Cambrian fossils contains only a few species, while these same groups may have larger numbers of species in strata above the Cambrian. The strata above the Cambrian contain larger numbers of species and families, but few additional phyla. Thus the Cambrian fossils are highly disparate, but the number of species (diversity) is relatively low. This pattern has been called "disparity before diversity" by Stephen Jay Gould. [9] There are other examples in the geologic column where disparity precedes diversity within certain groups, [10] but the Cambrian Explosion is the greatest example. This pattern has only a very weak directional component, and probably does not qualify as a fossil trend.
Provinciality. Provinciality refers to the distinction between fossil assemblages from different geographic regions. Provinciality is said to be high when each region has a distinctive fossil assemblage, and low when the number of distinct fossil assemblages is low. Stratigraphic patterns of provinciality generally require more data than are readily available. However, it has been reported that provinciality of terrestrial biotas tends to increase through the fossil record. [11]
Morphological Patterns
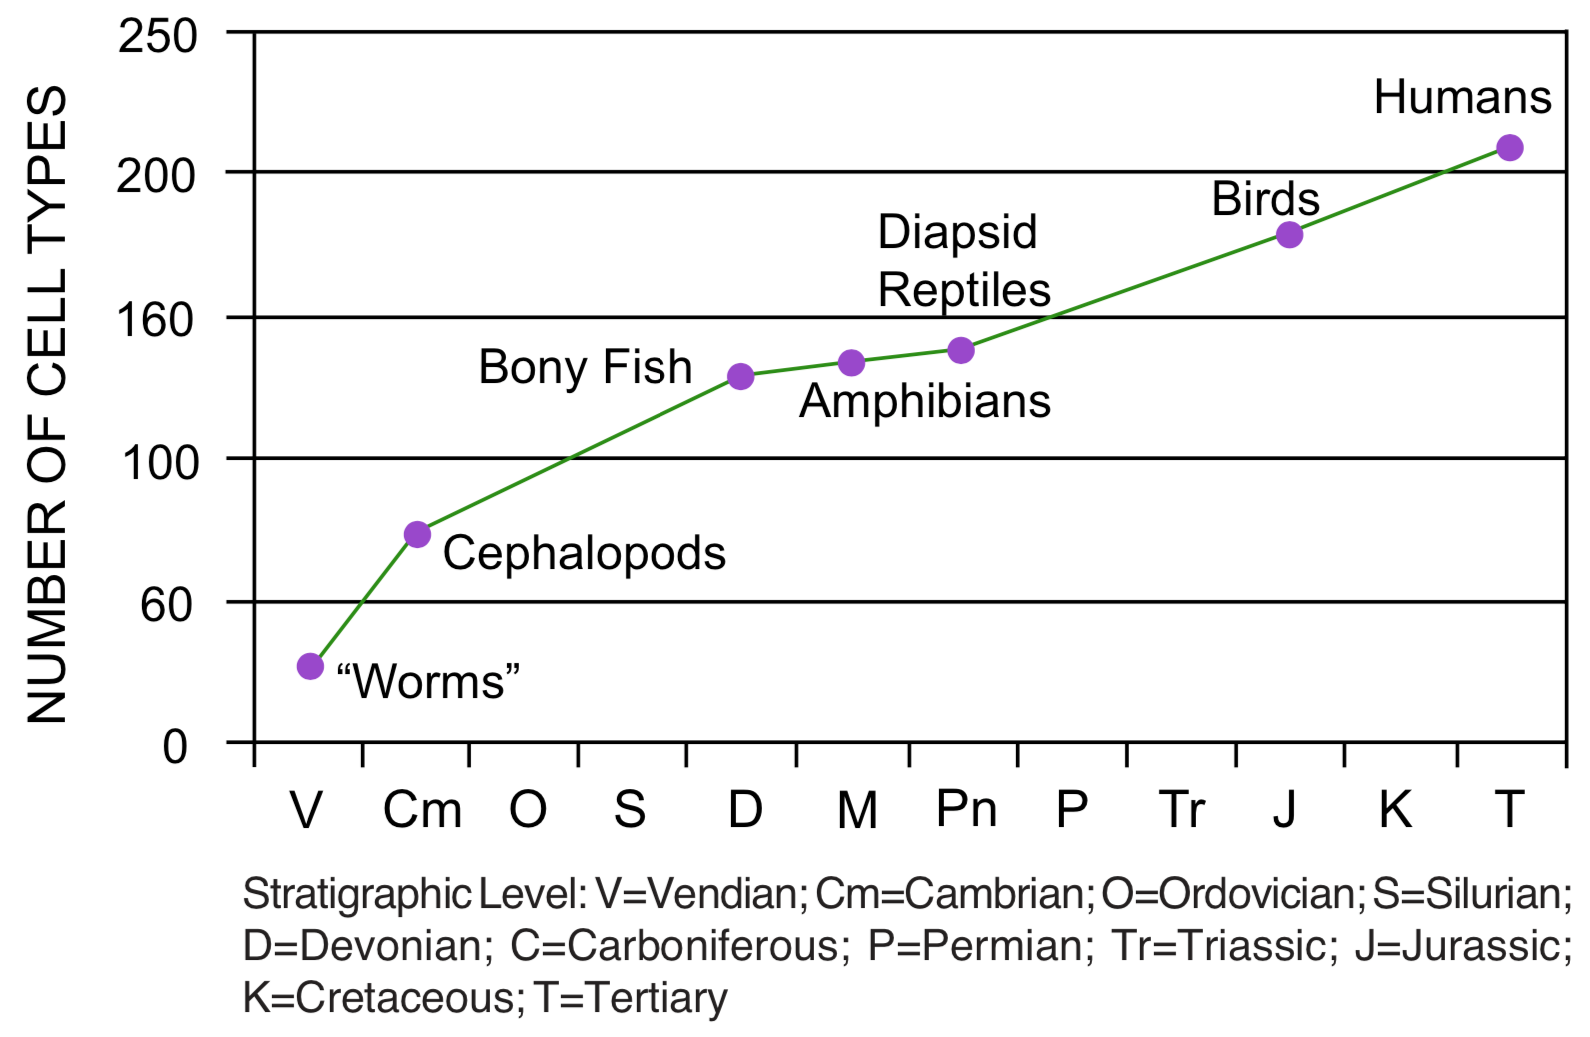
Increasing complexity. Morphological trends most closely related to the theory of common ancestry are of special significance to discussions of creation and evolution. One of the most widely reported trends is the increase in complexity, from bacteria in Precambrian rocks to humans in the Cenozoic strata. This is sometimes seen as the major theme in evolution from simple to complex. Complexity is a difficult concept to quantify, but the number of cell types has been used as an estimator of complexity. [12] However, the cell type data supporting this trend appear correlated with the vertebrate sequence (see Figure 4), and may be an accidental by-product of that sequence. The trend toward increasing complexity is actually an addition trend, not a replacement trend. There is no evidence that living bacteria are more complex than bacteria found in Precambrian rocks. [13] The trend toward increasing complexity is correlated with the trend toward increasing diversity. Certain groups considered to be more complex, particularly groups of vertebrates and plants, progressively appear in the geologic record in a sequence that corresponds with increasing complexity.
Figure 4. Stratigraphic increase in maximum number of cell types. (After Valentine 1994; see Endnote 12).
Morphological species-stasis. Morphological stasis is the persistence of morphology through portions of the geologic column. [14] Although there is some dispute over this pattern, it appears that most paleontologists accept the predominance of morphological stasis in species, A fossil species typically looks the same at the first and last appearances. Individual specimens may show minor variations around some average, but there is generally no directionality to morphological differences within a species. Numerous examples of directional change have been proposed, [15] but these are claimed to represent a minority of cases, and some have been reinterpreted by other studies. [16] The most extreme case of stasis is probably the cyanobacteria, which appear the same in Precambrian sediments and in modern living populations. [17]
Morphological higher-taxon stasis. Morphological stasis at higher taxonomic categories [18] refers to the persistence of body plans at taxonomic categories higher than species. For example, many invertebrate body plans at phylum and class levels persist through the entire Phanerozoic. This persistence does not produce a fossil trend, but continues throughout the fossil record. Higher-taxon stasis is related to the appearance of disparity before diversity, discussed above.
Coordinated stasis. Coordinated stasis refers to the observation that groups of species in a particular geologic formation, or portion of a formation, may remain essentially unchanged through sediments that are interpreted as representing millions of years of time. [19] Fossils exhibiting coordinated stasis may occur in sediments that are bounded above and below by horizons of high biotic turnover. Currently, this pattern is controversial, and more study is needed to test its significance. No direction has been reported for this pattern.
Morphological gaps among species. Fossil species are typically separated from each other by gaps in morphology. [20] This causes the abrupt appearance typical of fossil species. Of course, it should be remembered that fossil species are typically identified on the basis of morphology. It is the existence of morphological gaps that permits different fossil species to be distinguished. Two fossil species that grade into one another might be recognized as a single species with greater than average variability. Fossil species with higher than average variability are known, but this situation can also be found in some living species. In general terms, it appears that individual variation within fossil species is usually of the same magnitude as it is within living species. This pattern persists throughout the fossil record, without any directional tendency.
Morphological gaps form a nested hierarchical pattern. Morphologies of fossils generally can be arranged to form a hierarchically nested pattern, forming the basis of the present system of taxonomic categories. A group of species separated by small morphological gaps comprises a genus. Genera are separated by larger morphological gaps. The gaps are of increasing size as one considers higher taxonomic categories such as families, orders and classes. [21] New fossil discoveries sometimes reduce the size of the gaps, especially at lower taxonomic levels, [22] but the gaps at higher taxonomic levels are strikingly distinct. This pattern does not seem to result in any directional trend through the fossil record. Occasional exceptions to this pattern occur in the form of "morphological mosaics" species with a mixture of characteristics from two or more otherwise morphologically distinct groups. Such species may indicate the artificial nature of our taxonomic system.
Changes in body size. Body size often shows a directional trend for species within a group. [23] Trends toward increasing size are better known, but trends toward decreasing size are also reported. Most trends among tetrapods (amphibians, reptiles, birds and mammals) involve size. [24] Trends in body size may be addition trends or replacement trends. Trends in body size are stratigraphically limited they typically extend through only one or a few stratigraphic divisions.
Morphological series. Fossil species can often be arranged in a morphological series in which the directionality of morphological change is consistent with the stratigraphic sequence of the fossils. [25] The most famous example of this is the horse series, which begins with a 5-toed species (which may or may not be a horse) in the Eocene (lower Tertiary), progresses to a group of 3-toed species in the Oligocene and Miocene (middle Tertiary), and ends with living one-toed horses. This trend is accompanied by a trend toward increasing body size. [26] Another morphological series is the increasing mammal-like characteristics in the synapsid reptiles of the upper Paleozoic and lower Mesozoic rocks. [27] Other examples include the series from dinosaurs to birds, [28] from land mammals to whales, [29] and among groups of invertebrates. [30] Morphological series are primarily replacement trends, but also more may be some addition.
Increasing modernity. Most fossils are of extinct species, but some are more similar to living species than are others. Fossils from higher in the stratigraphic column resemble living species more than do the fossils from lower in the column. [31] For example, Cenozoic mollusks are rather similar to living species, while Mesozoic mollusks are less similar, and Paleozoic mollusks are quite different from those living today (Figure 5). This trend is seen also among the vertebrates. Paleozoic fish are mostly strange-looking fish, unlike any living today. Mesozoic fish are more similar to living fish, and Cenozoic fish look quite similar to living kinds of fish. This replacement trend is well known and applies to nearly all groups of organisms except the bacteria, which seem to have changed very little. [32]
Ubiquitous specialization. Specialization of a species means that the species has morphological structures that appear appropriate for specific habitats or ecological roles. Virtually all fossil species are specialized in some way. This is illustrated by the arthropods of the Cambrian Explosion, as pointed out by Gould. [33] Species lacking notable specialization are said to be generalized. Most species have some features that are relatively generalized, while other features may be highly specialized. This is a general pattern in the fossil record, and does not form a directional trend.
Figure 5. Comparison of numbers of extinct and living bivalve families. (Data compiled by Leonard Brand from Benton 1993; see Endnote 2).
Lack of identifiable ancestors. The fossil record contains more than two hundred thousand species. Finding relationships among these species is problematic. [34] Higher taxa are often referred to as ancestral to other higher taxa, but evolutionists acknowledge that higher taxa cannot be actual ancestors of anything, since they are taxonomic constructs rather than real entities. Groups of species with successively smaller morphological differences can be identified, and genealogical relationships can be proposed. However, it is remarkably difficult to identify one fossil species as directly ancestral to another. The difficulty is compounded as the taxonomic category under discussion increases. One of the chief reasons for the difficulty is that nearly all species have some specialization that is thought to preclude them from the direct ancestry of any other known species. No directionality for this pattern has been reported.
Ecological Patterns
Increasing habitat diversity. The number of habitats represented increases as one moves upward through the geologic column. [35] Precambrian rocks are dominated by fossils of bacteria. Cambrian rocks have only marine fossils, mostly of species that lived on hard substrates on the sea floor. Fossils of freshwater species first appear in numbers in the Silurian (mid-Paleozoic), although there are some possible freshwater species in lower deposits. Fully terrestrial species are reported from Silurian rocks, but are better represented in Devonian rocks. Mesozoic rocks contain fossils from a greater diversity of habitats, and Cenozoic rocks continue the trend toward greater diversity of habitats represented. This principle extends as well to ecology at a smaller scale. Twenty ecological guilds have been identified in the marine realm. [36] Nine of these are present in the Cambrian, 14 are present in the Paleozoic as a whole, and 20 are present in Cenozoic fossils. This is another example of trend by addition, in this case an "ecological expansion."
Increasing terrestriality. Some trends toward increasing terrestriality in the fossil record have been reported. Fossils from the lowest Paleozoic strata are all of marine creatures that apparently lived on or close to the sea floor. [37] In the middle Paleozoic, one finds not only sea creatures, but also many fossils of species that apparently lived in swamps or perhaps along the margins of the seas or rivers. In the upper Paleozoic, one finds fully terrestrial species. Mesozoic and Cenozoic fossils include representatives from all the preceding ecological habitats. The clearest examples of this trend are given by the sequence of first appearances of groups of plants [38] and vertebrates. [39] The lowest vertebrates in the geologic column are fish, which require water. The next ecological type to appear are the amphibians, which live along water margins. Higher in the column, they are joined by the reptiles, which can live away from water. Mammals and birds are the last classes of vertebrates to appear as fossils. Increasing terrestriality is not a strong trend, because exceptions occur. The most notable exception may be the dominance of (probably) photosynthetic bacteria in the Precambrian, although there have been suggestions these could have been subsurface contaminants. [40] It is important to note that this trend is not a replacement trend, but an addition trend, because all these habitats are still occupied.
Increasing mobility. A possible trend toward increasing mobility has been reported among marine invertebrates. [41] Paleozoic fossils are said to be dominated by species living on or near the sea bottom and with limited mobility. Mesozoic and Cenozoic marine fossils tend to include more mobile types. On land, there may be a similar effect produced by trends toward increasing size, such as seems to be the case among some of the dinosaurs and mammals. [42] It is not certain how common this trend is. If the trend is valid, it would be another trend by addition.
Patterns in Depositional Environments
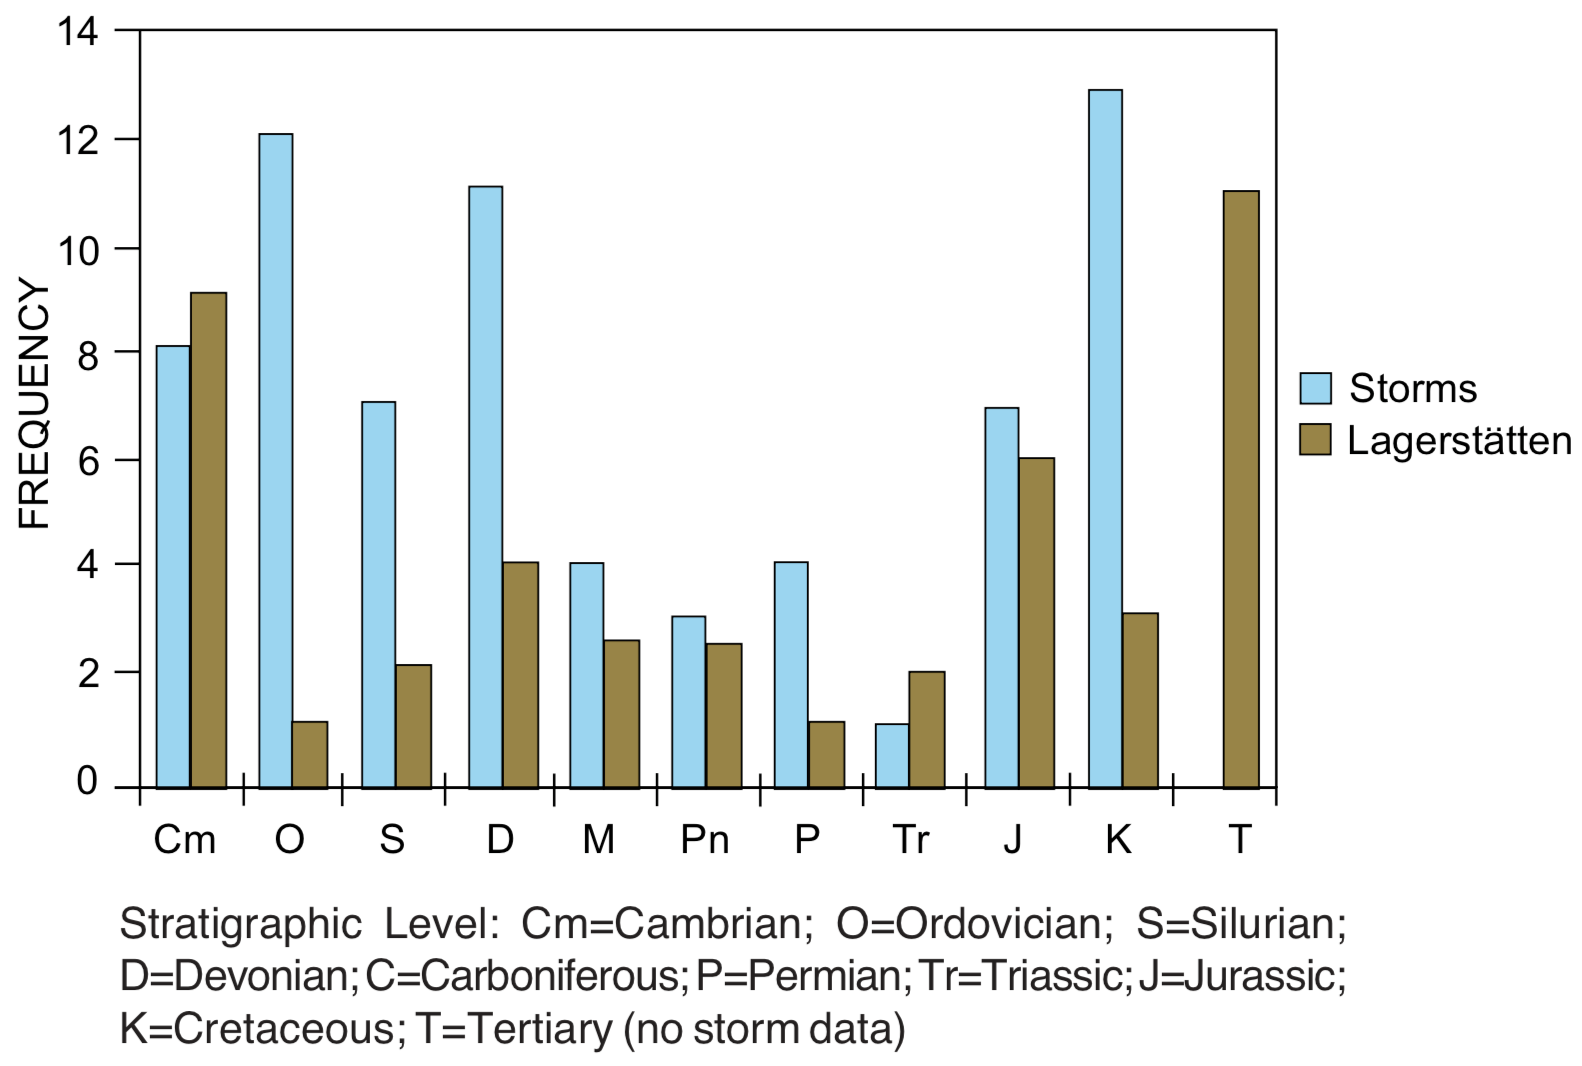
Storm deposits. Information about patterns in depositional environments is not as readily available as for the other patterns included in this study, but some work is being done in this area. [43] For example, storm deposits are reported to occur most frequently in Ordovician, Silurian, Devonian, Jurassic, and Cretaceous rocks (see Figure 6). Deposits interpreted as hurricanes are most frequent in Ordovician and Devonian, while inferred winter storms are most common in Silurian and Cretaceous rocks.
Well-preserved soft-bodied faunas. Most fossils are remains of hard-bodied organisms, especially mollusks, echinoderms, arthropods, vertebrates and plants. However, some areas (called "lagerstätten") are known for the exceptional preservation of soft-bodied fauna, including worms, etc. [44] Such exceptional faunas are scattered through the geologic column, but may be overrepresented in Cambrian and Jurassic rocks (see Figure 6).
Figure 6. Stratigraphic distribution of storm deposits and lagerstätten. (Data from Marsaglia and Klein 1983, and Allison and Briggs 1993; see Endnotes 43 and 44.)
Depositional energy for first appearances. Sediments can be identified as high or low energy based on the sizes of the particles. Large particles require more energy for their transport and deposition than do small particles. Low-energy deposits, such as marine shales, are often associated with deep water deposition, while higher energy deposits, such as marine sandstones, may be interpreted as near shore deposits. It has been observed that most higher taxa of marine invertebrates have first appearances in high energy deposits, while last appearances tend to be in low energy deposits. [45] This trend is typically called the onshore-offshore hypothesis.
Depositional environments. Certain types of sedimentary deposits show patterns or trends in frequency in the geologic column. For example, 85% of inferred lake deposits occur in Cenozoic rocks, 11% in Mesozoic rocks and only 4% in Paleozoic rocks. [46] On the other hand, limestone comprises a larger proportion of Paleozoic and Mesozoic rock, with lower proportions in Cenozoic rocks. [47]
Preservational modes. This is an area that has not received sufficient study. Some published reports indicate stratigraphic differences in modes of preservation. [48] For example, silicification is reportedly more common among Paleozoic fossils than among Mesozoic or Cenozoic fossils. More information is needed regarding this type of pattern.
A NOTE ON GEOGRAPHIC PATTERNS
Several patterns that reflect geographic variation within a stratigraphical division have been observed in the fossil record. [49] Geographic trends include diversity gradients and variation in length of stratigraphic range. Latitude is a well-known factor affecting geographical trends. Geographical patterns are beyond the scope of this paper, unless they are compared through the stratigraphic column.
PROBLEMS IN INTERPRETING FOSSIL PATTERNS AND TRENDS
It may be quite difficult to determine a cause behind a fossil trend. In fact, apparent trends may occur in random data. [50] Trends may also be "hitchhikers" that are merely the result of a trend in some other feature. [51] For example, many "trends" in morphological characters are correlated with trends in body size or ecology. [52] These cautions should be kept in mind when interpreting fossil trends.
EXPLAINING THE FEATURES OF THE FOSSIL RECORD AS THE RESULT OF EVOLUTION
Most scientists interpret the fossil record to be a record of evolutionary history. [53] They explain the segregation of fossils into various strata as the result of changes occurring over long periods of time. Different kinds of organisms lived at different times, and were fossilized as the layers were deposited in sequence. The species that occur in the lower rocks are thought to be the evolutionary ancestors of those higher in the stratigraphic column. As one moves upward through the geologic column, one is moving closer to the present time. Thus one should expect to find that fossils in the upper strata would look familiar, because they are more closely related to living species. Fossils in the lower strata are only distantly related to living species, or from groups that no longer exist. They can be expected to look different from anything now living. Species with strange combinations of traits may represent the kinds of transitional stages that occurred as new kinds of species evolved from older kinds. The ecological expansion seen in the geologic column reflects the fact that life began in the sea. Living organisms were not able to live on land until they had evolved the necessary structures to survive out of the water. Evolutionists believe that the evolutionary theory provides a good explanation for the main features of the fossil record, including biotic turnover, increasing modernity, morphological series, and ecological expansion.
Several features of the fossil record are at least consistent with evolutionary theory. Increasing diversity would be expected if a single common ancestor diversified and produced increasingly diverse and disparate descendents. Evolution of adaptations for terrestriality would require time, during which a trend toward increasing terrestriality might be expected. Increasing complexity and mobility might result from continuing competition and expanding ecological occupation. Body size trends might also result from increasing levels of competition. [54] Increasing competition might also drive older marine groups from onshore to offshore habitats as new onshore groups evolved. Increasing provinciality is expected as a single land mass, Pangaea, broke apart and formed separate, increasingly isolated regions.
However, there are some other considerations. The evolutionary theory does not provide such a good explanation for the "Cambrian Explosion." One would not expect evolution to produce a sudden increase in disparity, especially when one considers the great differences among the groups of Cambrian fossils. The lack of Precambrian ancestors for the Cambrian groups is another point not easily explained by evolutionary theory, although many hypotheses have been proposed. [55] Coordinated stasis, if valid, seems highly anomalous for evolutionary theory. Coordinated disappearance, commonly called "mass extinction," seems difficult to explain without a major global catastrophe. Trends in depositional environments also seem to suggest successive links in an overall process, rather than a stochastic sequence of unrelated events.
Neither does evolution provide a very good explanation for the pattern of morphological gaps separating the different higher taxa of fossils. The standard explanation is that the fossil record is incomplete. The gaps between fossil taxa represent extinct species that really lived, but have not been discovered as fossils. These missing fossils have been called "missing links." The fossil record surely is incomplete, but does this really explain the pattern of the fossils? [56] The sheep and the cow are fairly similar morphologically. The chances of finding more species like them would seem unlikely if the fossil record is highly incomplete. But a sheep and a monkey are much different. There should be many fossil species showing the evolutionary stages between a sheep and a monkey. But the opposite is true. There are many kinds of fossils that are similar to sheep and cattle, respectively, but fossils that are intermediate between sheep and monkeys are virtually absent. If we take the fossil record at face value, these supposed intermediate stages may never have existed. An incomplete fossil record might explain the gaps between closely similar species, but not the pattern of gaps among higher categories. Ubiquitous specialization and lack of identifiable ancestors also seem difficult for evolutionary theory to explain.
Even morphological series may be problematic for evolutionary theory. Observed morphological effects due to natural selection occur much more rapidly than changes typically seen in fossil series. [57] What kind of selective force could persist for millions of years, continuously driving morphological change in such tiny increments? Evolutionary theory does not provide a good explanation for the Cambrian explosion, coordinated stasis, the general lack of identifiable ancestors, or the systematic gaps among species and groups of species. Trends in depositional environments also seem poorly explained by evolutionary theory. There is reasonable empirical basis to look for another theory to explain the fossil record.
EXPLAINING THE FEATURES OF THE FOSSIL RECORD IN THE CONTEXT OF SCRIPTURE
Several scientists have attempted to develop creationist interpretations of the fossil record, [58] with mixed success. Many of the explanations are ad hoc, and more work is badly needed. Nevertheless, a good start has been made, and further progress can be expected. Ideas from many sources have been incorporated into the discussion below.
Some features of the fossil record are readily explained from a creationist viewpoint. The "Cambrian Explosion" may be readily explained as the result of the burial of the sea floor in the early stages of the biblical flood. [59] The Cambrian fossils are not related to each other genealogically. Instead, they are related ecologically. They are all creatures of the sea floor. Other examples of "coordinated appearances" may result from flood encroachment on new biozones. [60] The combination of "Cambrian Explosion" and "higher-taxon stasis" would produce the pattern of "disparity before diversity."
As new communities were encountered by rising flood water, new groups of species would be added to the fossil record. The new groups of species would show only normal intra-specific variation, producing a record of "coordinated stasis." "Coordinated disappearances" would occur when a particular source area was exhausted, or due to some critical change in flood conditions. [61] The global nature of many coordinated disappearances indicates a global process. Such an "expanding flood" would naturally produce an increase in diversity through the fossil record.
The theory of special creation can also explain the morphological gaps separating the fossils into different groups. Major morphological gaps distinguish different groups that were separately created, producing "higher-taxon stasis." [62] Higher-taxon morphological stasis might reflect the inability of originally created kinds to vary naturally beyond certain limits determined by their genetic makeups. Special creation also explains the lack of identifiable ancestors in the fossil record, as well as the specialization seen in virtually all forms of life.
Morphological closely similar fossil species may represent differences that accumulated in isolated populations after the creation. Species-level morphological stasis and the noted shortage of transitional fossils at low taxonomic levels may be the result of catastrophic preservation; it is not necessary to suppose that intermediates between similar species and genera never existed, or that species are as stable as suggested by the fossil record. [63] On the other hand, interspecific morphological series might represent hydrodynamic sorting [64] or pre-Flood geographical clines such as are well-known in the present ecology. [65] In the case of species with life-spans of a few weeks or less, a trend might reflect an actual series of speciation events. [66] These factors might also account for some of the many reported examples of trends in body size.
The ecological component in the geological column also seems consistent with creationist theories, although the details are not well understood. It could be the result of the expanding activity of the Flood. As the Flood began, sediment would be transported to the lowest elevations first. The sea floor would probably be the first to be covered, burying the organisms that lived there. [67] As the waters rose, additional groups of organisms would be added. Eventually, upland habitats would be flooded, and upland species added to the stack of fossil layers, producing the trend toward increasing terrestriality. Mobility might also be an important factor. [68] This process might also account for the sequence of first appearances of vertebrate classes, upon which the pattern of increasing complexity depends (see Figure 4).
In reality, the process of producing the fossil record was much more complex than simple ecological differences. Additional marine groups are found throughout the geologic column, which suggests the existence of continental seas at different elevations and in different geographic regions. [69] In addition, fossils from Precambrian rocks are dominated by apparently photosynthetic [70] bacteria, which must have somehow gotten into the rocks, perhaps very early in the Flood [71] or pre-Flood, [72] or as contaminants, [73] or perhaps accidentally trapped in some underground system involved in the pre-Flood water cycle.
Trends in patterns of deposition may reflect the advancing stages of the Flood. The reported possibly nonrandom distribution of storm deposits and lagerstätten may indicate a non-uniform process responsible for the fossil record. A worldwide flood might provide an explanation for this; if so, the details remain to be worked out. Depositional trends such as decreasing limestone deposition and increasing lake deposits seem plausible results of a worldwide flood. First appearances of major taxa in deposits interpreted as onshore deposits may be the result of interpreting high energy deposits as onshore. Perhaps high energy deposits are more likely than low-energy deposits to capture and preserve previously unrecorded types of fossils. The reported decrease in silicification of fossils through the Phanerozoic may indicate important changes in ocean chemistry, perhaps associated with changes in volcanic activity. The existence of so many fossils and their spectacular preservation [74] indicate special circumstances that are rare in today's world. Evidence for rapid burial, widespread geologic activity, and chemical activity of highly mineralized water are expected effects of a worldwide flood.
However, there are some features of the geologic column that creationists have more difficulty explaining. The consistent manner in which the fossils are segregated in the geologic column is one of those features. One would think that a worldwide flood would produce extensive mixing of various types of fossils. Perhaps the pre-Flood world was highly structured, both ecologically and taxonomically. Thus, as the Flood waters rose vertically and expanded geographically, different habitats were engulfed, and different taxonomic groups were successively deposited as fossils. This would result in noticeable differences in the kinds of fossils encountered as one compares different strata in the geologic column.
Another difficult trend to explain is the increasing similarity to modern forms as one views the fossil column from bottom to top. This fossil trend might be a result of the high degree of structure postulated for the pre-Flood world. Those habitats closest to the bottom were the first to be buried, and suffered the greatest extent of extinction. The last groups of organisms to be engulfed by the Flood would have the best chance of survival. [75] The result would be that the bottom layers would have fossils of species that are unfamiliar to us now, while the uppermost strata would have many fossils of familiar kinds of organisms.
The observed pattern also applies to terrestrial vertebrates, thought to be preserved only in the ark. It is not clear why terrestrial vertebrates show the same pattern as marine invertebrates. One suggested explanation for this [76] is that upland species were better adapted for the cooler (and probably harsher) post-Flood climates. Another suggestion [77] is that survival of the species preserved on the ark depended on the survival of species not on the ark, and those species whose food supply was destroyed could not survive.
Certain morphological series are also difficult to explain. The synapsid reptiles are an example. Increasing mammal-like traits are seen in synapsid fossils through the Permian and Triassic. A creationist might seek to discover whether there is some other associated trend, such as one relating to ecology, [78] behavior or distribution, that is responsible for the morphological series. It is significant that no series of actual ancestors and descendants can be identified among the synapsid reptile fossils only a general trend toward increasing mammal-like characteristics. Although creationists have pointed out the difficulties of interpreting this series as an evolutionary sequence, they have not developed a detailed alternative explanation. It has been suggested that the synapsid reptiles reflect a richer pre-Flood diversity, [79] and that the trend toward increasing mammalian characters might be a side-effect of an ecological pattern. [80]
A final difficulty is the increasing provinciality in Mesozoic and Cenozoic terrestrial faunas. One would expect increasing provinciality post-Flood, but it is not so clear why provinciality would increase in sediments thought to be deposited during the flood. Provinciality is low in the lower Mesozoic, then increases in the upper Mesozoic, with still further increases in the lower Cenozoic. This pattern could be partly an artifact of incomplete sampling of the fossil record, or perhaps it is a reflection of pre-Flood biogeographical differences, such as between the northern and southern hemispheres. It could also be taken to indicate that the Cenozoic is a record of post-Flood repopulation, [81] but there are reasons for restricting the post-Flood repopulation to the upper Cenozoic. [82] Either interpretation involves unsolved problems.
DISCUSSION
Those who have hoped fossil patterns and trends would reveal a straightforward story of Earth history have met disappointment. Some features of the fossil record seem to suggest one view, while other features seem to suggest another. Persons with differing views of Earth history can point to selected features of the fossil record to support their views. Regardless of the viewpoint, our understanding is incomplete. The challenge to creationists is to explain fossil trends as the result of the way in which the Flood eroded and buried the biota of various habitats. The creationist viewpoint considers ecological and depositional trends to be primary. Diversity trends and morphological series are considered to be secondary consequences of the primary trends.
From this viewpoint, ecological fossil trends are interpreted to reflect the expansion of Flood activity as additional habitats and additional geographic regions were swept away. This implies segregation of habitats in a highly structured pre-Flood ecology. The observed ecological fossil trends are trends by addition, not by replacement (see Appendix 3). Since relatively dense and immobile marine invertebrates are found in upper layers as well as in lower layers, there must have been additional source areas available for destruction at different stages in the Flood. This is why pre-Flood marine habitats are postulated to have occurred in different regions and at different elevations. This part of the explanation seems ad hoc, but a highly structured pre-Flood ecology seems to be an essential part of the theory.
Depositional trends are less frequently reported, but a few have been identified (see Appendix 3). The decrease in relative importance of limestone together with the increase in lake deposits can be linked to the expansion of the Flood beyond the main ocean bodies into the terrestrial environment. Habitat inferences based on depositional energy might alternatively be considered under depositional patterns. More study in this area is highly desirable. The relative geographic locations and stratigraphic positions of high energy and low energy deposits might provide helpful insights into the sequence and extent of various local or regional events during the Flood. The same could be said of patterns of storm deposits and lagerstätten. It would be interesting to determine if these patterns could be related to extraterrestrial impacts, plate arrangements, or paleocurrents. More information is also needed about possible trends in taphonomic processes.
Several diversity trends can be interpreted as the result of the expansion of Flood activity (see Appendix 1). Among these are coordinated appearances (e.g., the Cambrian Explosion), increasing diversity, disparity before diversity, and coordinated disappearances. The precise and consistent stratigraphic sorting of fossils into different strata is more problematic. A large-scale sorting mechanism is required to explain the consistency of the sorting over continent-sized geographic regions. The Flood may provide such a mechanism, but the details have yet to be worked with. The trend toward increasing provinciality also seems problematic for the Flood theory.
Morphological patterns provide a mixed bag for creationists. Most morphological patterns are consistent with creationist expectations (see Appendix 2). These include morphological stasis in fossil species, morphological gaps among species, systematic gaps among higher taxa, higher-taxon stasis, coordinated stasis, lack of ancestors, and ubiquitous morphological specialization. Many body-size trends may be expected in a flood, but further study is needed to clarify the processes involved. Increasing complexity may be a secondary effect of increasing terrestriality among vertebrates. The most significant challenges to creationism from the fossil record are probably the increasing similarity to modern species and stratigraphic sorting of species into morphological series. These trends are the most important fossil evidence for the alternative to the Flood theory, the theory of evolution. One of the major goals of creation scientists should be to provide alternative explanations for morphological series of fossils. Some morphological series have been linked to ecological rather than evolutionary causes, [83] but much more study is needed in this area.
CONCLUSION
The fossil record is a record of destruction and death. Is it the record of undirected history, in which every species lives for a while, then becomes extinct? Does it trace an evolutionary history of common ancestry, natural selection and improvement? Or is it a record of worldwide catastrophic destruction, designed to serve as a reminder of the effects of sin? Science alone does not provide a satisfactory answer, but the Bible indicates the latter interpretation is the correct one. The details are not given, and no present theory adequately explains all the data. No one has been able to figure out how to put everything together. However, by comparing the Bible and the fossil record, we can find meaning in the geologic column. Catastrophic activity and global patterns, perhaps the two most important predictions of the Flood theory, are clearly seen in the fossil record. The sudden, abrupt appearance of morphological disparity among marine animals in the "Cambrian Explosion" speaks of the beginning of the Flood. The terrible destructive power of the Flood is seen in the many extinct fossil groups. The lack of ancestors in the Precambrian rocks indicates the separate creation of many different groups. The presence of morphological gaps among higher taxa throughout the fossil record further illustrates this point.
Not everyone will interpret the record in this way. But those who are willing to test their ideas by the Bible can see divine purpose in the fossil record. This evidence affirms the reality of divine purpose in the present, and in the future.
ENDNOTES
[1](a) Gould SJ. 1988. Trends as changes in variance: a new slant on progress and directionality in evolution. Journal of Paleontology 62:319-329. See also: (b) Gould SJ. 1996. Full house. NY: Harmony House; (c) Ruse M. 1993. Evolution and progress. Trends in Ecology and Evolution 8:55-59; (d) Raup DM, Gould SJ. 1974. Stochastic simulation and evolution of morphology Towards a nomothetic paleontology. Systematic Zoology 23:305-322.
[2]For example, see: (a) Benton MJ. 1993. Fossil record 2. London: Chapman and Hall; also, for vertebrates, see: (b) Carroll RL. 1988. Vertebrate paleontology and evolution. NY: Freeman; for invertebrates, see: (c) Boardman RS, Cheetham AH, Rowell AJ, editors. 1987. Fossil invertebrates. Blackwell. Boston.; for plants, see: (d) Stewart WN, Rothwell GW. 1993. Paleobotany and the evolution of plants. 2nd ed. Cambridge and NY: Cambridge University Press.
[3]Schopf JW. 1992. Proterozoic prokaryotes: Affinities, geologic distribution, and evolutionary trends. In: Schopf JW, Klein C, editors. The Proterozoic biosphere. Cambridge: Cambridge University Press, p 195-218.
[4]An interesting account of the Cambrian Explosion is included in: (a) Gould SJ. 1989. Wonderful life. NY. W.W. Norton and Co. Other references include: (b) Conway Morris S. 1989. Burgess Shale faunas and the Cambrian Explosion. Science 246:339-346; (c) Dzik J. 1993. Early metazoan evolution and the meaning of its fossil record. Evolutionary Biology 27:339-382; (d) Signor PW. 1990. The geologic history of diversity. Annual Review of Ecology and Systematics 21:509-539; (e) Valentine JW. 1994. Late Precambrian bilaterians: grades and clades. Proceedings of the National Academy of Sciences (USA) 10:190-194; (f) Valentine JW. 1995. Why no new phyla after the Cambrian? Genome and ecospace hypotheses revisited. Palaios 10:190-194; (g) Valentine JW, Awramik SM, Signor PW, Sadler PM. 1991. The biological explosion at the Precambrian-Cambrian boundary. Evolutionary Biology 25:279-356.
[5]For example, see: (a) Benton MJ. 1995. Diversification and extinction in the history of life. Science 268:5258; (b) Droser ML, Fortey RA, Xing Li. 1996. The Ordovician radiation. American Scientist 84:122-131; (c) Doyle JA. 1977. Patterns of evolution in early angiosperms. In: Hallam A, editor. Patterns of evolution. Amsterdam and NY: Elsevier Scientific Publishing Co., p 501-546; (d) Erwin DH, Valentine JW, Sepkoski JJ. 1987. A comparative study of diversification events: the Early Paleozoic versus the Mesozoic. Evolution 41:1177-1186; (e) Feduccia A. 1995. Explosive evolution in Tertiary birds and mammals. Science 267:637-638; (f) Foote M. 1992. Paleozoic record of morphological diversity in blastozoan echinoderms. Proceedings of the National Academy of Sciences (USA) 89:7325-7329; (g) Foote M. 1994. Morphological disparity in Ordovician-Devonian crinoids and the early saturation of morphological space. Paleobiology 20:320-344; (h) Foote M. 1996. On the probability of ancestors in the fossil record. Paleobiology 22:141-151; (i) Gould SJ, Gilinsky NL, German RZ. 1987. Asymmetry of lineages and the direction of evolutionary time. Science 236:1437-1441; (j) Hunt AP, Lucas SG. 1991. Synchronous first appearance of dinosaurs worldwide during the Late Triassic (Late Carnian: Tuvalian). Geological Society of American Abstracts with Program 1991:A457; (k) Miller AI, Foote M. 1996. Calibrating the Ordovician Radiation of marine life: implications for Phanerozoic diversity trends. Paleobiology 22:304-309; (l) Niklas KJ. 1994. One giant step for life. Natural History 103(6):22-25; (m) Paul CRC. 1977. Evolution of primitive echinoderms. In: Hallam, p 123-158 (see Note 5); (n) Sepkoski JJ. 1981. A factor analytic description of the Phanerozoic marine fossil record. Paleobiology 7:36-53; (o) Zang, W-1. 1995. Early Neoproterozoic sequence stratigraphy and acritarch biostratigraphy, eastern Officer Basin, South Australia. Precambrian Research 74:119-175.
[6]Mass extinctions are discussed in scores of publications. Some examples include: (a) Bardet N. 1994. Extinction events among Mesozoic marine reptiles. Historical Biology 7:313-324; (b) Benton 1995 (see Note 5); (c) Erwin DH. 1993. The great Paleozoic crisis. NY: Columbia University Press; (d) Jablonski D. 1991. Extinctions: a paleontological perspective. Science 253:754-757; (e) Long JA. 1993. Early-Middle Palaeozoic vertebrate extinctions events. In: Long JA, editor. Paleozoic vertebrate biostratigraphy and biogeography. Baltimore: Johns Hopkins Press, p 54-63; (f) McGhee GR. 1996. The Late Devonian mass extinction. NY: Columbia University Press; (g) Raup DM, Sepkoski JJ. 1982. Mass extinctions in the marine fossil record. Science 215:1501-1503; (h) Sepkoski JJ. 1993. Ten years in the library: new data confirm paleontological patterns. Paleobiology 19:43-51; (i) Sepkoski JJ. 1994. Extinction and the fossil record. Geotimes 39(3):15-17.
[7](a) Benton 1995 (see Note 5); (b) Erwin, Valentine, and Sepkoski 1987 (see Note 5); (c) Knoll AH. 1984. Patterns of extinction in the fossil record of vascular plants. In: Nitecki MH, editor. Extinction. Chicago and London: University of Chicago Press, p 21-68; (d) Raup DM. 1976. Species diversity in the Phanerozoic: a tabulation. Paleobiology 2:279-288.; (e) Rosenzweig ML. 1995. Species diversity in space and time. Cambridge: Cambridge University Press; (f) Sepkoski JJ, Sheehan PM. 1983. Diversification, faunal change, and community replacement during the Ordovician radiations. In: Tevesz MJS, McCall PL, editors. Biotic interactions in Recent and fossil benthic communities. NY and London: Plenum Press, p 673-717; (g) Signor 1985. Real and apparent trends in species richness through time. In: Valentine JW, editor. Phanerozoic diversity patterns. Princeton, NJ: Princeton University Press, p 129-150; (h) Signor 1990 (see Note 4); (i) Signor PW. 1994. Biodiversity in geological time. American Zoologist 34:23-32.
[8](a) Schopf JW. 1992. Patterns of Proterozoic microfossil diversity: an initial, tentative, analysis. In: Schopf and Klein, p 529-552 (see Note 3); (b) Walter MR, Grotzinger JP, Schopf JW. 1992. Proterozoic stromatolites. In: Schopf and Klein, p 253-260 (see Note 3).
[11](a) Cox CB. 1974. Vertebrate palaeodistributional patterns and continental drift. Journal of Biogeography 1:75-94.; (b) Hutton N. 1992. Global distribution of terrestrial and aquatic tetrapods, and its relevance to the position of continental masses. In: Chatterjee S, Hotton N, editors. New concepts in global tectonics. Lubbock, TX: Texas Tech University Press, p 267-285; (c) Shubin NH, Sues H-D. 1991. Biogeography of early Mesozoic continental tetrapods. Paleobiology 17:214-230. An irregular pattern of provinciality is implied in: (d) Wing SL, Sues H-D. 1992. Mesozoic and Early Cenozoic terrestrial ecosystems. In: Behrensmeyer AK, Damuth JD, DiMichele WA, Potts R, Sues H-D, Wing SL, editors. Terrestrial ecosystems through time. Chicago and London: University of Chicago Press, p 327-416.
[12](a) McShea DW. 1996. Metazoan complexity and evolution: is there a trend? Evolution 50:477-492; (b) Ruse 1993 (see Note 1); (c) Valentine JW. 1994. Morphological complexity increase in metazoans. Paleobiology 20:131-142.
[14](a) Brett CE, Ivany LC, Schopf KM. 1996. Coordinated stasis: an overview. Palaeogeography, Palaeoclimatology, Palaeoecology 127:1-20; (b) DiMichele WA, Hook RW. 1992. Paleozoic terrestrial ecosystems. In: Behrensmeyer AK, Damuth JD, DiMichele WA, Potts R, Sues H-D, Wing SL, editors. Terrestrial ecosystems through time. Chicago and London: University of Chicago Press, p 205-325; (c) Eldredge N. 1996. Hierarchies in macroevolution. In: Jablonski D, Erwin DH, Lipps JH, editors. Evolutionary paleobiology. Chicago and London: University of Chicago Press, p 42-61; (d) Flynn LJ, Barry JC, Morgan ME, Pilbeam D, Jacobs LL, Lindsay EH. 1995. Neogene Siwalik mammalian lineages: species longevities, rates of change, and modes of speciation. Palaeogeography, Palaeoclimatology, Palaeoecology 115:249-264; (e) Morris PJ, Ivany LC, Schopf KM, Brett CE. 1995. The challenge of paleoecological stasis: reassessing sources of evolutionary stability. Proceedings of the National Academy of Sciences (USA) 92:11269-11273; (f) Tang CM, Bottjer DJ. 1996. Long-term faunal stasis without evolutionary coordination: Jurassic benthic marine paleocommunities, Western Interior, United States. Geology 24:815-818. See also references in Note 15.
[15](a) Cuffy RJ. 1984. Paleontologic evidence and organic evolution. In: Montagu A, editor. Science and creationism. Oxford and NY: Oxford University Press, p 255-281. Reprinted from Journal of the American Scientific Affiliation 24(4, December 1972); (b) Gingerich PD. 1974. Stratigraphic record of Early Eocene Hyopsodus and the geometry of mammalian phylogeny. Nature 248:107-109; (c) Strahler AN. 1987. Science and Earth history: the evolution/creation controversy. Buffalo, NY: Prometheus Books.
[16](a) Bakker RT. 1985. Evolution by revolution. Science 85(November):72-80; (b) Eldredge N, Gould SJ. 1972. Punctuated equilibria: an alternative to phyletic gradualism. In: Schopf TJM, editor. Models of paleobiology. San Francisco: Freeman, Cooper and Co., p 82-115; (c) Gould SJ, Eldredge N. 1977. Punctuated equilibria: the tempos and mode of evolution reconsidered. Paleobiology 3:115-151; (d) Sylvester-Bradley PC. 1977. Biostratigraphical tests of evolutionary theory. In: Kauffman EG, Hazel JE, editors. Concepts and methods of biostratigraphy. Stroudsburg, PA: Dowden, Hutchinson and Ross, p 41-63; (e) Heaton TH. 1993. The Oligocene rodent Ischyromys of the Great Plains: replacement mistaken for anagenesis. Journal of Paleontology 67:297-308.
[18](a) Wise KP. 1991. Changing stasis. Origins Research 13(1):20; (b) Battson AL. 1994. On the origin of stasis by means of natural processes. Perspectives on Science and Christian Faith 46:230-241.
[19](a) Brett, Ivany, and Schopf 1996 (see Note 14); (b) Ivany LC. 1997. Testing for coordinated stasis in the Eocene Gulf Coastal Plain. Geological Society Abstracts With Program A404-405; (c) Morris, Ivany, Schopf, and Brett 1995 (see Note 14). Many more papers on this topic are in Brett et al. 1996.
[20](a) Dommergues J-L. 1990. Ammonoids. In: McNamara KJ, editor. Evolutionary trends. Tucson: University of Arizona Press, p 162-187; (b) Eldredge and Gould 1972 (see Note 16); (c) Erwin, Valentine, and Sepkoski 1987 (see Note 5); (d) McNamara KJ. 1990. Epilogue. In: McNamara, p 347-350; (e) Williamson PG. 1981. Palaeontological documentation of speciation in Cenozoic molluscs from Turkana Basin. Nature 293:437-443; (f) see also references in Note 11. An opposing view is given in: (g) Gingerich 1974 (see Note 15).
[21]This point is argued on p 191-194 of: (a) Denton M. 1986. Evolution: a theory in crisis. Bethesda, MD: Adler and Adler; see also (b) Carroll RL. 1992. The primary radiation of terrestrial vertebrates. Annual Review of Earth and Planetary Sciences 20:45-84.
[22]A long list of claims, many of which have been re-interpreted, is given in: Cuffy 1984 (see Note 15). For other references see Notes 24-27.
[23](a) Boucot AJ. 1976. Rates of size increase and of phyletic evolution. Nature 261:694-695; (b) Cerdeno E, Nieto M. 1995. Changes in Western European Rhinocerotidae related to climatic variations. Palaeogeography, Palaeoclimatology, Palaeoecology 114:325-338; (c) Fortey RA, Owens RM. 1990. Trilobites. In: McNamara, p 121-142 (see Note 20); (d) Jablonski D. 1997. Body-size evolution in Cretaceous molluscs and the status of Cope's rule. Nature 385:250-252; (e) McKinney ML. 1986. Ecological causation of heterochrony: a test and implications for evolutionary theory. Paleobiology 12:282-289; (f) McKinney ML. 1990. Trends in body-size evolution. In: McNamara, p 75-118 (see Note 20); (g) McNamara KJ. 1990. Echinoids. In: McNamara, p 205-231 (see Note 20); (h) Mendelson CV, Schopf JW. 1992. Proterozoic and Early Cambrian Acritarchs. In: Schopf and Klein, p 219-232 (see Note 3); (i) Morgan ME, Barry JC. 1991. Trends in body size among Middle and Late Miocene herbivores from the Siwaliks of northern Pakistan. Journal of Vertebrate Paleontology 11(Suppl):48A, abstract 149.
[24]Benton MJ. 1990. Reptiles. In: McNamara, p 279-300 (see Note 20).
[25](a) Clyde WC, Fisher DC. 1997. Comparing the fit of stratigraphic and morphologic data in phylogenetic analysis. Paleobiology 23:1-19; (b) Hitchin R, Benton MJ. 1997. Congruence between parsimony and stratigraphy: comparisons of three indices. Paleobiology 23:20-32; (c) Huelsenbeck JP. 1994. Comparing the stratigraphic record to estimates of phylogeny. Paleobiology 20:470-483; (d) Norell MA, Novacek MJ. 1992. The fossil record and evolution: comparing cladistic and paleontologic evidence for vertebrate history. Science 255:1690-1693; (e) Norell MA, Novacek MJ. 1992. Congruence between superpositional and phylogenetic patterns: comparing cladistic patterns with fossil records. Cladistics 8:319-337; (f) Padian K, Lindberg DR, Polly PD. 1994. Cladistics and the fossil record: the uses of history. Annual Review of Earth and Planetary Sciences 22:63-91; (g) Prado JL, Alberdi MT 1996. A cladistic analysis of the horses of the tribe Equini. Palaeontology 39:663-680; (h) Weishampel DB. 1996. Fossils, phylogeny, and discovery: a cladistic study of the history of tree topologies and ghost lineage durations. Journal of Vertebrate Paleontology 16:191-197. Lack of stratigraphic agreement is reported in: (i) Antsey RL. 1990. Bryozoans. In McNamara, p 232-252 (see Note 20).
[26](a) Gould SJ. 1990. Speciation and sorting as the source of evolutionary trends or 'things are seldom what they seem.' In: McNamara, p 3-27 (see Note 20); (b) MacFadden BJ. 1992. Fossil horses. Cambridge and NY: Cambridge University Press.
[27](a) Fraser NC, Sues H-D, editors. 1994. In the shadow of the dinosaurs. Cambridge and NY: Cambridge University Press. See especially Chapter 6 (by Zhexi Luo) and Chapter 20 (by S.G. Lucas and A.P. Hunt); (b) Hotton N, MacLean PD, Roth JJ, Roth EC, editors. 1986. The ecology and biology of mammal-like reptiles. Washington DC and London: Smithsonian Institution Press; (c) Kemp TS. 1982. Mammal-like reptiles and the origin of mammals. London and NY: Academic Press.
[28](a) Fastovsky DE, Weishampel DB. 1996. The evolution and extinction of the dinosaurs. Cambridge and NY: Cambridge University Press; (b) Gatesy SM, Dial KP. 1996. Locomotor modules and the evolution of avian flight. Evolution 50:331-340. For minority view, see: (c) Feduccia A. 1996. The origin and evolution of birds. New Haven and London: Yale University Press; (d) Martin LD. 1991. Mesozoic birds and the origin of birds. In: Schultze H-P, Trueb L, editors. Origins of the higher groups of tetrapods. Ithaca and London: Comstock Publishing, p 485-540.
[29](a) Gingerich PD, Raza SM, Arif M, Anwar M, Zhou X. 1994. New whale from the Eocene of Pakistan and the origin of cetacean swimming. Nature 368:844-847; (b) Thewissen JGM, Hussain ST, Arif M. 1994. Fossil evidence for the origin of aquatic locomotion in archaeocete whales. Science 263:210-212.
[30](a) Landman NH. 1988. Heterochrony in ammonites. In: McKinney ML, editor. Heterochrony in evolution: a multidisciplinary approach. NY: Plenum, p 159-182; (b) Lidgard S, Jackson JBC. 1989. Growth in encrusting cheilostome bryozoans: I. Evolutionary trends. Paleobiology 15:255-282; (c) McNamara 1990 (see Note 20); (d) Wagner PJ. 1996. Contrasting the underlying patterns of active trends in morphologic evolution. Evolution 50:990-1007.
[31]This point can be confirmed by analyzing the data in: (a) Benton 1993 (see Note 2). See also: (b) Horowitz AS, Pachut JF. 1994. Lyellian bryozoan percentages and the fossil record of the Recent bryozoan fauna. Palaios 9:500-505.
[33]Gould makes this point in the book, Wonderful Life (see Note 4).
[34]Cladistics does not provide a method of identifying ancestors. Two attempts to do so are: (a) Alroy J. 1995. Continuous track analysis: a new phylogenetic and biogeographic method. Systematic Biology 44:152-178; (b) Paul CRC. 1992. The recognition of ancestors. Historical Biology 6:239-250. A possible ancestor of dogs is identified in: (c) Tedford RH, Taylor BE, Wang X. More problematic examples are: (d) Heinrich RE, Rose KD. 1995. Partial skeleton of the primitive carnivoran Miacis petilus from the Early Eocene of Wyoming. Journal of Mammalogy 76:148-162; (e) Rose KD. 1982. Skeleton of Diacodexis, oldest known artiodactyl. Science 216:621-623; (f) Rose KD. 1987. Climbing adaptations in the Early Eocene mammal Chriacus and the origin of artiodactyla. Science 236:314-316; (g) Rose KD. 1996. On the origin of the order Artiodactyla. Proceedings of the National Academy of Sciences (USA) 93:1705-1709.
[35](a) Benton MJ. 1996. On the nonprevalence of competitive replacement in the evolution of tetrapods. In: Jablonski, Erwin, and Lipps, p 185-210 (see Note 14); (b) Droser ML, Bottjer DJ, Sheehan PM. 1997. Evaluating the ecological architecture of major events in the Phanerozoic history of marine invertebrate life. Geology 25:167-170; (c) Sepkoski and Sheehan 1983 (see Note 7); (d) Sepkoski JJ, Miller AI. 1985. Evolutionary faunas and the distribution of Paleozoic marine communities in space and time. In: Valentine, p 153-190, (see Note 7); (e) Thayer CW. 1983. Sediment-mediated biological disturbance and the evolution of marine benthos. In: Tevesz and McCall, p 479-625 (see Note 7); (f) Vermeij GJ. 1987. Evolution and escalation. Princeton, NJ: Princeton University Press; (g) Wing and Sues 1992 (see Note 11).
[36](a) Bambach RK. 1983. Ecospace utilization and guilds in marine communities through the Phanerozoic. In: Tevesz and McCall, p 719-746 (see Note 7); (b) Bambach RK. 1985. Classes and adaptive variety: the ecology of diversification in marine faunas through the Phanerozoic. In: Valentine, p 191-253 (see Note 7); (c) Bambach RK, Bennington JB. 1996. Do communities evolve? A major question in evolutionary paleoecology. In: Jablonski, Erwin, and Lipps, p 123-160 (see Note 14); (d) Sepkoski JJ. 1996. Competition in macroevolution: the double wedge revisited. In: Jablonski, Erwin, and Lipps, p 211-255 (see Note 14).
[37](a) Conway Morris S, Whittington HB. 1979. The animals of the Burgess Shale. Scientific American 241(1):122-133; (b) Erwin 1993 (see Note 6).
[38](a) DiMichele WA, Aronson RB. 1992. The Pennsylvanian-Permian vegetational transition: a terrestrial analogue to the onshore-offshore hypothesis. Evolution 46:807-824; (b) DiMichele and Hook 1992 (see Note 14); (c) Niklas KJ, Tiffney BH, Knoll AH. 1985. Patterns in vascular land plant diversification: an analysis at the species level. In: Valentine, p 97-128 (see Note 7).
[39]The only vertebrate fossils of the lower Paleozoic are aquatic forms. They are joined by semi-aquatic and lowland forms in the mid- and upper Paleozoic, with an increase in terrestrial forms through the rest of the geologic column. E.g., see: (a) DiMichele and Hook 1992 (see Note 14); (b) Olson, E. C. 1966. Community evolution and the origin of mammals. Ecology 47:291-302. For a different viewpoint, see: (c) Padian K, Clemens WA. 1985. Terrestrial vertebrate diversity: episodes and insights. In: Valentine, p 41-96 (see Note 7).
[40]Roth AA. 1992. Life in the deep rocks and the deep fossil record. Origins 19:93-104.
[41](a) Erwin 1993 (see Note 6); (b) Thayer 1983 (see Note 35); (c) Vermeij 1987 (see Note 35).
[42](a) Cowen R. 1996. Locomotion and respiration in aquatic air-breathing vertebrates. In: Jablonski, Erwin, and Lipps, p 337-353 (see Note 14); (b) Janis CM, Damuth J. 1990. Mammals. In: McNamara, p 301-345 (see Note 20); (c) Stucky RK. 1989. Evolution of land mammal diversity in North America during the Cenozoic. Current Mammalogy 2:375-432.
[43]Marsaglia KM, Klein GDeV. 1983. The paleogeography of Paleozoic and Mesozoic storm depositional systems. Journal of Geology 91:117-142.
[44](a) Allison PA, Briggs DEG. 1993. Exceptional fossil record: distribution of soft-tissue preservation through the Phanerozoic. Geology 21:527-530; (b) Briggs DEG. 1991. Extraordinary fossils. American Scientist 79:130-141; (c) Butterfield NJ. 1996. Burgess Shale-type preservation of both non-mineralizing and 'shelly' Cambrian organisms from the MacKenzie Mountains, Northwestern Canada. Journal of Paleontology 70:893-899.
[45](a) DiMichele and Aronson 1992 (see Note 38); Bottjer DJ, Jablonski D. 1988. Paleoenvironmental patterns in the evolution of post-Paleozoic benthic marine invertebrates. Palaios 3:540-560; (b) Jablonski D, Sepkoski JJ, Bottjer DJ, Sheehan PM. 1983. Onshore-offshore patterns in the evolution of Phanerozoic shelf communities. Science 222:1123-1125; (c) Jablonski D, Bottjer DJ. 1991. Environmental patterns in the origins of higher taxa: the post-Paleozoic fossil record. Science 252:1831-1833; (d) Miller AI. 1988. Spatio-temporal transitions in Paleozoic bivalvia: an analysis of North American fossil assemblages. Historical Biology 1:251-273; (e) Sepkoski JJ. 1991. A model of onshore-offshore change in faunal diversity. Paleobiology 17:58-77.
[46]Behrensmeyer AK, Hook RW. 1992. Paleoenvironmental contexts and taphonomic modes. In: Behrensmeyer, Damuth, DiMichele, Potts, Sues, and Wing, p 15-136 (see Note 11).
[47]Ronov AB. 1982. The Earth's sedimentary shell (quantitative patterns of its structure, compositions, and evolution). International Geology Review 24:1365-1388.
[48](a) Behrensmeyer and Hook 1992 (see Note 46); (b) Greenstein B. 1992. Taphonomic bias and the evolutionary history of the family Cidaridae (Echinodermata: Echinoidea). Paleobiology 18:50-79; (c) Kidder DL, Schubert JK, Erwin DH. 1997. Secular patterns of invertebrate skeletal silicification. Geological Society of America Abstracts With Program A265; (d) Kidwell SM, Brenchley PJ. 1996. Evolution of the fossil record: thickness trends in marine skeletal accumulations and their implications. In: Jablonski, Erwin, and Lipps, p 290-336 (see Note 14).
[49](a) Ausich WI, Bottjer DJ. 1985. Phanerozoic tiering in suspension-feeding communities on soft substrata: implications for diversity. In: Valentine, p 255-274 (see Note 7); (b) Durazzi JT, Stehli FG. 1972. Average generic age, the planetary temperature gradient, and pole location. Systematic Zoology 21:384-389; (c) Flessa KW, Jablonksi D. 1996. The geography of evolutionary turnover: a global analysis of extant bivalves. In: Jablonski, Erwin, and Lipps, p 376-397 (see Note 14); (d) Koch PL. 1986. Clinal geographic variation in mammals: implications for the study of chronoclines. Paleobiology 12:269-281; (e) Long JA. 1993. Early-Middle Palaeozoic vertebrate extinction events. In: Long, p 54-63 (see Note 6); (f) Raup DM, Stanley SM. 1978. Principles of paleontology. 2nd edition. San Francisco: Freeman, Chapter 11, Evolution and the fossil record; (g) Rosenzweig ML. 1995 (see Note 7); Signor 1990 (see Note 4); Signor 1994 (see Note 7); Wing and Sues 1992 (see Note 11).
[51](a) Cheetham AH. 1987. Tempo of evolution in a Neogene bryozoan: are trends in single morphologic characters misleading? Paleobiology 13:286-296; (b) Gould 1990 (see Note 26); (c) Holland SM. 1995. The stratigraphic distribution of fossils. Paleobiology 21:92-109; (d) McKee JK. 1995. Turnover patterns and species longevity of large mammals from the Late Pliocene and Pleistocene of southern Africa: a comparison of simulated and empirical data. Journal of Theoretical Biology 172:141-147.
[52](a) Aberhan M. 1993. Faunal replacement in the Early Jurassic of northern Chile: implications for the evolution in Mesozoic benthic shelf ecosystems. Palaeogeography, Palaeoclimatology, Palaeoecology 103:155-177; (b) Behrensmeyer and Hook 1992 (see Note 46); (c) Carlson JS. 1992. Evolutionary trends in the articulate brachiopod hinge mechanism. Paleobiology 18:344-366; (d) Cheema IU, Raza SM, Flynn LJ. 1989. Radical replacement of an Early Miocene small mammal biota. Journal of Vertebrate Paleontology 9(Suppl.):16A; (e) DiMichele and Hook 1992 (see Note 14); (f) McKinney ML. 1990. Classifying and analyzing evolutionary trends. In: McNamara, p 28-58 (see Note 20); (g) McNamara KJ. 1990. The role of heterochrony in evolutionary trends. In: McNamara, p 59-74 (see Note 20); (h) McNamara KJ. 1990. Echinoids. In: McNamara, p 205-231 (see Note 20); (i) Miller AI. 1990. Bivalves. In: McNamara, p 143-161 (see Note 20); (j) Simms MJ. 1990. Crinoids. In: McNamara, p 188-204 (see Note 20).
[53]See any standard text on historical geology or paleontology, for example: (a) Poort JM, Carlson RJ. 1997. Historical geology: interpretations and applications. 5th edition. Englewood Cliffs, NJ: Prentice-Hall; (b) Rogers JJW 1993. A history of the Earth. Cambridge: Cambridge University Press.
[54](a) Van Valen L. 1973. A new evolutionary law. Evolutionary Theory 1:1-30; (b) Vermeij 1987 (see Note 35).
[55]Bengtson S, Lipps JH. 1992. Introduction. In: Schopf and Klein, p 427-428 (see Note 3).
[56]When it can be checked, the fossil record does not seem to be all that incomplete. See: (a) Foote 1996 (see Note 5); (b) Foote M, Raup DM. 1996. Fossil preservation and the stratigraphic ranges of taxa. Paleobiology 22:121-140; (c) Valentine JW. 1989. How good was the fossil record? Clues from the California Pleistocene. Paleobiology 15:83-94.
[57](a) Gould 1988 (see Note 1); (b) Gould 1990 (see Note 26).
[58](a) Brand L. 1997. Faith, reason and earth history: a paradigm of earth and biological origins by intelligent design. Berrien Springs, MI: Andrews University Press; (b) Clark HW. 1946. The new diluvialism. Angwin, CA: Science Publications; (c) Clark HW. 1968. Fossils, flood and fire. Escondido, CA: Outdoor Pictures; (d) Coffin HG. 1969. Creation: accident or design? Washington DC: Review and Herald Publishing Assn.; (e) Coffin HG. 1983. Origin by design. Hagerstown, MD: Review and Herald Publishing Assn.; (f) Oard MJ. 1997. The extinction of the dinosaurs. Creation Ex Nihilo Technical Journal 11:137-154; (g) Snelling AA. 1991. Creationist geology: where do the Precambrian strata fit? Creation Ex Nihilo Technical Journal 5(2):154-175; (h) Whitcomb JC, Morris HM. 1961. The Genesis flood. Phillipsburg, NJ: Presbyterian and Reformed Publishing; (i) Wise K. 1989. Punc Eq creation style. Origins 16:11-24; (j) Wise 1991 (see Note 18); (k) Wise KP. 1992. Some thoughts on the Precambrian fossil record. Creation Ex Nihilo Technical Journal 6(1):67-71; (l) Wise KP. 1994. Australopithecus ramidus and the fossil record. Creation Ex Nihilo Technical Journal 8:160-165; (m) Wise KP. 1995. Towards a creationist understanding of 'transitional forms.' Creation Ex Nihilo Technical Journal 9(2):216-222; (n) Wise KP. 1996. North American Paleontology Convention 96. Creation Ex Nihilo Technical Journal 10:315-321; (o) Woodmorappe J. 1983. A diluviological treatise on the stratigraphic separation of fossils. Creation Research Society Quarterly 20:133-185.
[59](a) Clark 1946 (see Note 58); (b) Coffin 1983 (see Note 58); (c) Wise 1996 (see Note 58).
[62](a) Battson 1994 (see Note 18); (b) Marsh FL. 1941. Fundamental biology. Lincoln, NE: Published by the author; (c) Wise 1989 (see Note 58); (d) Wise 1991 (see Note 18).
[69](a) Clark 1946 (see Note 58); (b) Clark 1968 (see Note 58).
[70]Fossils of photosynthetic bacteria are believed to be present in Precambrian strata, as noted in: (a) Schopf 1992 (see Note 3). However, their presence in Proterozoic stromatolites "has yet to be adequately documented," according to: (b) Walter, Grotzinger, and Schopf 1992 (see Note 8).
[74](a) Davies DJ, Powell EN, Stanton RJ. 1989. Relative rates of shell dissolution and net sediment accumulation a commentary: can shell beds form by the gradual accumulation of biogenic debris on the sea floor? Lethaia 22:207-212; (b) Kidwell SM, Brenchley PJ. 1994. Patterns in bioclastic accumulation through the Phanerozoic: changes in input or in destruction? Geology 22:1139-1143; (c) Kidwell SM, Flessa KW. 1996. The quality of the fossil record: Populations, species, and communities. Annual Review of Earth and Planetary Sciences 24:433-464. See also Note 41.
[81](a) Brand 1997 (see Note 58); (b) Wise 1989 (see Note 58).
[82](a) Holt RD. 1996. Evidence for a Late Cainozoic Flood/post-Flood boundary. Creation Ex Nihilo Technical Journal 19:128-167; (b) Oard 1996 (see Note 58); (c) Oard MJ. 1997. The extinction of the dinosaurs. Creation Ex Nihilo Technical Journal 11:137-154.
[83]Ecological explanations of morphological trends are not inconsistent with evolutionary theory, but do provide a possible explanation that is consistent with the Flood. See references in Note 41 for examples.