Investigation of amino acids in fossils over the past thirty years has revealed that residual amino acids may exist in fossils from throughout the Phanerozoic portion of the geologic column, that the amino acid pattern in a given fossil changes with age due to differences in stability among the twenty amino acids of which proteins are constructed, and that the ratio of right-handed to left-handed forms (D/L ratio) of amino acids increases with age from zero in the proteins of living organisms to the ratios which are characteristic of amino acids produced synthetically (the racemic ratios).
The possibilities for using these characteristics as a means for determining fossil age are frustrated by variations of the amino acid pattern among individual living organisms of the same species, and by the critical dependency of the racemization probability for an amino acid molecule on temperature, water concentration in the environment, alkalinity of the environment, association with other molecules (free state or a component of a macromolecule), size of the macromolecule of which it may be a component, specific location in the structure of a macromolecule, catalytic effect of clay surfaces with which it may be associated, presence of aldehydes and metal ions, concentration of buffer compounds in the environment, and ionic strength of the environment. In spite of these complications, fossils of similar characteristics, and which have experienced similar conditions of preservation, can be placed in a relative age sequence on the basis of D/L ratios. Due to the strong dependency of racemization rates on temperature, water concentration, and alkalinity, uncertainties regarding conditions of preservation can leave amino-acid-based age relationships among even similar fossils open to question. At the present time there is insufficient knowledge concerning the effective average racemization rate in a fossil as a function of time to justify dependence on D/L ratios for a quantitative determination of age.
The survival of amino acids in fossils from the Paleozoic era and the trend for the apparent racemization rate constant to decrease with conventional fossil age assignment raise a serious question concerning the accuracy with which radioisotope age data have been used to represent the real-time history of fossils.
The instability of the twenty amino acids which are the building blocks of proteins provides a possible means for determining the ages of fossils. A preliminary recognition of this possibility appeared in the scientific literature 30 years ago (Abelson 1955).
AMINO ACID SURVIVAL IN PHANEROZOIC FOSSILS
Since amino acids have widely varying degrees of stability, after the death of an organism the less stable amino acid components will decompose more rapidly than those which are more stable, producing an amino acid signature that is increasingly distributed toward the more stable components as time progresses (Hare and Abelson 1967, Lee et al. 1976, Akiyama and Wyckoff 1970). Because of the range of variation among individual members of the same species (Hare and Abelson 1965, Hare and Mitterer 1967, King and Hare 1972, Jope 1980), amino acids may be expected to provide at best only a broad indication of fossil age. Uncertainty as to the extent to which modern organisms represent in detail the characteristics of their ancient counterparts introduces additional lack of precision in a fossil age based on amino acid ratios.
Amino acids have been reported from fossils distributed throughout the geologic column (Florkin 1969). Since detectable levels of many amino acids are expected to survive only a few million years, at best, these observations are an enigma (Abelson 1956, 1957). Therefore it has been suggested that the amino acids found in older fossils, such as those from Cambrian sediments, e.g., are recent contaminants rather than actual molecules remaining from the original organisms. Investigation of this suggestion has identified residual amino acids in Silurian graptolites (400-430 million year putative age) (Florkin 1969). It has been well established that shells as old as Jurassic (135-180 million year conventional age) may contain amino acids bound as protein and peptide, and hence residuals from the parent organisms (Akiyama and Wyckoff 1970). An attempt to account for these apparently anomalous observations has been made by suggesting that the fossil matrix somehow holds the amino acid molecules together so that they do not spontaneously decompose as would be expected on the basis of their binding energies (i.e., structural strength) (Hare and Mitterer 1968).
CHANGE OF D/L RATIO WITH TIME
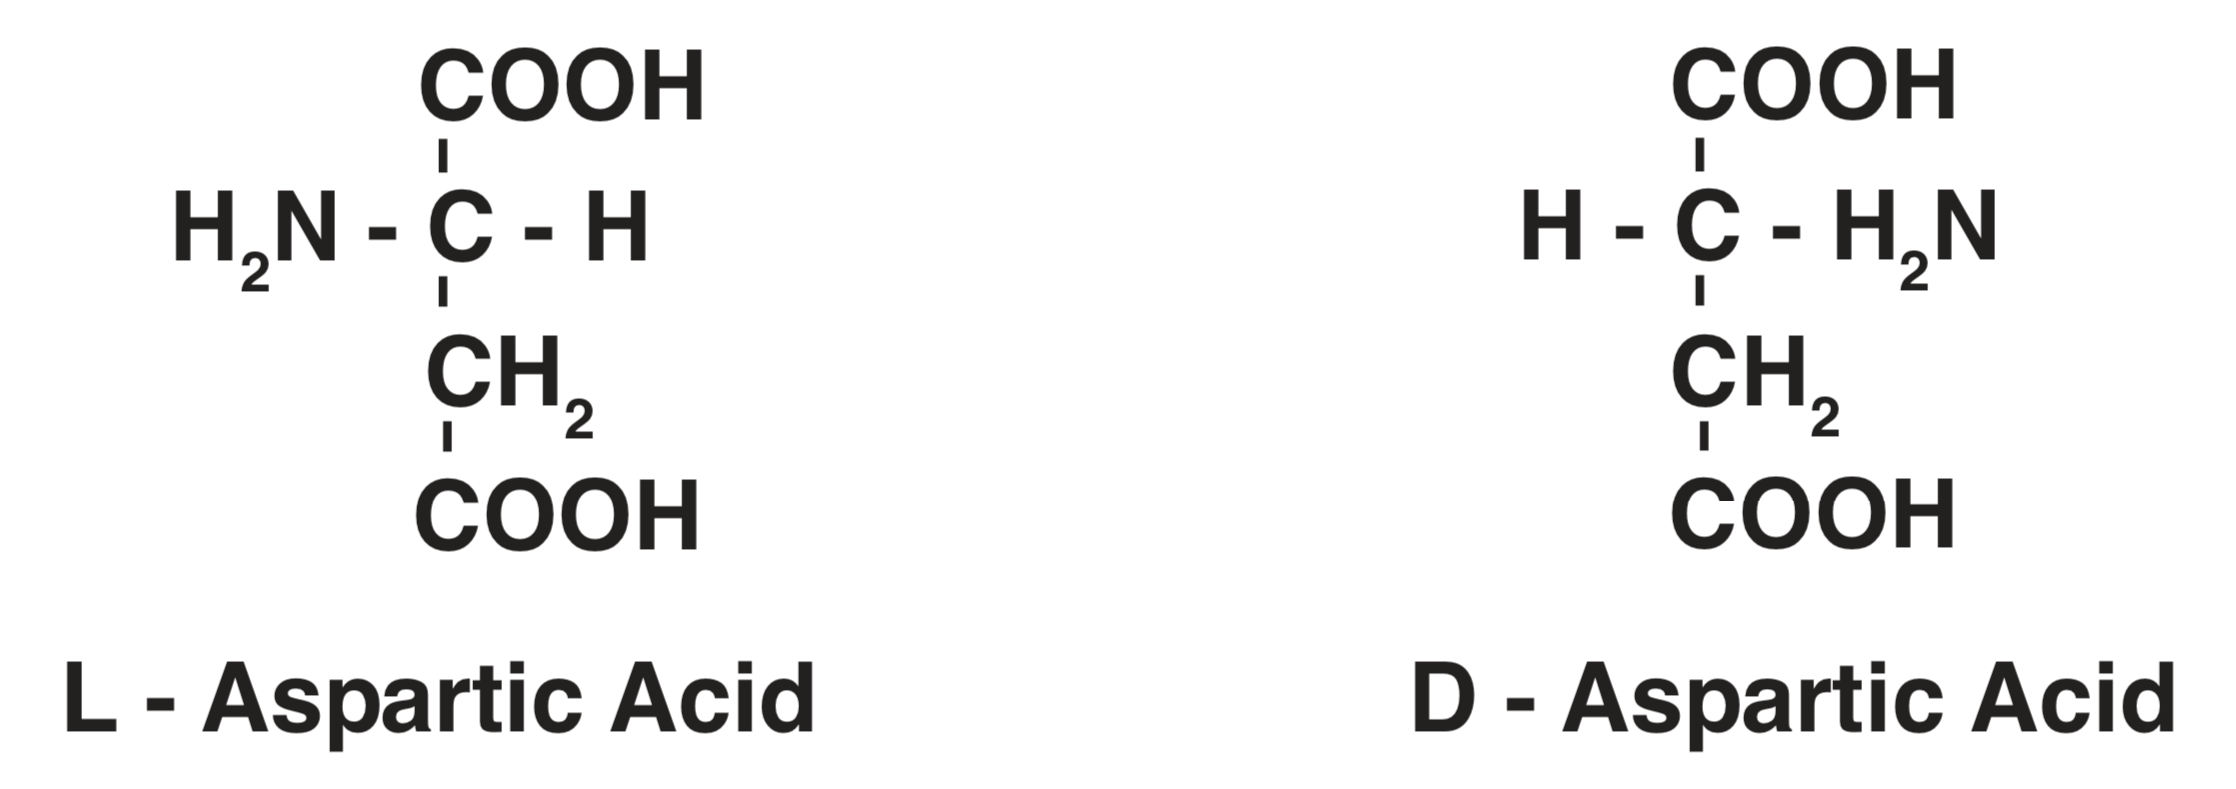
A far more suitable approach to fossil age determination is provided by the fact that all but one (glycine) of the amino acids in proteins are asymmetric and may exist in either a left-handed (L) or a right-handed (D) form, each of which is the mirror image of the other. As an example, Figure1 illustrates the L- and D-forms of aspartic acid. L- and D-forms have opposite rotational effects on the vibrational plane of polarized light. All other physical properties of the L- and D-forms of a given amino acid are identical, and of course the chemical compositions are identical. Small amounts of D-amino acids are found in organisms, but most of the amino acids in organisms are constituents of protein molecules, and all amino acids (except glycine which is symmetric and has no D- and L-configuration) in the protein of living organisms are in the L-configuration (Kvenvolden 1975).
FIGURE 1. Structural Representation of Aspartic Acid Enantiomers.
Both the D- and the L-configurations of amino acids convert to the other over a period of time, either as the result of random thermal energy or through a catalyzed chemical mechanism. After the death of an organism the L-amino acids diminish while the D-forms accumulate until equilibrium conditions are reached. In the case of any amino acid containing a single asymmetric carbon atom, such as aspartic acid, the equilibrium state is 50% L- and 50% D-, a 1/1 ratio. After equilibrium is reached the conversion from D-to L- is just as rapid as the conversion from L- to D-. The equilibrium state is called a racemic mixture, and the process of approaching equilibrium is called racemization.
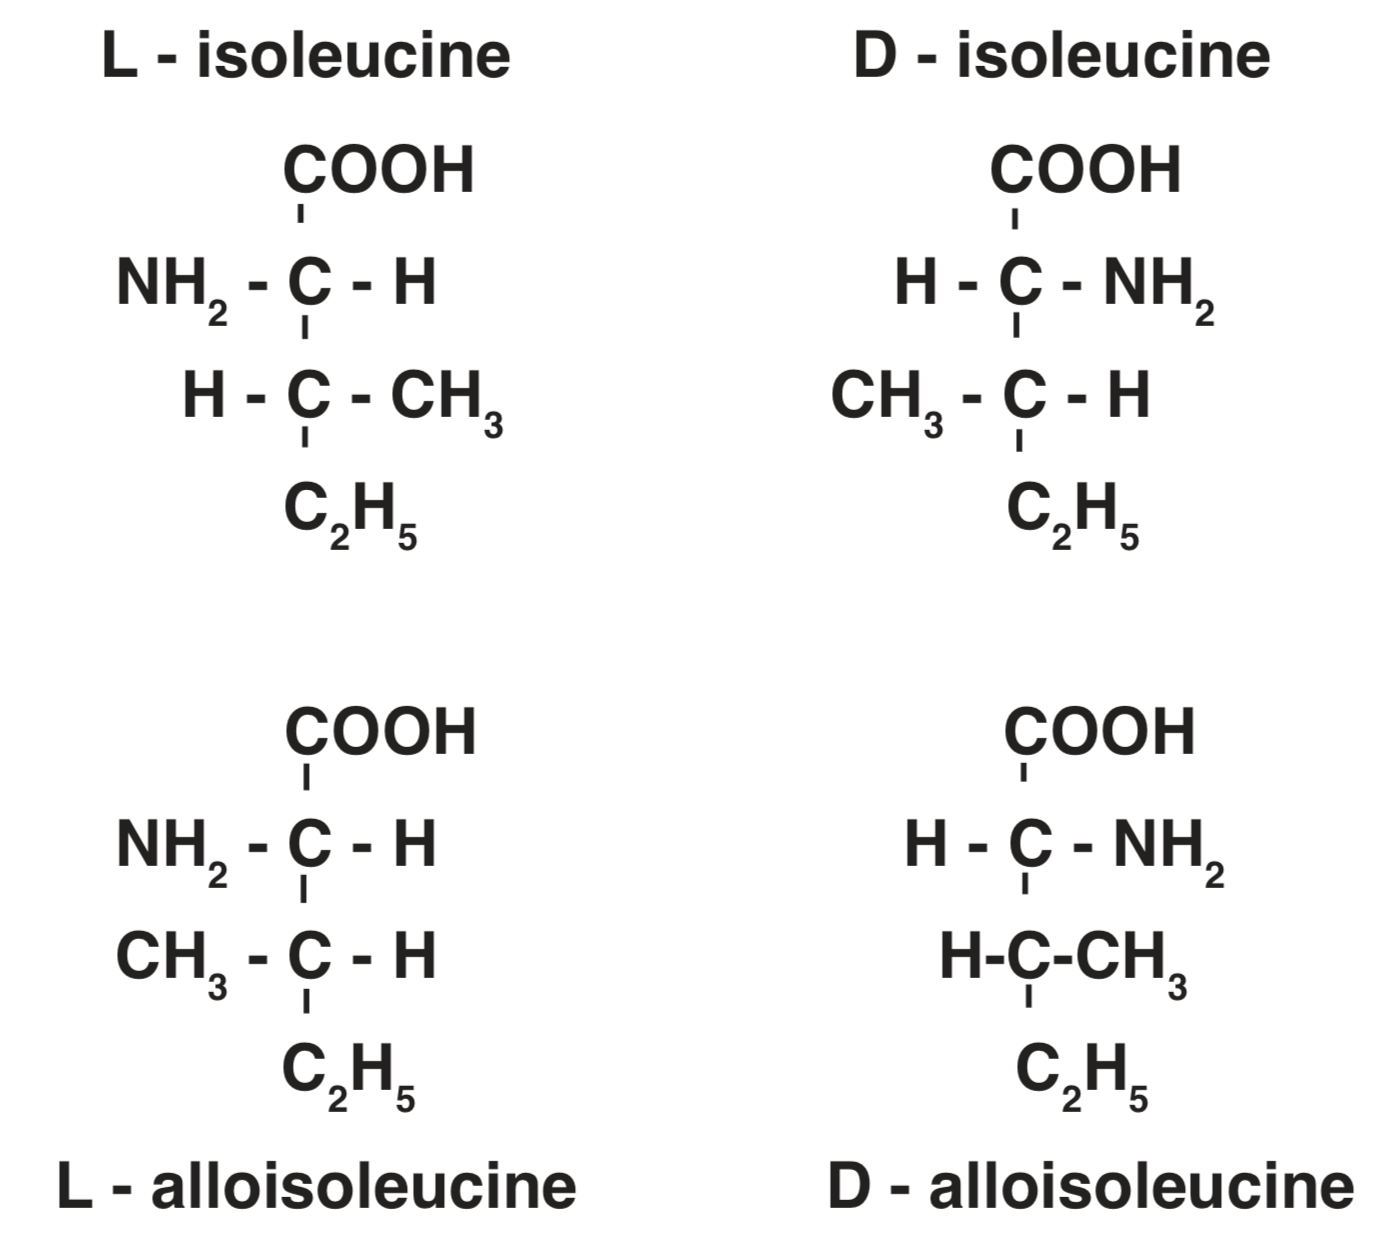
Four of the amino acids that make up proteins isoleucine, threonine, hydroxyproline, and hydroxylysine have two asymmetric carbon atoms which produce four structural possibilities for the same chemical composition. Two of these forms are designated as diastereomers, each of which may exist in either an L- or a D-form. Figure2 illustrates this pattern for isoleucine, which together with aspartic acid has received the greatest attention in amino acid dating. Interaction among diastereomers is called epimerization. The epimerization process includes racemization. The racemic mixture resulting from the epimerization of isoleucine has been determined to have a ratio of D-alloisoleucine to L-isoleucine in the range 1.25/1 to 1.4/1, with greatest confidence in a figure near 1.25/1. For comparison of work done by different investigators 1.25/1 is accepted as a standard value (Kvenvolden 1975, Bada 1981, Wehmiller and Belknap 1982).
FIGURE 2. Structural Representation of Isoleucine/Alloisoleucine Enantiomers.
In contrast with age determination by ratios among the concentrations of various amino acids, age determination by D/L ratio has the advantage of a precise reference point, zero D/L ratio in the proteins of a living organism. The laboratory procedure involves only the measurement of two components that can be determined by standard chromatograph techniques with relatively inexpensive equipment. Before we can evaluate the results of such determinations we will need a relationship between the D/L ratio and time.
QUANTITATIVE RELATIONSHIPS FOR RACEMIZATION RATE
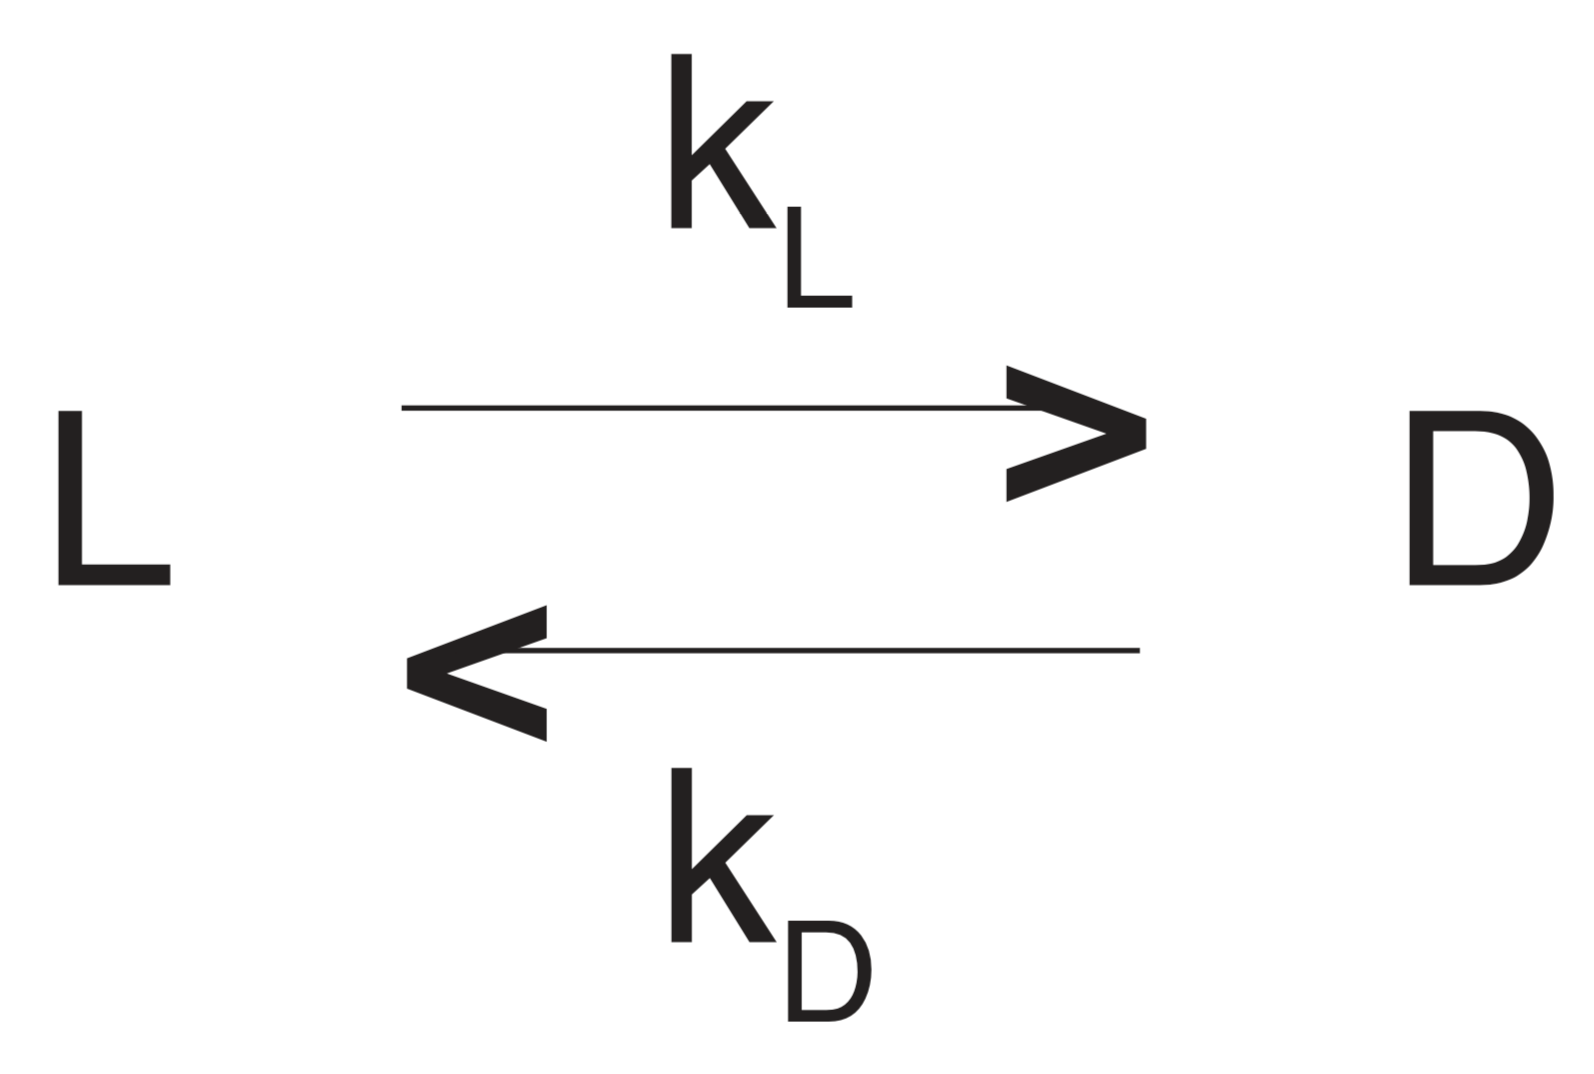
Let the symbols D and L now represent the concentrations of the D-form and the L-form, respectively, of an interconverting enantiomer pair such as D- and L-aspartic acid, or an interconverting diastereomer pair such as D-alloisoleucine and L-isoleucine. kL will be the rate constant (probability) for conversion from the L-form to the D-form within a unit of time, and kD will be the corresponding rate constant (probability) for conversion from the D-form to the L-form. Symbolically
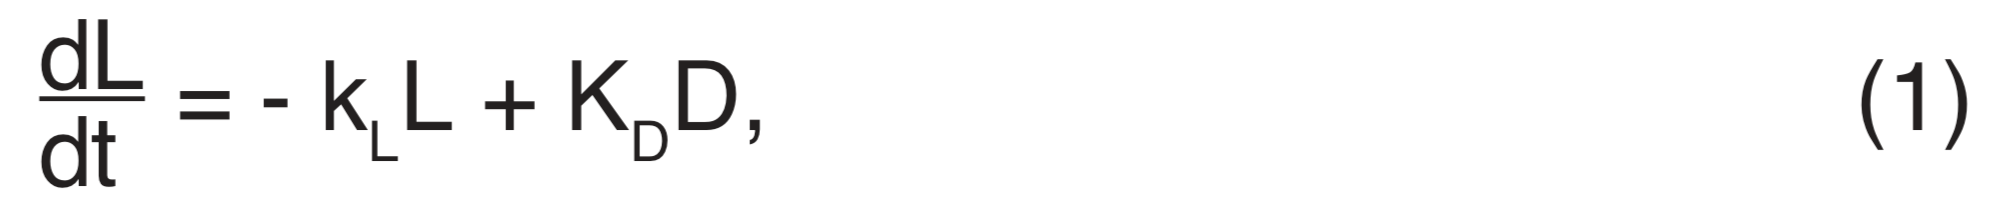
For the rate of change of L per unit time we can write
where dL/dt is negative since the L-isomer experiences only a net decrease over time until dL/dt becomes zero at equilibrium. The integral solution of Equation (1) is (Bada and Schroeder 1972, Petit 1974)
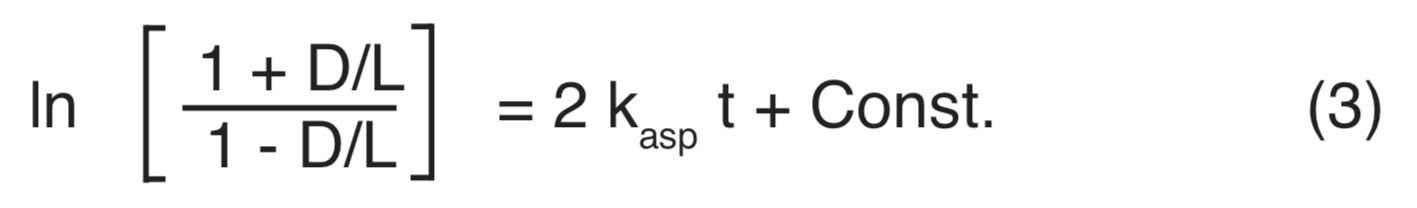
in which ln designates "natural logarithm." For enantiomer pairs such as D- and L-aspartic acid which have equal concentrations of the L- and D-forms at equilibrium kL@ kD@ K. For aspartic acid Equation (2) becomes
For the diastereomer pair D-alloisoleucine and L-isoleucine with kL/kD@ 1.25, Equation (2) becomes
kL/kD@ 1.25 comes from the consideration that at equilibrium kLL = kDD, together with the accepted value of 1.25 for D/L at equilibrium.
Although equations (3) and (4) appear complicated, they have the form of a simple straight-line relationship between two variables, as given by the type equation y = mx + b. The logarithmic term on the left corresponds to the dependent variable y, and t corresponds to the independent variable x. The coefficient of t is presumed to be a constant, corresponding to m, and Const. corresponds to b. The Const. term in equations (3) and (4) is the value of the logarithmic term for zero fossil age (t=0). Since the D-form does not exist in the amino acids of proteins in living organisms, the logarithmic term for t=0 should be zero (ln 1 = 0), which specifies a zero value for Const. A non-zero constant term may be required to adjust for a slight racemization produced during the laboratory preparation of a sample (Bada and Shou 1980). This constant might not be the same for every laboratory, or for every procedure within a given laboratory.
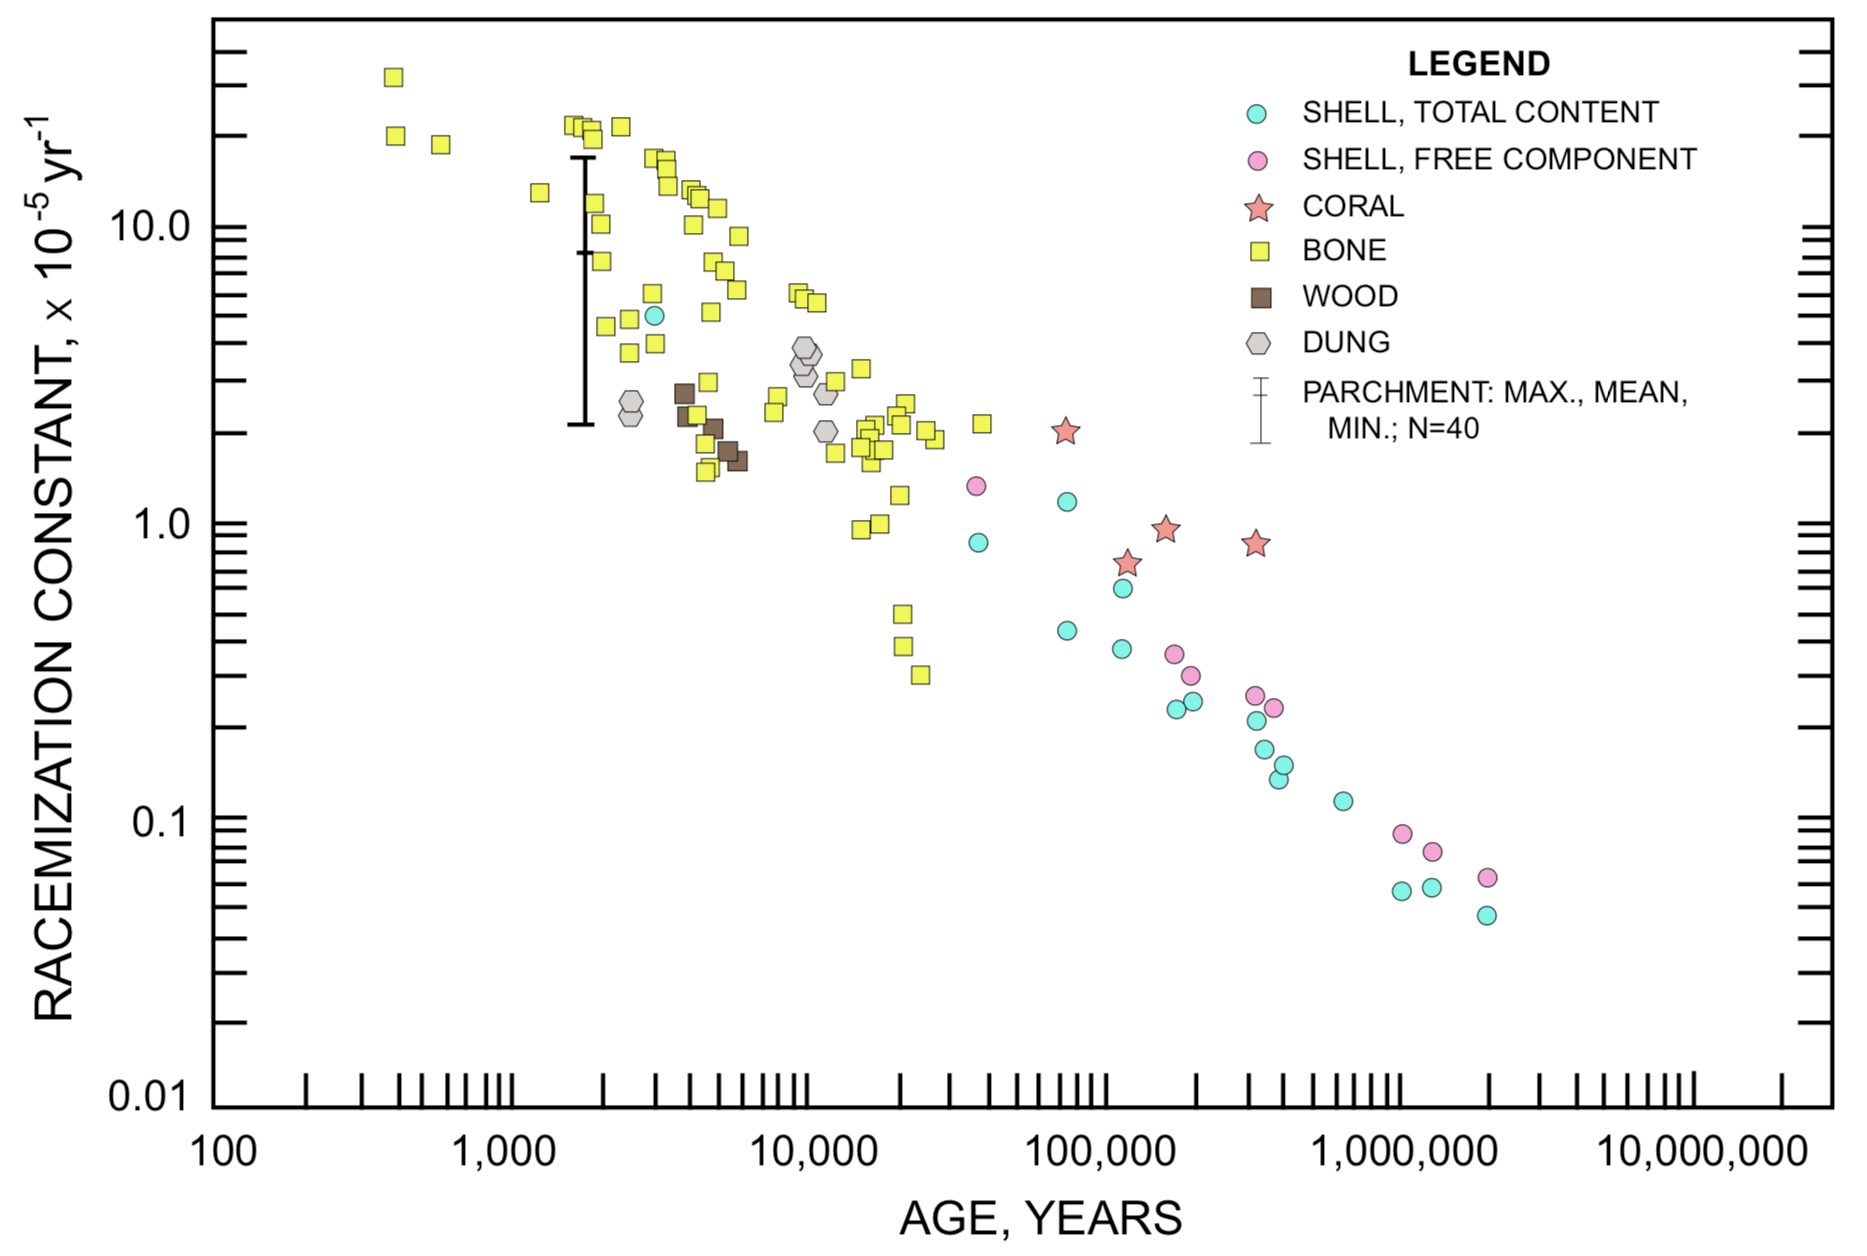
Isoleucine and alloisoleucine racemization rate constants reported in the literature are nearly always computed for Const. = 0 in Equation4 (references for Figure 4). Aspartic acid racemization rate constants are commonly computed using Const. = 0.14 in Equation 3 (e.g., Schroeder and Bada 1973, Bada 1981). Four determinations of D-aspartic acid in modern packrat pellets (Petit 1974) specified 0.00, 0.040, 0.080 and 0.12 for this constant. A t = 0 constant of 0.06 has been adopted for the racemization of glutamic acid in a mollusk shell (Kvenvolden and Blunt 1980). Since a direct determination of the t=0 constant is seldom reported in publications of D/L ratios for fossils, and since the 0.14 value commonly favored for aspartic acid yields physically unreasonable negative values of the racemization constant for all D/L ratios less than 0.070 (four such are encountered in the Dead Sea Scroll data that are included in Figure3), all racemization rate constants plotted in figures (3) and (4) have been calculated on the basis of a zero value for the t=0 constant.
FIGURE 3. Aspartic Acid Racemization Constant versus Associated Fossil Age. Data from Bada 1981, Bada and Deems 1975, Bada and Protsch 1973, Bada and Shou 1980, Bada et al. 1984, Bender 1974, Bischoff and Childers 1979, Kessels and Dugworth 1980, King and Bada 1979, Kvenvolden and Peterson 1973, Kvenvolden et al. 1973, Kvenvolden et al. 1979, Lajoie et al. 1980, Lee et al. 1975, Petit 1974, Schroeder and Bada 1973, Stafford et al. 1984, Wehmiller et al. 1976, Weiner et al. 1980, Zumberge et al. 1980.
FIGURE 3. Aspartic Acid Racemization Constant versus Associated Fossil Age. Data from Bada 1981, Bada and Deems 1975, Bada and Protsch 1973, Bada and Shou 1980, Bada et al. 1984, Bender 1974, Bischoff and Childers 1979, Kessels and Dugworth 1980, King and Bada 1979, Kvenvolden and Peterson 1973, Kvenvolden et al. 1973, Kvenvolden et al. 1979, Lajoie et al. 1980, Lee et al. 1975, Petit 1974, Schroeder and Bada 1973, Stafford et al. 1984, Wehmiller et al. 1976, Weiner et al. 1980, Zumberge et al. 1980.
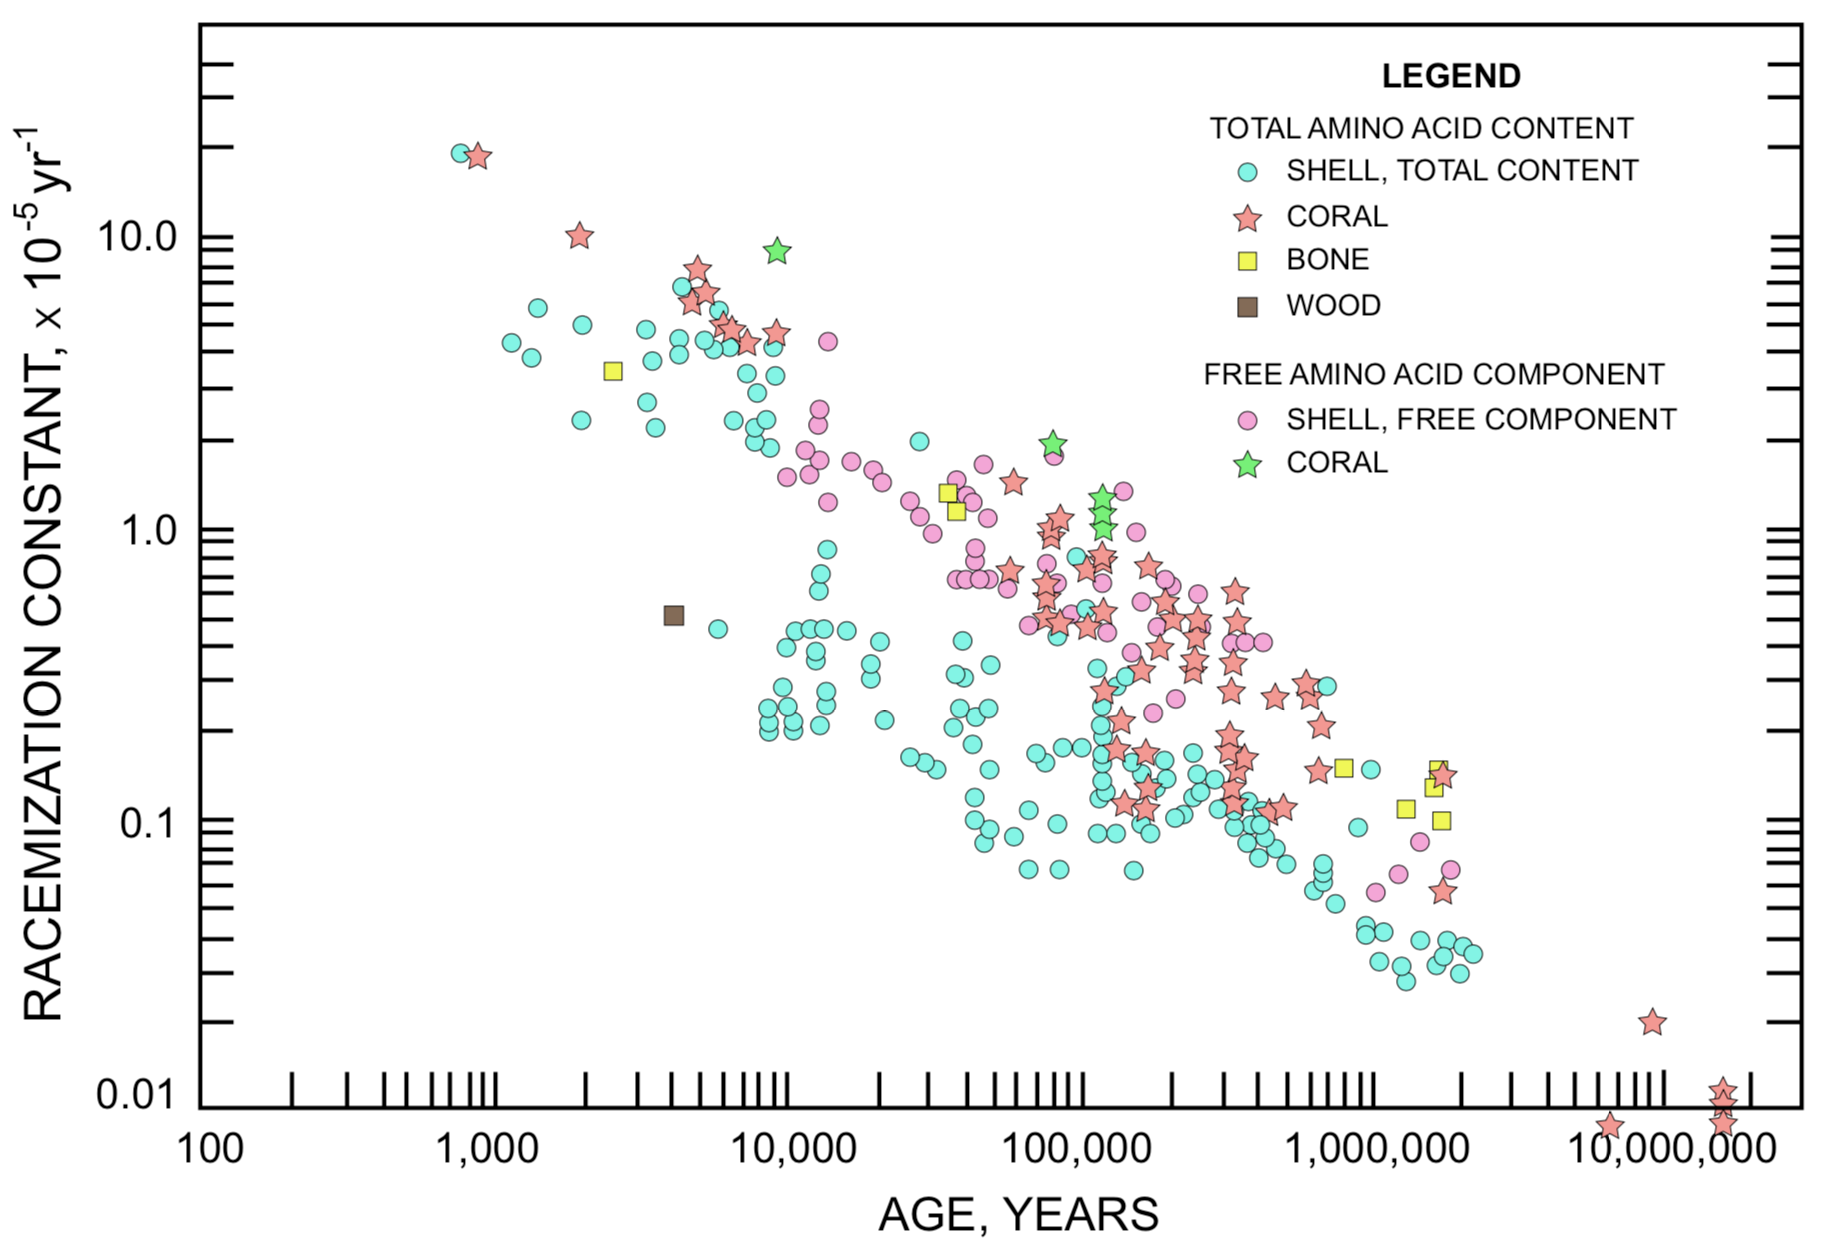
FIGURE 4. Isoleucine Racemization Rate Constant versus Associated Fossil Age. Data from Bada 1981, Bada and Protsch 1973, Bada and Schroeder 1972, Bada et al. 1973, Bischoff and Childers 1979, Blake 1980, Hare and Mitterer 1966, King and Neville 1977, Kvenvolden 1980, Kvenvolden et al. 1973, Lee et al. 1976, Masters and Bada 1977, Miller and Hare 1980, Mitterer 1975, Stafford et al. 1984, Szabo et al. 1981, Wehmiller 1977, Wehmiller and Hare 1971, Wehmiller et al. 1976.
To estimate the validity of using a zero t=0 constant in computing the racemization rate constant values plotted in Figure3, all the data sets represented in this figure were plotted as logarithmic term (y) against the fossil age (x). To the extent that Equation3 is valid, and that valid real-time values for t are available, these plots should fit straight lines with a y-intercept equal to the appropriate t=0 constant. Actually the plots indicate that there is a question concerning the validity of Equation3 (i.e., that k does not have the same value for all fossil ages) and/or a question concerning the real-time significance of the assigned fossil ages, particularly those in excess of 15,000 years. Of the ten data sets which have a suitable spread of fossil age for a graphical determination of the t=0 constant, seven are adequately described by a value of approximately zero, one requires a value in the range 0.6-0.9, one in the range 0-0.28, and one in the range 0.04-0.19. Use of a value other than zero for Const. in Equation 3 would lower the k values plotted in Figure3, increasingly as fossil age is reduced, and most conspicuously for fossil ages in the range below about 10,000 years; but would not alter the general conclusions to be discussed in the remainder of this paper.
Racemization rate constants cannot be determined theoretically, but must be calculated empirically from D/L ratio measurements made at two different times. Since racemization rate constants are so small under normal environmental circumstances, racemization may be accelerated by subjecting the sample to an interval of heating in a laboratory, with extrapolation from the rapid racemization and epimerization that occurs at elevated temperature to the much lower rate characteristic of the normal environment. An example of this temperature dependency is given by Equation (5) which specifies the racemization rate constant for isoleucine in foraminifera shell, expressed as chance per molecule per year in terms of T in degrees Celsius (Centigrade) (Bada and Schroeder 1972, Wehmiller et al. 1976).
According to this relationship a one-degree increase in temperature at 23ºC produces nearly 16% increase in the racemization rate.
In some cases rate constants extrapolated from high temperature racemization in the laboratory have produced an age estimate in satisfactory agreement with the accepted geochronologic age of a fossil (e.g., Hare and Mitterer 1968), but more often racemization rates based on laboratory or recent historical data yield fossil ages much less than the accepted geochronologic age. For example, amino acids with D/L ratios less than 1.00 have been found in Green River Formation (Wyoming) oil shale (Kvenvolden 1975). All amino acids from the organic material that produced the oil in this shale should have become racemic long before the 40-60 million years specified by the Eocene age of this formation. The apparent implication is that either the geochronologic age is incorrect or the samples were contaminated by recent organic material. Some fossil shells of Miocene age (10-25 million geochronologic years) have been reported to contain amino acids with a D/L ratio nearly equal to unity (Hare and Abelson 1967).
SUMMARY OF RACEMIZATION RATES IN RELATION TO FOSSIL AGE
Racemization rate constants for aspartic acid and for isoleucine, derived by equations(3) and (4) with zero t=0 constant, from D/L ratio and associated fossil age data that have been published in the readily accessible literature, are plotted in figures(3) and (4). The four magnitude (104) range of data for both rate constant and age require a logarithmic scale on each axis. These data include mollusk shells, foraminifera shells, foraminifera ooze, coral, bones, wood, and parchment (Dead Sea Scrolls). With a few exceptions among ages in the less than 6000 years range, the age assignments are based on radiosotope data, either carbon-14 or disequilibrium of uranium daughter products. The specimens represented in figures (3) and (4) were obtained from a wide range of arctic, desert, temperate, and ocean floor environments. Some of them may have inconsistent age assignments.
The most impressive immediate impact of these plots is that for a particular amino acid there is no characteristic racemization rate constant that can be used to estimate the age of every fossil containing that amino acid. If each amino acid could be described by a characteristic racemization rate constant as a component of fossil protein, the data points in figures(3) and (4) would cluster about a horizontal line. The demonstrated clustering about a line which slopes downward indicates that the apparent racemization rate constant is actually not a constant, but is related to fossil age, diminishing as age increases. This observation has been made frequently in the literature (e.g., Lajoie et al. 1980, Bada and Schroeder 1972, King and Hare 1972, Wehmiller and Hare 1971, Hare and Mitterer 1966).
Given the sensitivity of racemization rate to temperature, could the general trend in figures (3) and (4) indicate that the older a fossil the lower the average storage temperature it has experienced? That is, do these data indicate that the mean temperature of the environment has been increasing over the time span covered by non-racemic D/L ratios? The isoleucine racemization rate in Figure4 ranges from about 4×10⁻⁵ yr-1 to about 0.025×10⁻⁵ yr-1, or about 160-fold, between fossil ages 3000 and 2,000,000 years. Using 7ºC as a mean annual temperature for modern times, Equation (5) specifies an effective average storage temperature of -19ºC for a 160-fold reduction. Due to the exponential dependency of racemization rate on temperature, the mean temperature during a large portion of the storage time would have to be lower than -19ºC to establish a -19ºC effective average between +7ºC and the beginning of storage. For 17ºC, rather than 7ºC, as a mean annual modern temperature, the corresponding effective average storage temperature would be -11ºC. These simplified estimates fully establish that the pattern of figures (3) and (4) cannot be explained on the basis of lower temperature on land and on the ocean floor in the past (Miller and Hare 1980, p. 431). Other factors that may account for the pattern of figures (3) and (4) will be considered subsequently.
It has been asserted that amino acid age dating corroborates radiocarbon ages and age assignments based on disequilibrium of uranium decay products (e.g., King and Hare 1972, Bada and Deems 1975, Blake 1980). The basis for such claims may be illustrated from Figure4. In Figure4 a racemization rate constant in the vicinity of 0.2×10⁻⁵ yr-1 is associated with samples of assigned age ranging from about 10,000 years to about 700,000 years. Accordingly it is evident that a set of specimens can be obtained, or fortuitously acquired, for which a racemization rate constant derived from the D/L ratio in any one will predict the "correct" age when applied to any other member of the set. On the other hand, within the 10,000-700,000 year age range on Figure4 one can select a sample set each of which has an assigned age of 80,000 years but has a racemization rate constant in the range between about 0.06×10⁻⁵ yr-1 and 2.0×10⁻⁵ yr-1. For the Dead Sea Scrolls aspartic acid data set plotted in Figure3 some samples located within one centimeter of each other on the same piece of parchment have D/L ratios that differ by factors of 1.7× to 3.9× (racemization rate constant ratios 1.8× to 4.0× ) (Weiner et al. 1980).
With this simplified introduction to a highly complex topic one can appreciate the following comments from a paper presented at the 1978 conference on Advances in Biogeochemistry of Amino Acids (Miller and Hare 1980, pp. 416, 439): "... racemization 'dates' should probably be regarded only as preliminary estimates unless corroborated by other independent criteria"; "Extrapolation based on 14C dated samples to older samples must be considered tenuous...."
FACTORS AFFECTING RACEMIZATION RATE
From Figures (3) and (4) it is apparent that for any specific amino acid there is not one characteristic racemization rate constant that is appropriate for all ordinary circumstances at all times, as is the case for radioisotope dating. The racemization rate of an amino acid has been determined to be dependent on the following factors (Smith and Evans 1980, Kriausakul and Mitterer 1980a, 1980b).
Temperature
Water concentration in the environment
pH (acidity/alkalinity) in the environment
Bound state versus free state
Size of the macromolecule, if in a bound state
Specific location in the macromolecule, if in a bound state
Contact with clay surfaces (catalytic effect)
Presence of aldehydes, particularly when associated with metal ions
Concentration of buffer compounds
Ionic strength of the environment
Another complicating factor that may be encountered in the dating of bone and sediment without isolation of the bound amino acids from the free amino acids is the D-amino acid, particularly alanine, which may be produced by bacteria (Pollock and Kvenvolden 1978, Kessels and Dugworth 1980). This complication can be avoided by restricting analysis to amino acids or amino acid components which are unlikely to have been affected by bacteria, or to samples which do not contain excess amounts of the amino acids that are characteristic of bacterial activity.
It is apparent that any D/L ratio in a fossil represents both the age of the fossil and the environmental circumstances under which it has been preserved. If the significant environmental factors can be specified with certainty throughout the entire history of the fossil, the real-time age of the fossil can be derived from a D/L ratio and a corresponding racemization rate constant that has been determined for an equivalent environment. If the age is known, the rate constant derived from a D/L measurement might provide a significant intimation concerning the past environment, e.g., paleotemperature (Bada et al. 1973, Schroeder and Bada 1973, Bender 1974, Mitterer 1975, Wehmiller 1977).
In consideration of the ten factors listed above, it is evident that equations (3) and (4) yield an effective average k that represents the combination of a large number of specific rate constants that have been descriptive of various individual amino acid molecules at different times throughout the history of a specimen. On the basis of this insight one can expect that during the early history of a fossil D-amino acids will accumulate relatively rapidly from L-molecules that may be described by a relatively high value of k, and that as time progresses accumulation will be increasingly limited to L-molecules associated with lower values of k. Such a model is the favored explanation for the pattern displayed in figures (3) and (4).
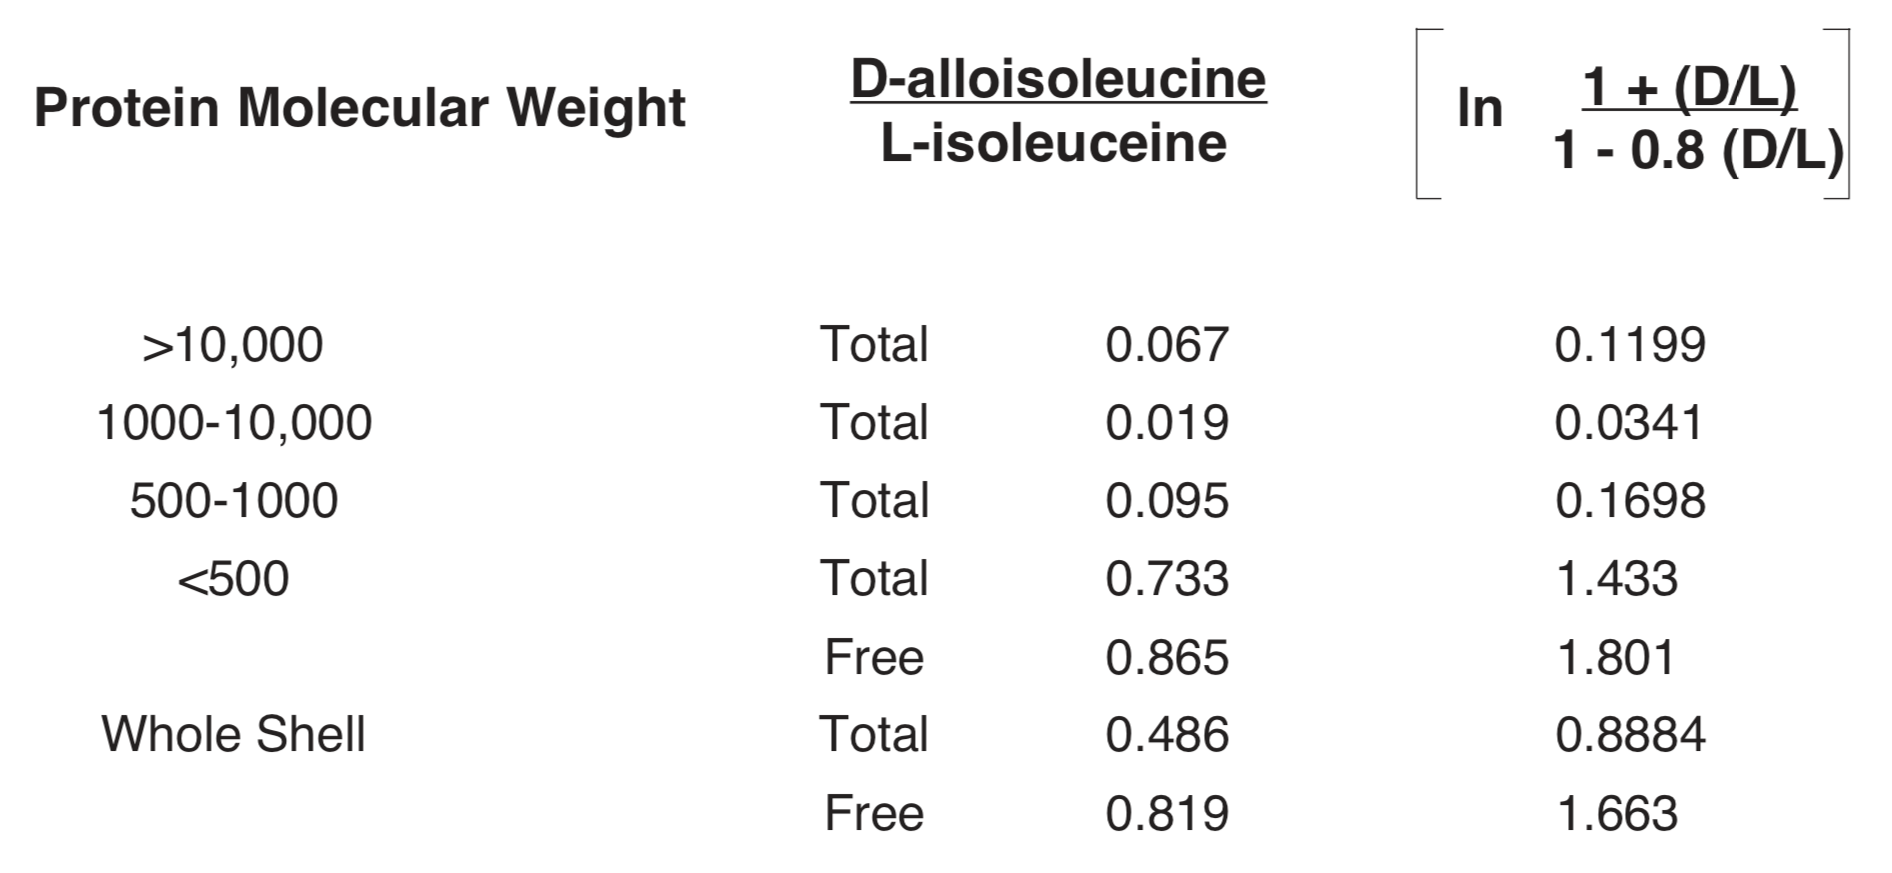
In relation to this model an investigation of the D-alloisoleucine/L-isoleucine ratio as a function of molecule size in protein from a Late Pleistocene Mercenaria shell (putative age in the 10-300 thousand year range) yielded the data in Table1 (Kriausakul and Mitterer 1980a). On the basis of the D/L ratio for the total shell, from Figure4 this shell could be assigned an age anywhere in the range between about 30,000 years and about 2,000,000 years. The maximum ratio of logarithms from column 3 is 53/1 (<500 fraction free, to 1000-10,000 fraction total). Whatever the age of this shell, the racemization rate constants would have a corresponding ratio of 53/1. The highest ratio at any age in Figure4 is 30/1 at 80,000 years. The ratio to be accounted for over the total range of fossil age in Figure4 is about 2000/1. Since the observed range of variation in k at any particular fossil age is much less, and over the total range of fossil age is much greater, than the range allowed by the available data on racemization rate as a function of protein molecule size, explanation of the pattern displayed in figures (3) and (4) in terms of a progressive decline in the effective average value of k is at least questionable.
TABLE 1. Racemization (Epimerization) in a Fossil Mercenaria Shell as a Function of Protein Molecule Size. Whole shell and molecular weight fraction 500 contain free amino acids, in addition to amino acids bound in protein molecules.
As an alternative to the model based on D-amino acid accumulation becoming increasingly limited to L-molecules initially associated with lower k, one could propose that as a fossil ages the breakdown of proteins continually renews the supply of L-molecules in locations with the higher values of k. If such were the case, the effective average value of k for the sample could be more nearly constant, rather than changing 2000-fold, as suggested by Figure4, or 700-fold, as suggested by Figure3. It is significant that temperature, water concentration, and alkalinity to which the racemization rate in a fossil is particularly sensitive are also factors which are particularly conducive to the breakdown of larger protein molecules to smaller components. Before conclusions may be drawn with confidence concerning change of the average racemization rate with time we should have studies such as that represented in Table 1 for each of several samples with well-determined fossil age assignments ranging from 5000 years to 1,000,000 years.
VALIDITY OF FOSSIL AGE ASSIGNMENTS
In a discussion of disagreement between fossil age as projected from amino acid D/L data and as based on radioisotope data, Bender (1974) has said "The differences [re 14C age] can be reconciled if it is assumed that the 14C age [of the sample under discussion] is wrong, but such an assertion would undermine other conclusions." With similar reasoning the progressive decline of racemization constants in figures (3) and (4) might be taken as an indication that the fossil age assignments are progressively excessive. This possibility is clearly indicated if the average probability for conversion of L-amino acids to the D-form in a sample actually remains roughly the same from century to century. Many difficulties would be resolved, and much anomalous data would be reconciled if fossil ages were adjusted to make the data points in figures (3) and (4) scatter about a horizontal line, rather than a line sloping downwards. While the data discussed in this paper provide an adequate scientific basis for such an adjustment, the extent to which it "would undermine other conclusions" is a price very few members of the scientific community would be willing to pay. The course of preference is to assign the apparent inverse relationship between effective average racemization rate constant and fossil age to some time-dependent factor that is not yet fully understood.
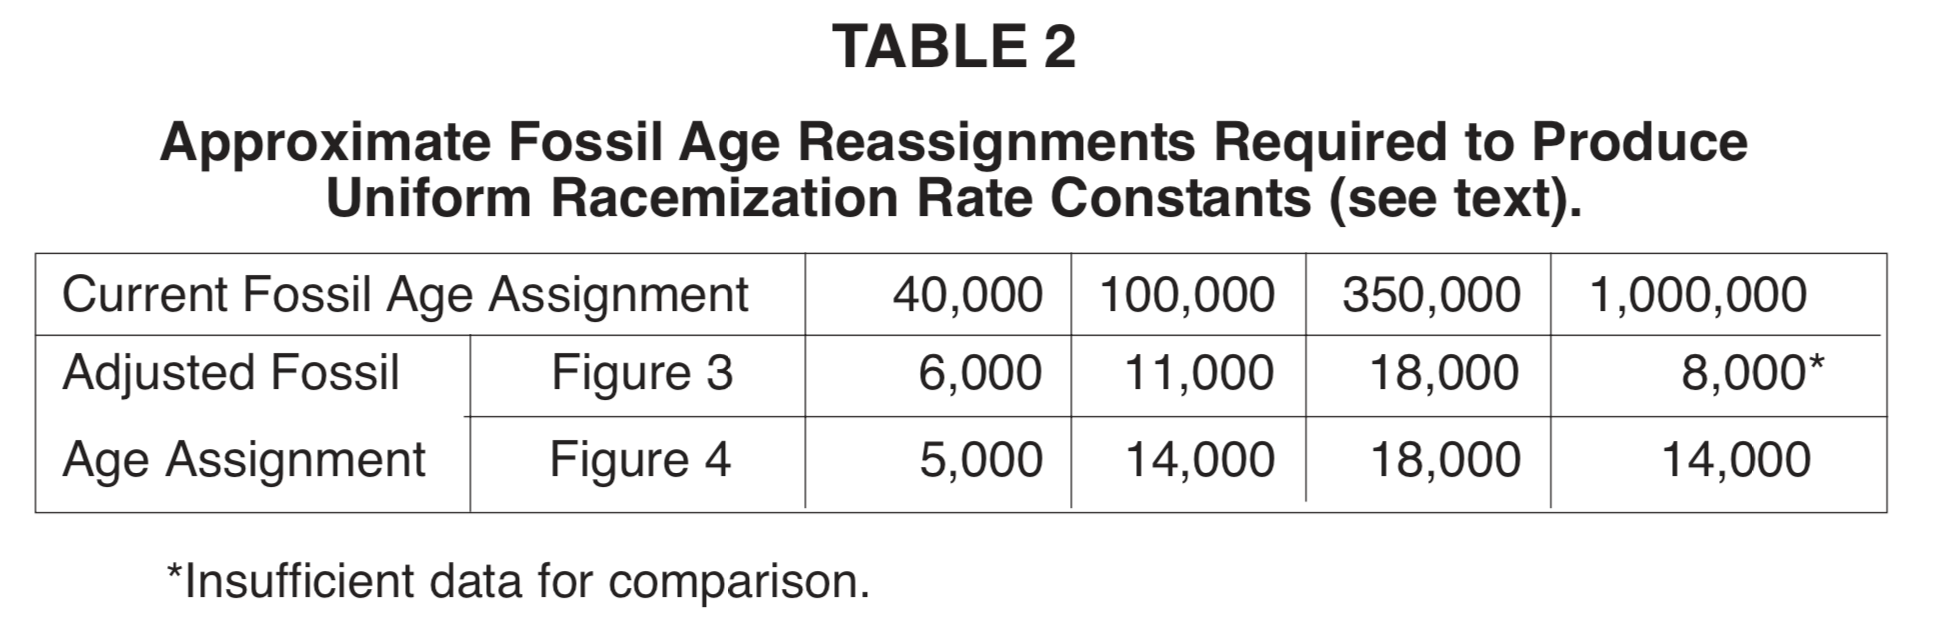
To make the data points in figures (3) and (4) scatter about a horizontal line would require the reassignment of fossil ages approximately as indicated in Table2. The rough estimates given in Table2 are presented here for their possible interest, without any claim as to their significance. A more sophisticated data analysis would be required before such claims should be made.
TABLE 2. Approximate Fossil Age Reassignments Required to Produce Uniform Racemization Rate Constants (see text).
CONCLUSIONS
Thirty years of investigation into the potential for using amino acid data as indicators of fossil age has demonstrated that fossils of similar characteristics and which have experienced similar conditions of preservation can be placed in a relative age sequence on the basis of D/L ratios. Due to the strong dependency of racemization rates on temperature, water concentration, and alkalinity, uncertainties regarding conditions of preservation can leave age relationships among even similar fossils open to question. When age relationships can be established on a firm independent basis, in some cases D/L ratios can be a guide to paleotemperature.
At the present time there is insufficient knowledge concerning the effective average racemization rate in a sample as a function of time to justify dependence on D/L ratios for a quantitative determination of fossil age. The present status of amino acid dating can be summarized by the conclusion from the 19th International Symposium on Archeometry and Archaeological Prospection that "the time when [amino acid racemization] can provide a problem-free dating service is still some way off" (Hedges 1979). The literature since 1979 indicates an increasing awareness of the uncertainties in using amino acid D/L ratios as indicators of age.
In addition to the wide range of fossil age associated with a given value of a racemization rate constant and the wide range of racemization rate constant associated with a given fossil age, there is a dominant trend for the effective racemization rate constant to decrease with putative fossil age. This relationship, together with the demonstrated survival of amino acids in fossils from the Paleozoic era, raises a question concerning the accuracy with which radioisotope age data have been used to represent the real-time history of fossils.
ACKNOWLEDGEMENT
I am deeply indebted to reviewers of this paper for suggestions that have contributed to readability for the general reader and rigor for the specialist. To these reviewers, and also all readers, I must express my regret at not having the skill or patience to meet these goals more fully.
REFERENCES
Abelson, Philip H. 1955. Paleobiochemistry. Carnegie Institution of Washington Year Book 54 (1954-1955), pp. 107-109.
Abelson, Philip H. 1956. Paleobiochemistry. Scientific American 195(1):83-92.
Abelson, Philip H. 1957. Some aspects of paleobiochemistry. Annals of the New York Academy of Sciences 69:276-285.
Akiyama, M. and R. W. G. Wyckoff. 1970. Total amino acid content of fossil pectin shells. Proceedings of the National Academy of Science (USA) 67, pp. 1097-1100.
Bada, Jeffrey L. 1981. Racemization of amino acids in fossil bones and teeth from the Olduvai Gorge region Tanzania, East Africa. Earth and Planetary Science Letters 55:292-298.
Bada, Jeffrey L. and Lydia Deems. 1975. Accuracy of dates beyond the 14C dating limit using the aspartic acid racemization reaction. Nature 255:218, 219.
Bada, Jeffrey L. and Reiner Protsch. 1973. Racemization reaction of aspartic acid and its use in dating fossil bones. Proceedings of the National Academy of Science 70:1331-1334.
Bada, Jeffrey L. and Roy A. Schroeder. 1972. Racemization of isoleucine in calcareous marine sediments: kinetics and mechanism. Earth and Planetary Science Letters 15:1-11.
Bada, Jeffrey L. and M.-Y. Shou. 1980. Kinetics and mechanisms of amino acid racemization in aqueous solution and bones. In Hare et al. 1980, pp. 235-255.
Bada, Jeffrey L., Reiner Protsch, and Roy A. Schroeder. 1973. The racemization reaction of isoleucine used as a paleotemperature indicator. Nature 241:394-395.
Bada, J. L., R. Gillespie, J. A. J. Gowlett, and R. E. M. Hedges. 1984. Accelerator mass spectrometry radiocarbon ages of amino acid extracts from California palaeoindian skeletons. Nature 312:442-443.
Bender, Michael L. 1974. Reliability of amino acid racemization dating and paleotemperature analysis of bones. Nature 252:378-381.
Bischoff, James L. and W. Morlin Childers. 1979. Temperature calibration of amino acid racemization: age implication for the Yuha skeleton. Earth and Planetary Science Letters 45:172-180.
Blake, Weston, Jr. 1980. Application of amino acid ratios to studies of Quaternary geology in the high Arctic. In Hare et al. 1980, pp. 453-461.
Florkin, M. 1969. Fossil shell "concholin" and other preserved biopolymers. In G. Eglinton and M. T. J. Murphy (eds.), Organic Geochemistry Methods and Results, chapter 20, pp. 498-520. Springer Verlag, New York and Amsterdam.
Hare, P. E. and P. H. Abelson. 1965. Amino acid composition of some calcified proteins. Carnegie Institution of Washington Year Book 64 (1964-1965), pp. 223-232.
Hare, P. E. and P. H. Abelson. 1967. Racemization of amino acids in fossil shells. Carnegie Institution of Washington Year Book 66 (1966-1967), pp. 526-528.
Hare, P. E., T. C. Hoering, and K. King, Jr. (eds.). 1980. Biogeochemistry of Amino Acids. John Wiley & Sons, New York.
Hare, P. E. and R. M. Mitterer. 1966. Non-protein amino acids in fossil shells. Carnegie Institution of Washington Year Book 65 (1965-1966), pp. 362-364.
Hare, P. E. and R. M. Mitterer. 1968. Laboratory simulation of amino acid diagenesis in fossils. Carnegie Institution of Washington Year Book 67 (1967-1968), pp. 205-208.
Hedges, Robert. 1979. Physics in archaeology. Nature 278:691, 692.
Jope, Margaret. 1950. Phylogenetic information derivable from fossil brachiopods. In Hare et al. 1980, pp. 83-94.
Kessels, H. J. and G. Dugworth. 1980. Necessity of reporting amino acid compositions of fossil bones where racemization analyses are used for geochronological applications: inhomogeneities of D/L amino acids in fossil bones. In Hare et al. 1980, pp. 527-541.
King, K., Jr., and P. E. Hare. 1972. Species effects in the epimerization of L-isoleucine in fossil planktonic foraminifera. Carnegie Institution of Washington Year Book 71 (1971-1972), pp. 596-598.
King, Kenneth, Jr., and Jeffrey L. Bada. 1979. Effect of in situ leaching on amino acid racemisation rate in fossil bones. Nature 281:135-137.
King, Kenneth, Jr., and Colleen Neville. 1977. Isoleucine epimerization for dating of marine sediments: importance of analyzing monospecific foraminiferal samples. Science 195:1333-1335.
Kriausakul, Nivat and Richard M. Mitterer. 1980a. Comparison of isoleucine epimerization in a model depeptide and fossil protein. Geochimica et Cosmochimica Acta 44:753-758.
Kriausakul, Nivat and Richard M. Mitterer. 1980b. Some factors affecting the epimerization of isoleucine in peptides and proteins. In Hare et al. 1980, pp. 283-296.
Kvenvolden, Keith A. 1975. Advances in the geochemistry of amino acids. In Fred A. Donath (ed.), Annual Review of Earth and Planetary Science 3:183-212.
Kvenvolden, Keith A. 1980. Interlaboratory comparison of amino acid racemization in a Pleistocene mollusk, Saxidomus giganteus. In Hare et al. 1980, pp. 223-232.
Kvenvolden, Keith A. and David J. Blunt. 1980. Amino acid dating of Saxidomus giganteus at Willapa Bay, Washington by racemization of glutamic acid. In Hare et al. 1980, pp. 393-399.
Kvenvolden, Keith A. and Etta Peterson. 1973. Amino acids in a Late Pleistocene bone from Rancho La Brea, California. Geological Society of America Abstracts 5:704-705.
Kvenvolden, Keith A., David J. Blunt, and Stephen W. Robinson. 1979. Amino acid dating of an archeological site on Amaknak Island, Alaska. Geological Society of America Abstracts 11:462.
Kvenvolden, Keith A., Etta Peterson, John Wehmiller, and P. E. Hare. 1973. Racemization of amino acids in marine sediments determined by gas chromatography. Geochimica at Cosmochimica Acta 37:2215-2225.
Lajoie, Kenneth R., Etta Peterson, and Bert A. Gerow. 1980. Amino acid bone dating: a feasibility study, South San Francisco Bay region, California. In Hare et al. 1980, pp. 477-489.
Lajoie, Kenneth R., John F. Wehmiller, and George F. Kennedy. 1980. Inter- and intrageneric trends in apparent racemization kinetics of amino acids in Quaternary mollusks. In Hare et al. 1980, pp. 305-340.
Lee, Cindy, Jeffrey L. Bada, and Etta Peterson. 1976. Amino acids in modern and fossil woods. Nature 259:183-186.
Masters, Patricia M. and Jeffrey L. Bada. 1977. Racemization of fossil molluscs from the indian middens and interglacial terraces in Southern California. Earth and Planetary Science Letters 37:173-183.
Miller, Gifford H. and Hare, P. E. 1980. Amino acid geochronology: integrity of the carbonate matrix and potential of molluscan fossils. In Hare et al. 1980, pp. 415-443.
Mitterer, Richard M. 1975. Ages and diagenetic temperatures of Pleistocene deposits of Florida based on isoleucine epimerization in Mercenaria. Earth and Planetary Science Letters 28:275-282.
Petit, Michael G. 1974. The racemization rate constant for protein-bound aspartic acid in woodrat middens. Quaternary Research 4:340-345.
Pollock, Glenn E. and Kvenvolden, Keith A. 1978. Stereochemistry of amino acids in surface samples of marine sediment. Geochimca at Cosmochimica Acta 42:1903-1905.
Schroeder, Roy A. and Jeffrey L. Bada. 1973. Glacial-postglacial temperature deduced from aspartic acid racemization in fossil bones. Science 182:479-482.
Smith, Grant Gil and Robert C. Evans. 1980. The effect of structure and conditions on the rate of racemization of free and bound amino acids. In Hare et al. 1980, pp. 257-282.
Stafford, T. W., Jr., A. J. T. Hull, T. H. Zabel, D. J. Donahue, R. C. Duhamel, K. Brendel, C. V. Haynes, Jr., J. L. Bischoff, L. A. Payen, and R. E. Taylor. 1984. Holocene ages of Yuha burial: direct radiocarbon determination by accelerator mass spectrometry. Nature 308:446-447.
Szabo, B. J., G. H. Miller, J. T. Andrews, and M. Stuiver. 1981. Comparison of uranium-series, radiocarbon, and amino acid data from marine molluscs, Baffin Island, Arctic Canada. Geology 9:451-457.
Wehmiller, John F. 1977. Amino acids of the Del Mar, California, midden site: apparent rate constants, ground temperature models, and chronological implications. Earth and Planetary Science Letters 37:184-196.
Wehmiller, J. F. and D. F. Belknap. 1982. Amino acid age estimates, Quaternary Atlantic coastal plain: comparison with U-series dates, biostratigraphy and paleomagnetic control. Quaternary Research 18:311-336.
Wehmiller, J. and P. E. Hare. 1971. Racemization of amino acids in marine sediments. Science 173:907-911.
Wehmiller, John F., P. E. Hare, and G. A. Kujala. 1976. Amino acids in corals: racemization (epimerization) reactions and their implications for diagenetic models and geochronological studies. Geochimica et Cosmochimica Acta 40:763-776.
Weiner, Stephen, Zina Kustanovich, Emanuel Gil-Av, and Wolfie Traub. 1980. Dead Sea Scroll parchments: unfolding of the collagen molecules and racemization of aspartic acid. Nature 287:820-823.
Zumberge, John F., Michael H. Engel, and Bartholomew Nagy. 1980. Amino acids in Bristlecone Pine: an evaluation of factors affecting racemization rates and paleothermometry. In Hare et al. 1980, pp. 503-525.
 in which ln designates "natural logarithm." For enantiomer pairs such as D- and L-aspartic acid which have equal concentrations of the L- and D-forms at equilibrium kL@ kD@ K. For aspartic acid Equation (2) becomes
 For the diastereomer pair D-alloisoleucine and L-isoleucine with kL/kD@ 1.25, Equation (2) becomes
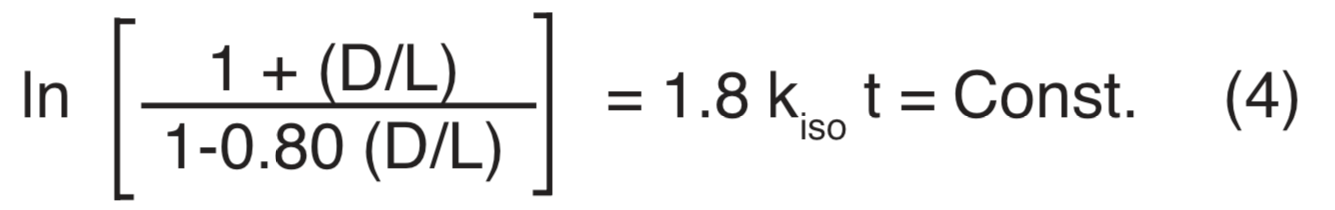 kL/kD@ 1.25 comes from the consideration that at equilibrium kLL = kDD, together with the accepted value of 1.25 for D/L at equilibrium.
 According to this relationship a one-degree increase in temperature at 23ºC produces nearly 16% increase in the racemization rate.