The spontaneous decomposition of amino acids under natural circumstances does not proceed as should be expected if radiocarbon age is actually a measure of real time. This disagreement compounds the uncertainty in using amino acid isomer ratios for age determination, and also brings radiocarbon ages beyond 4000 B. P. into question. By using a radiocarbon age conversion previously published in Origins (17:56-65, 1990), the authors obtain a reasonably good correlation between amino acid isomer ratios and estimated real time. This correlation permits significant conclusions regarding environmental conditions and climatic changes to be drawn from amino acid data on land snail shells from sediments in the Negev.
Introduction
Individuals who accept the historical and literary evidence for the accuracy of the specifications given in the first eleven chapters of the book of Genesis are open to the possibilities for scientifically sound interpretations for the data utilized in the organic radioisotope and biochemical age-dating techniques that have been developed within the last fifty years. Radioisotope data for inorganic material that has replaced plant or animal tissue, or which is associated with the burial of organic material, can be dealt with as a characteristic of inorganic material that originated in creative activity not described in the first chapter of Genesis (Brown 1986). But radiocarbon-age data for ancient organic material must be explained within the time frame for the existence of plant and animal life on this planet. The ratio of right-handed to left-handed amino acids in ancient material must also be explained within the same constraint.
Radiocarbon Age
Some aspects of the harmonization of radiocarbon age data with biblical time constraints have been reviewed in a recent issue of Origins (Brown 1990). In that treatment a mathematical relationship is derived for converting carbon-14 (C-14) dates into real-time ages on a basis that incorporates fully established age data from secular history together with the chronological constraints in the eleventh chapter of Genesis. According to this relationship, a musk ox frozen in Alaskan muck (Stuckenrath and Mielke 1970) had a reasonable life span in the vicinity of fifty years, and perished about 4900 years ago. A one-to-one representation of real time by radiocarbon ages indicates an unreasonable life span in the range between 5000 and 9000 years and death about 17,000 years ago.
Further indication of the soundness of this conversion relationship is provided by recently published amino acid data for land snail shells (Goodfriend 1991a).
Amino Acid Age
The proteins in living organisms are made of amino acids in the left-handed (L) form of the two possible asymmetric (chiral) structures. After death these proteins progressively disintegrate, and in the disintegration process, molecules of amino acids in the right-handed (D) form are produced. As the concentration of proteins diminishes, the ratio of D to L forms of the amino acids increases, approaching an equilibrium ratio at which the rate of D to L conversions equals the rate of L to D conversions. Consequently the D/L ratio of any particular amino acid in a specimen of organic remains is related to the age (time since death) of that specimen. Dating by means of amino acid D/L ratios was reviewed in Origins 12:8-25 (Brown 1985). That review should be read as a background for the present treatment.
In the conclusion of the above-cited review, it is stated that
... there is a dominant trend for the effective racemization [conversion between L and D forms] rate constant to decrease with putative fossil age. This relationship, together with the demonstrated survival of amino acids in fossils from the Paleozoic era, raises a question concerning the accuracy with which radioisotope age data have been used to represent the real-time history of fossils.
The land snail shell data reviewed here support this conclusion and strongly indicate that C-14 ages specify real time only when interpreted in accord with constraints such as those provided by the chronological data in the Bible.
Land Snail Shell Amino Acid Characteristics
A large amount of data for D/L ratios of seven amino acids in 38 samples of land snail shells from rodent burrow middens and stream sediments in the Negev Desert of southern Israel has recently become available (Goodfriend 1991a). These data cover C-14 ages from zero to 10,400 years, and represent a major effort on the part of Dr. Goodfriend and the Ministry of Energy and Infrastructure of Israel.
It has been observed that amino acid D/L ratios do not relate as satisfactorily with C-14 age as they should if C-14 ages directly represent real time (Brown 1985). Goodfriend's best results were obtained with D/L data plotted against the square root of C-14 age. A square-root relationship is justified by empirical results, but is not expected from basic theoretical considerations. It is described by Goodfriend as "apparent parabolic kinetics" (see Mitterer and Kriausakul. 1989). Since a plot of D/L against time is asymptotic to 1/1, or to 1.25/1 for the amino acids which have two carbon atom sites of asymmetry (chirality), some function other than the square root of C-14 age might be more effective in producing a satisfactory treatment of amino acid D/L ratios in ancient materials. These observations suggested our investigation of a treatment based on a biblically consistent conversion from C-14 age data to real time.
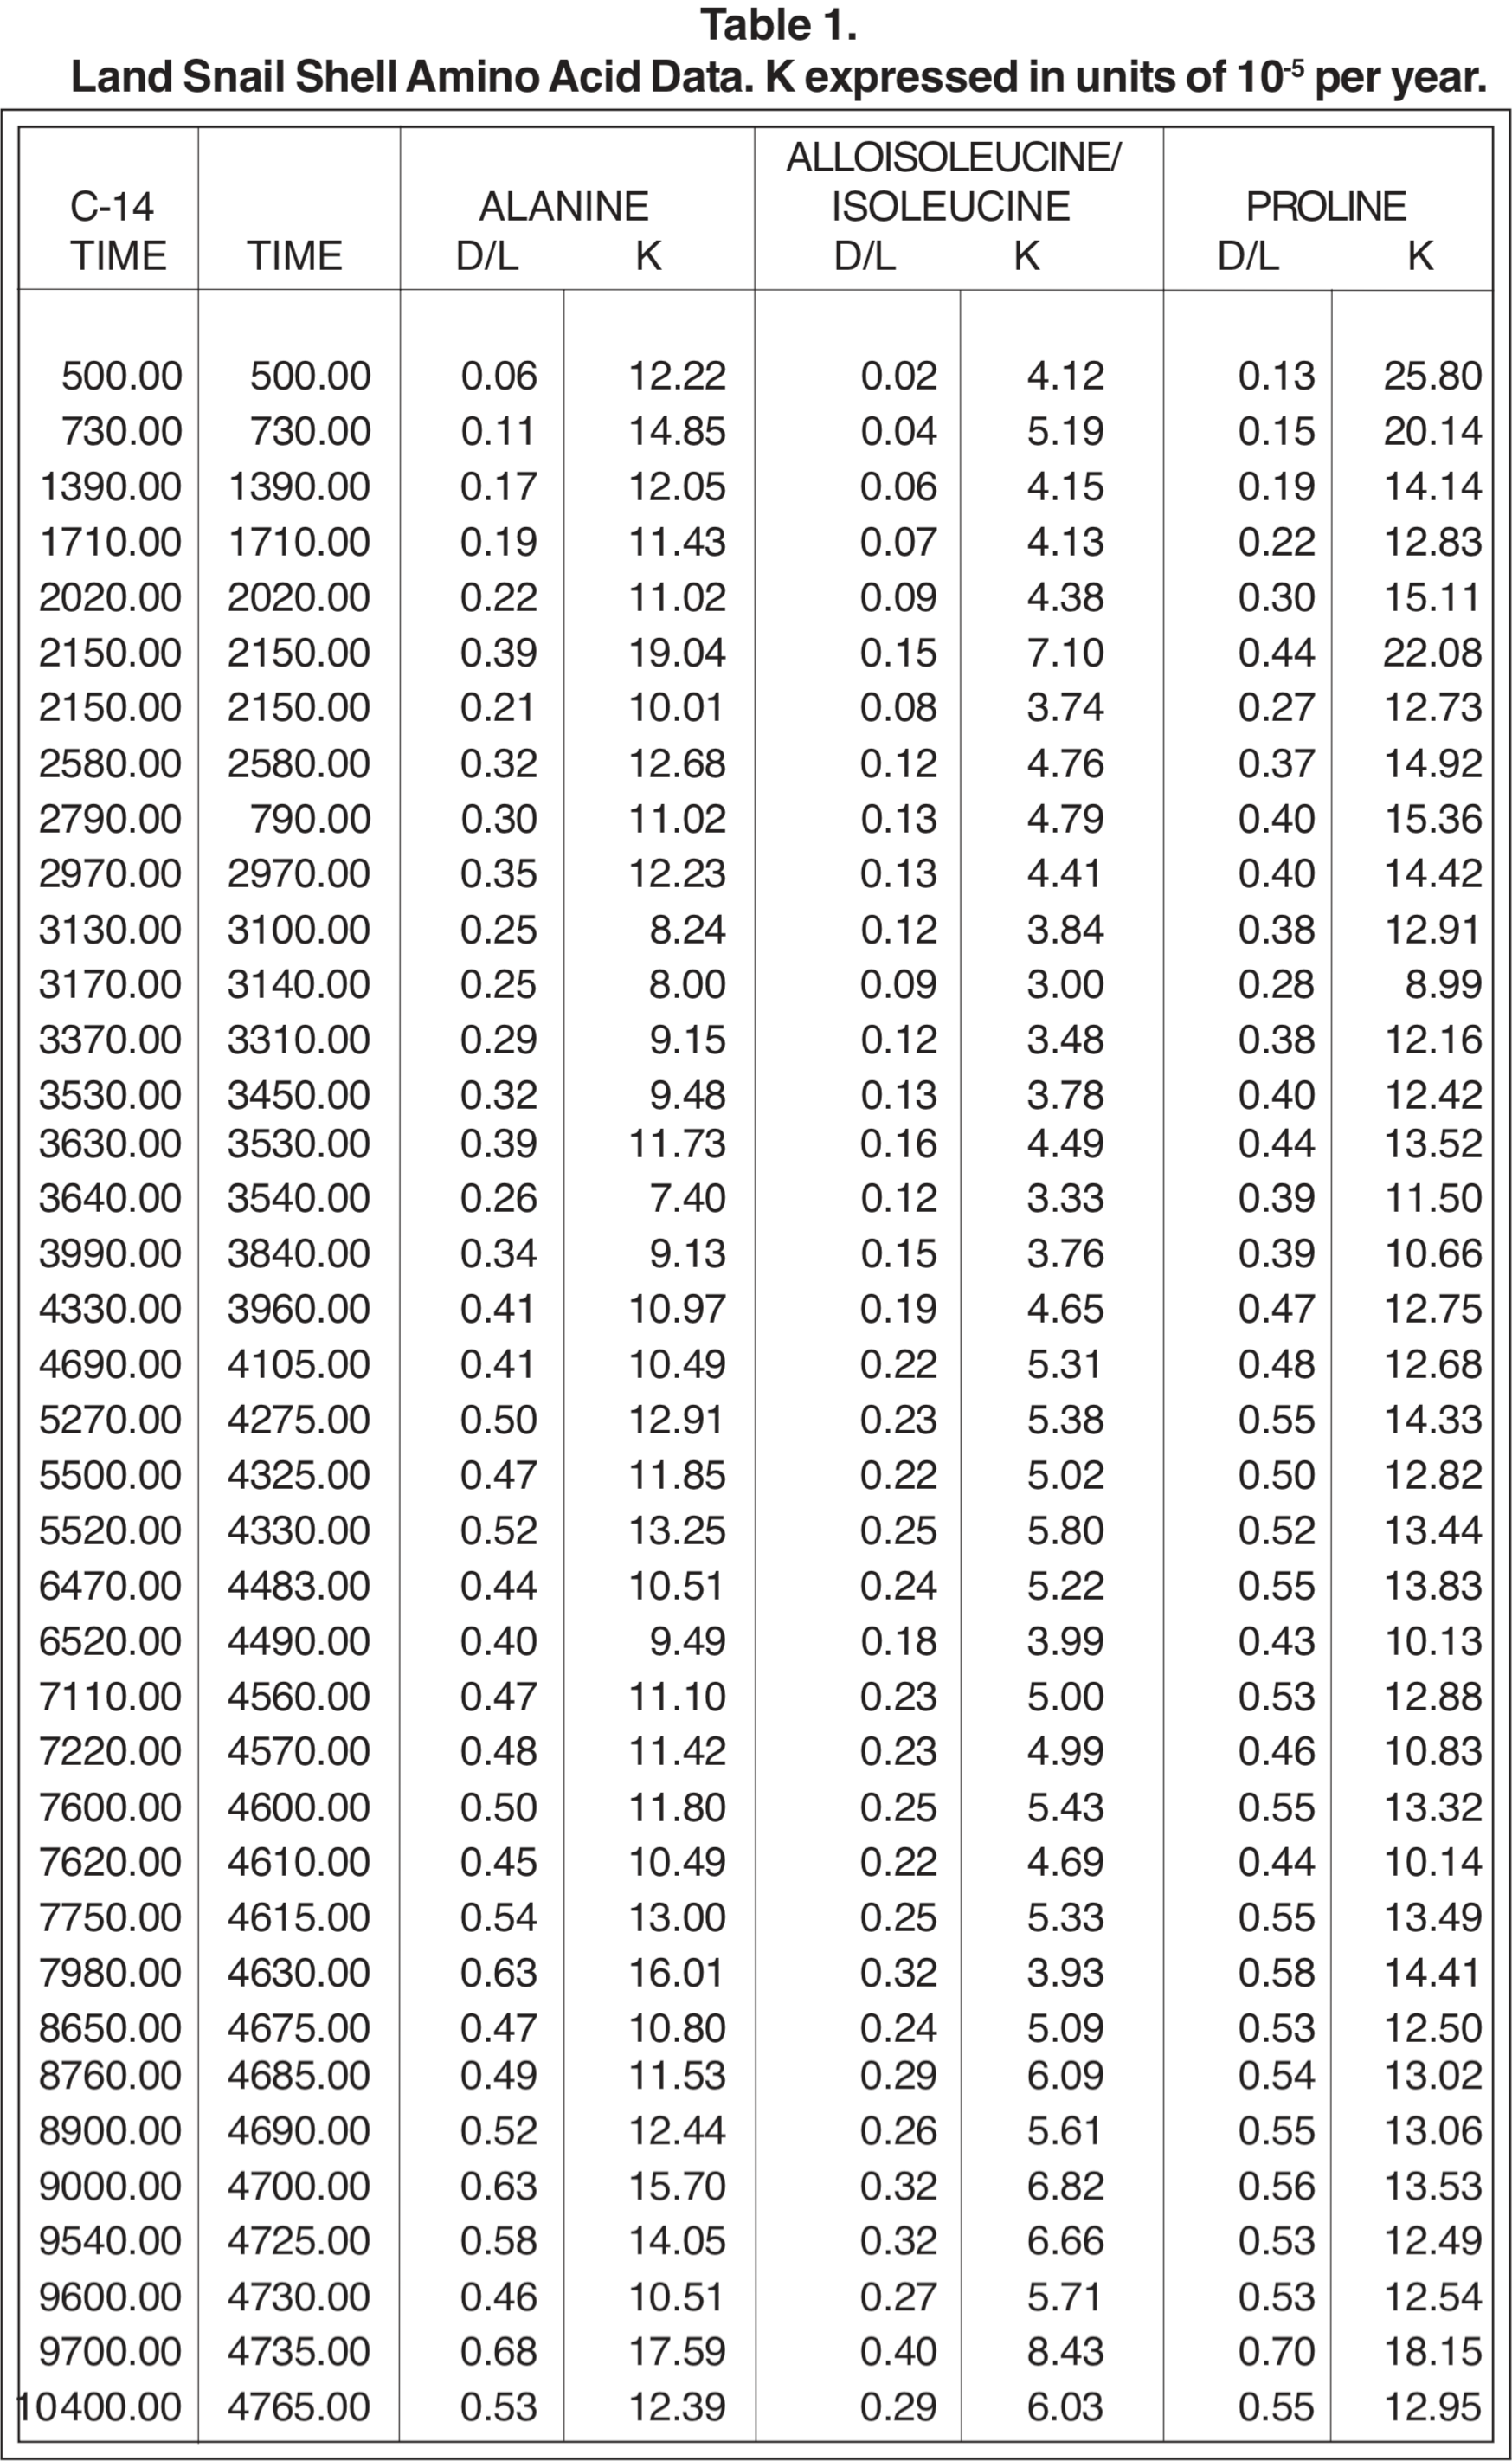
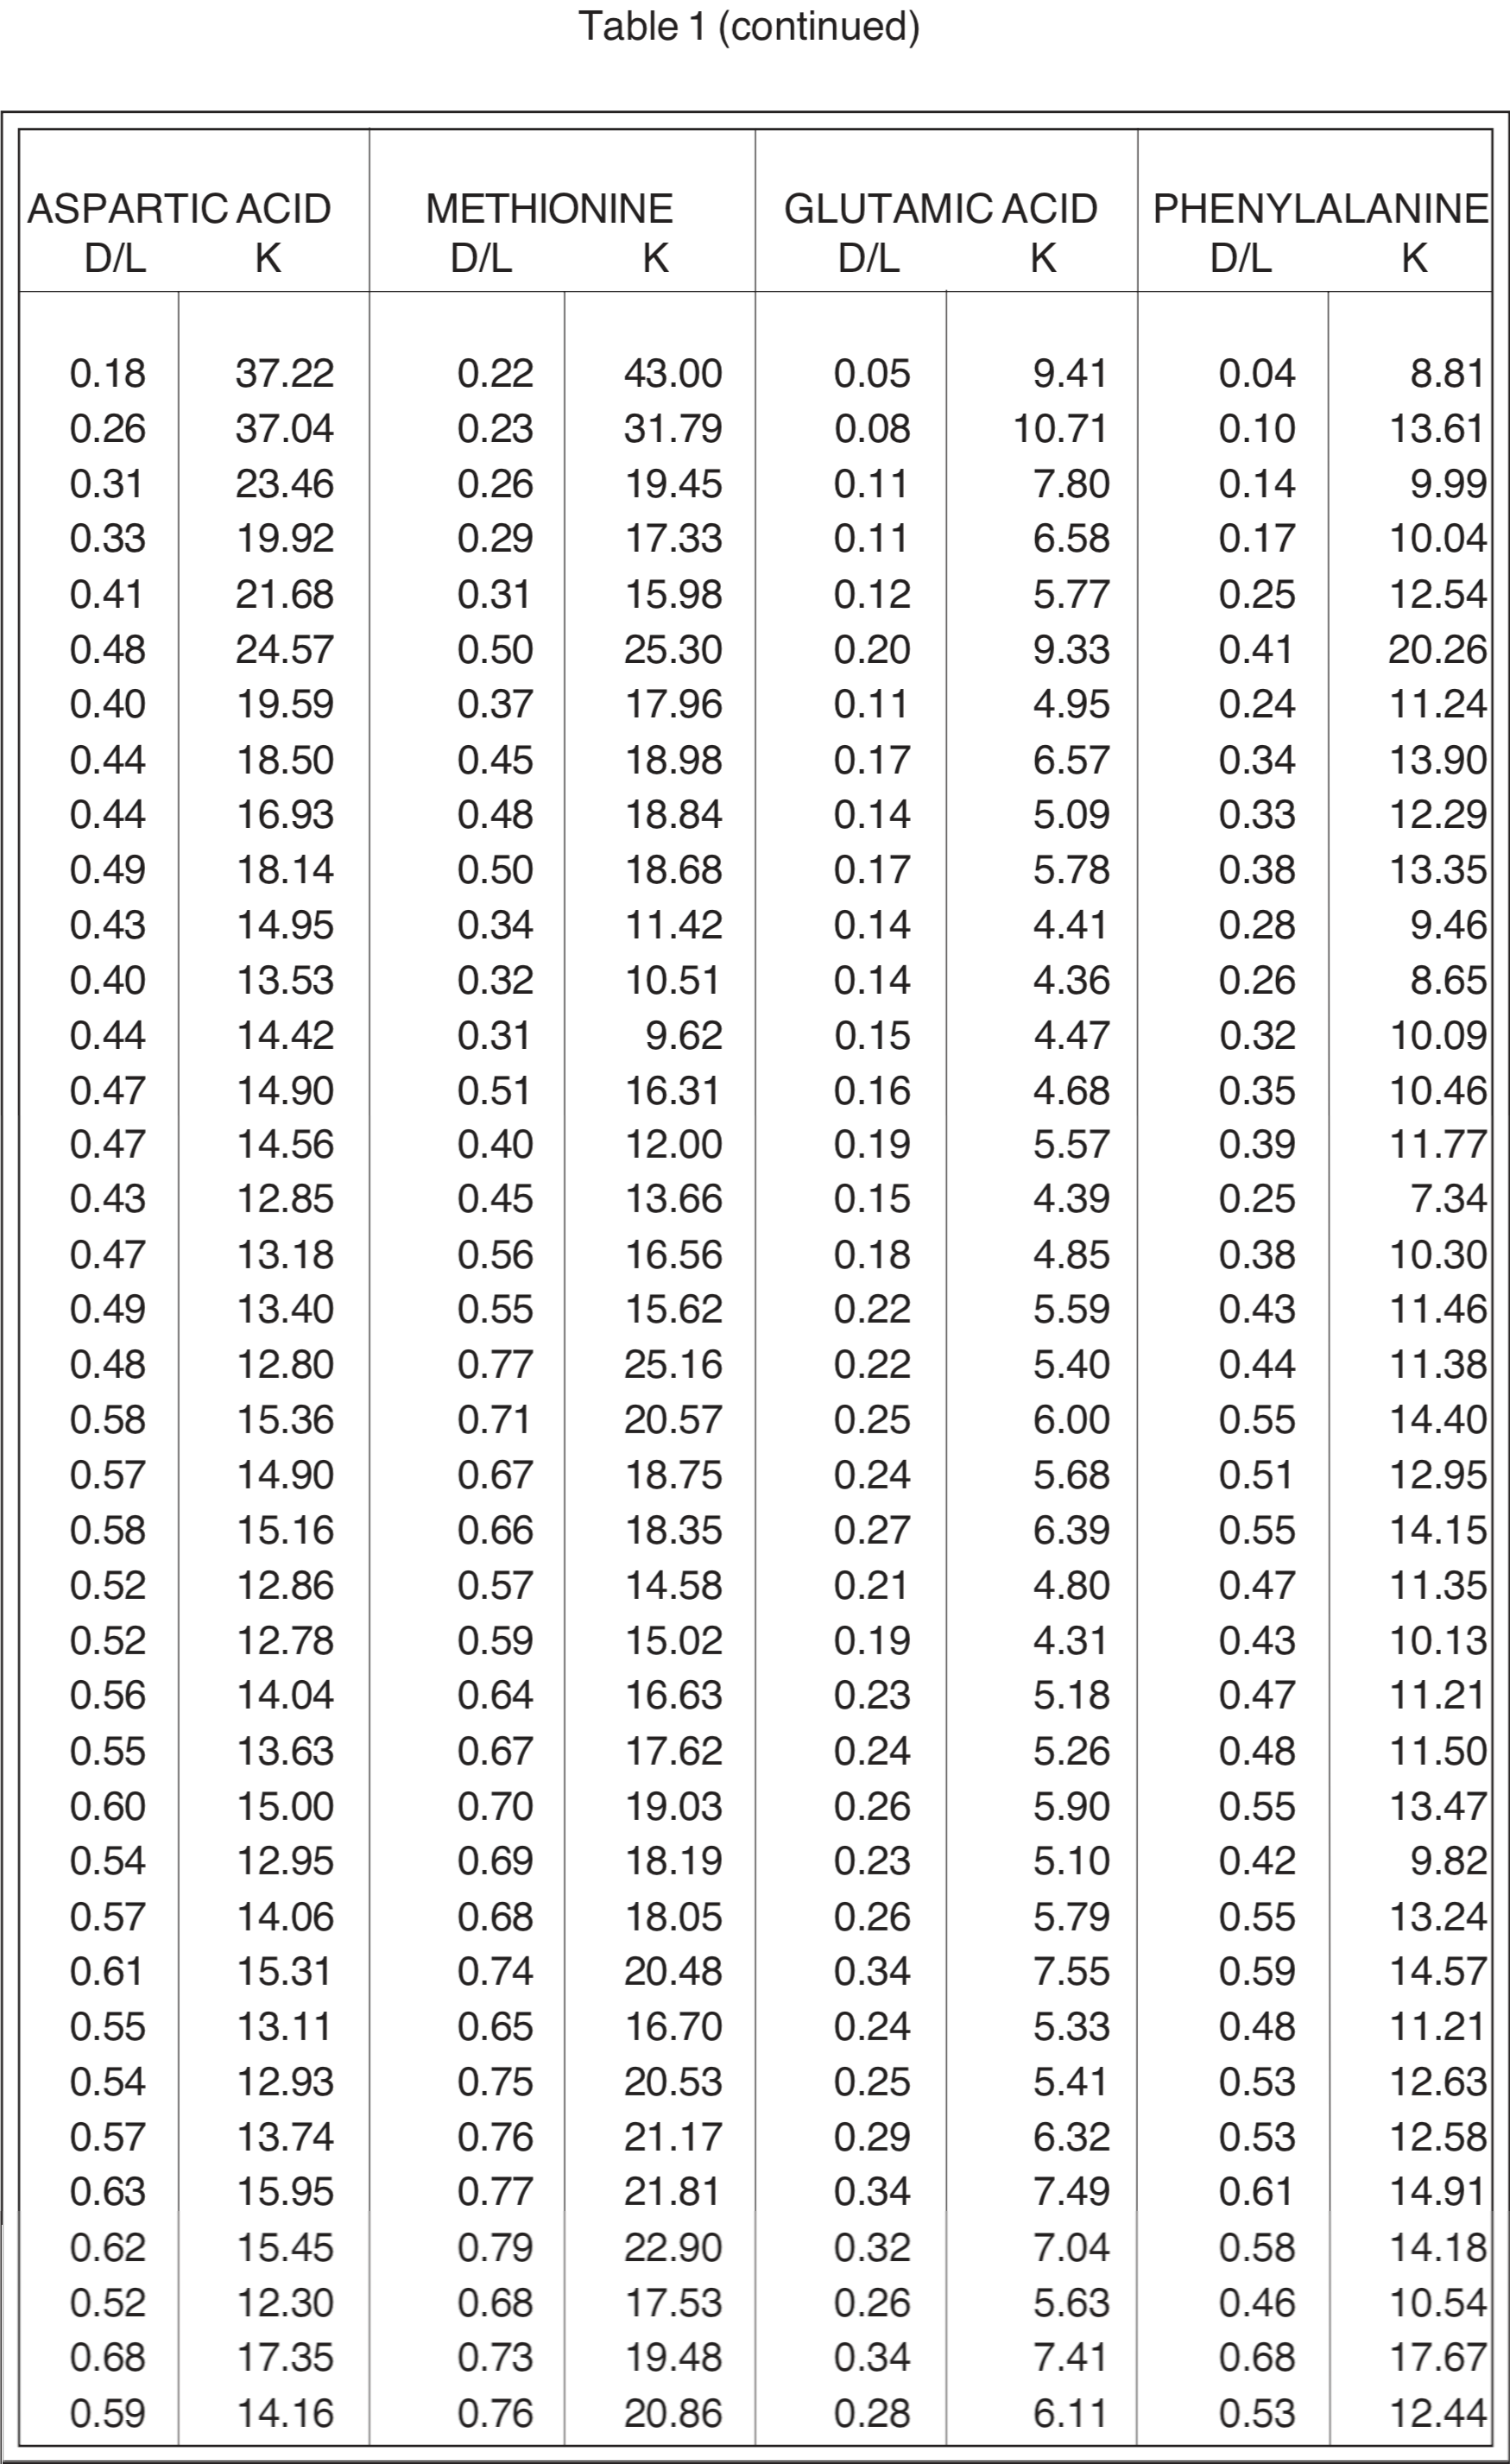
Table 1 reproduces Goodfriend's data for Negev Desert land snail shells, together with the presumed real-time age BP (t) obtained from C-14 age (R) according to Equation 9 from Brown (1990).
(1) R = t + 8300 ln [1 - e-2.996(5000 - t)/1000]-1
(This equation, reproduced as No. 1 above, is based on the Flood at 5000 BP, a negligible biosphere C-14/C-12 ratio at the time of the Flood, and an upper biosphere C-14/C-12 at 4000 BP equal to 95% of the average C-14/C-12 ratio that has been characteristic over the past 3500 years.)
Also given in Table 1 are the corresponding racemization/epimerization rate coefficients (k) based on simple first-order kinetics with negligible D/L ratio at t = 0. For the amino acids which have only one carbon atom site of asymmetry, the characteristic rate coefficient k for conversion from the L form to the D form (racemization) is given by
(2) k = {ln [ (1+D/L) / (1-D/L) ]} / 2t .
For amino acids such as alloisoleucine/isoleucine which have two sites of asymmetry, the corresponding characteristic rate coefficient for conversion (epimerization) is given approximately by
(3) k = {ln [ (1+D/L) / (1-0.8D/L) ]} / 1.80t .
[The theoretical basis for these equations is discussed in Brown (1985).]
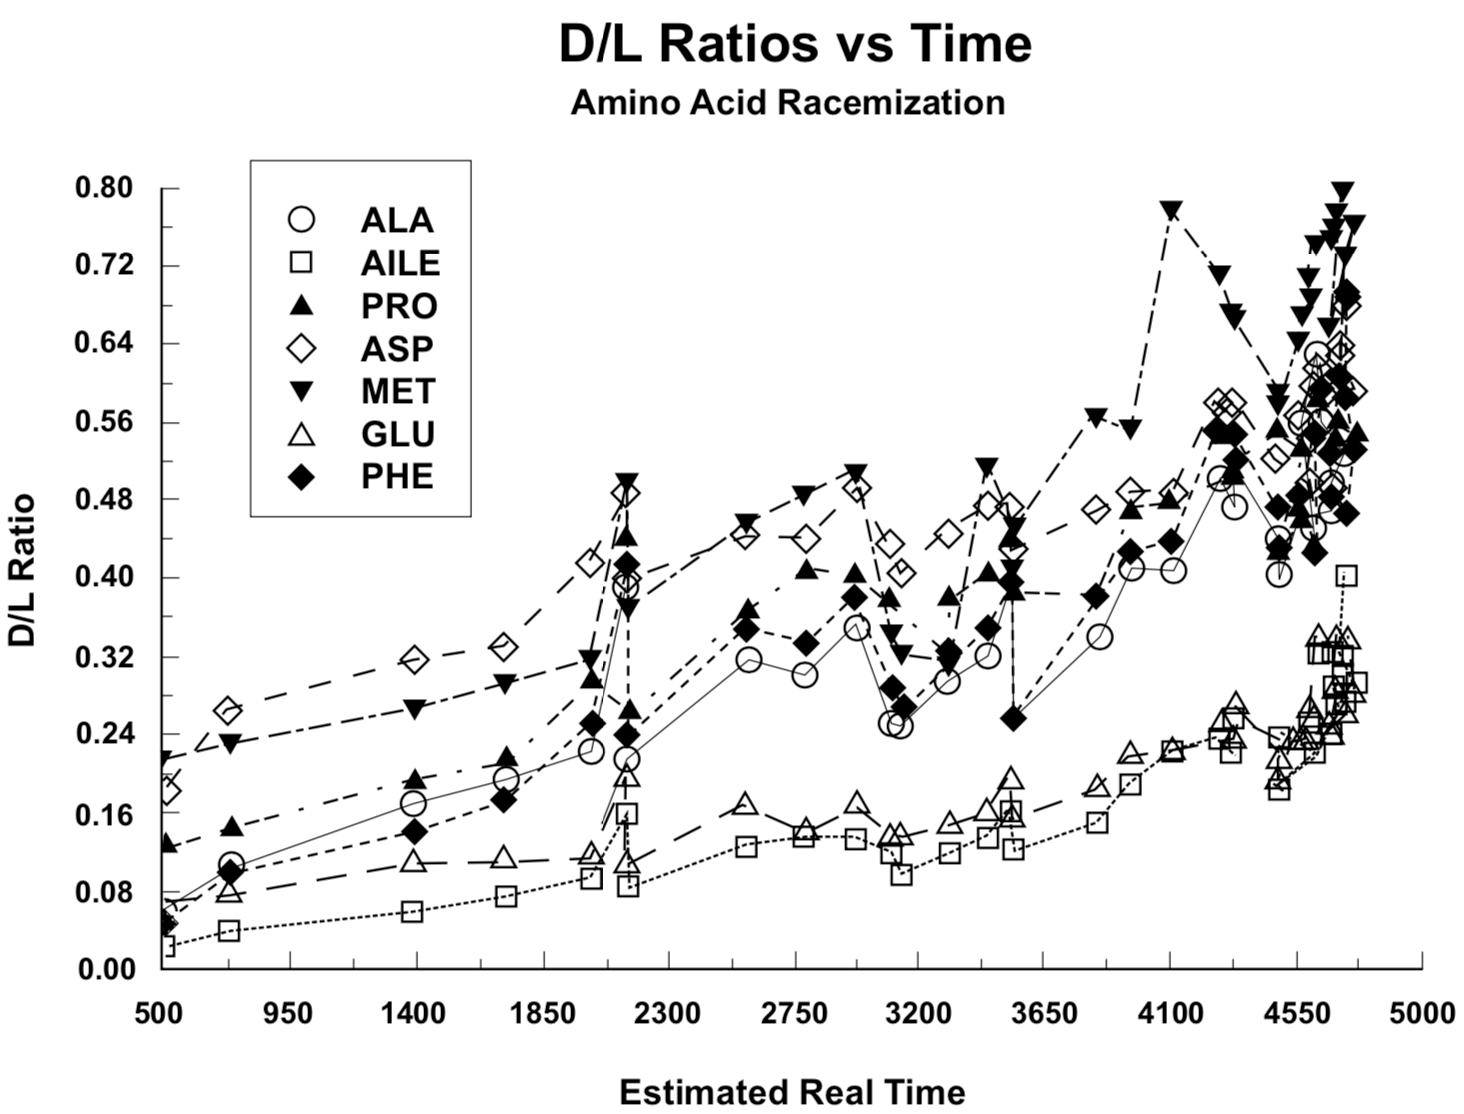
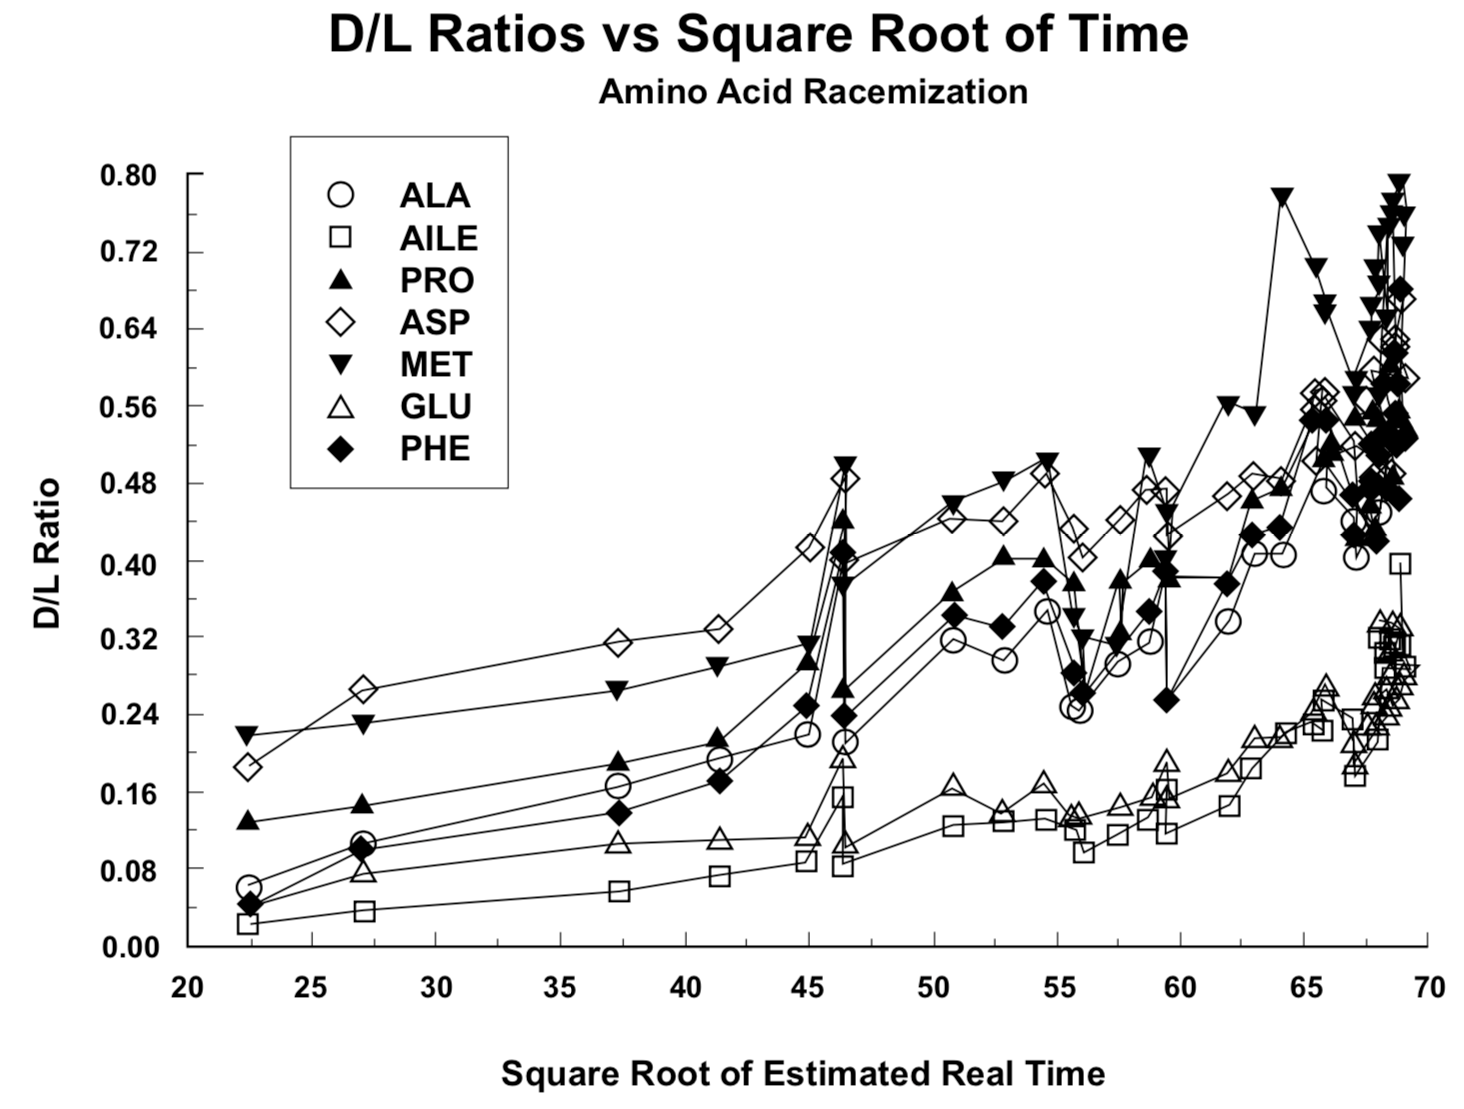
Figure 1. Ratio of right-handed (D) to left-handed (L) residual amino acid molecules in land snail shells versus presumed real-time shell age.Figure 2. Ratio of right-handed (D) to left-handed (L) residual amino acid molecules in land snail shells versus the square root of presumed real-time shell age.
In Figure 1 the D/L ratios from Table 1 are plotted against presumed real time as determined from Equation 1. In Figure 2 these ratios are plotted against the square root of the time values in Figure 1. Because of the asymptotic approach of D/L to a constant value, the data presentation in Figure 2 should follow straight lines more closely than the presentation in Figure 1, as demonstrated by Goodfriend (1991a) and Mitterer and Kriausakul (1989). Goodfriend's plots are not the same as those in Figure 2, because he did not use a conversion from C-14 age to presumed real time.
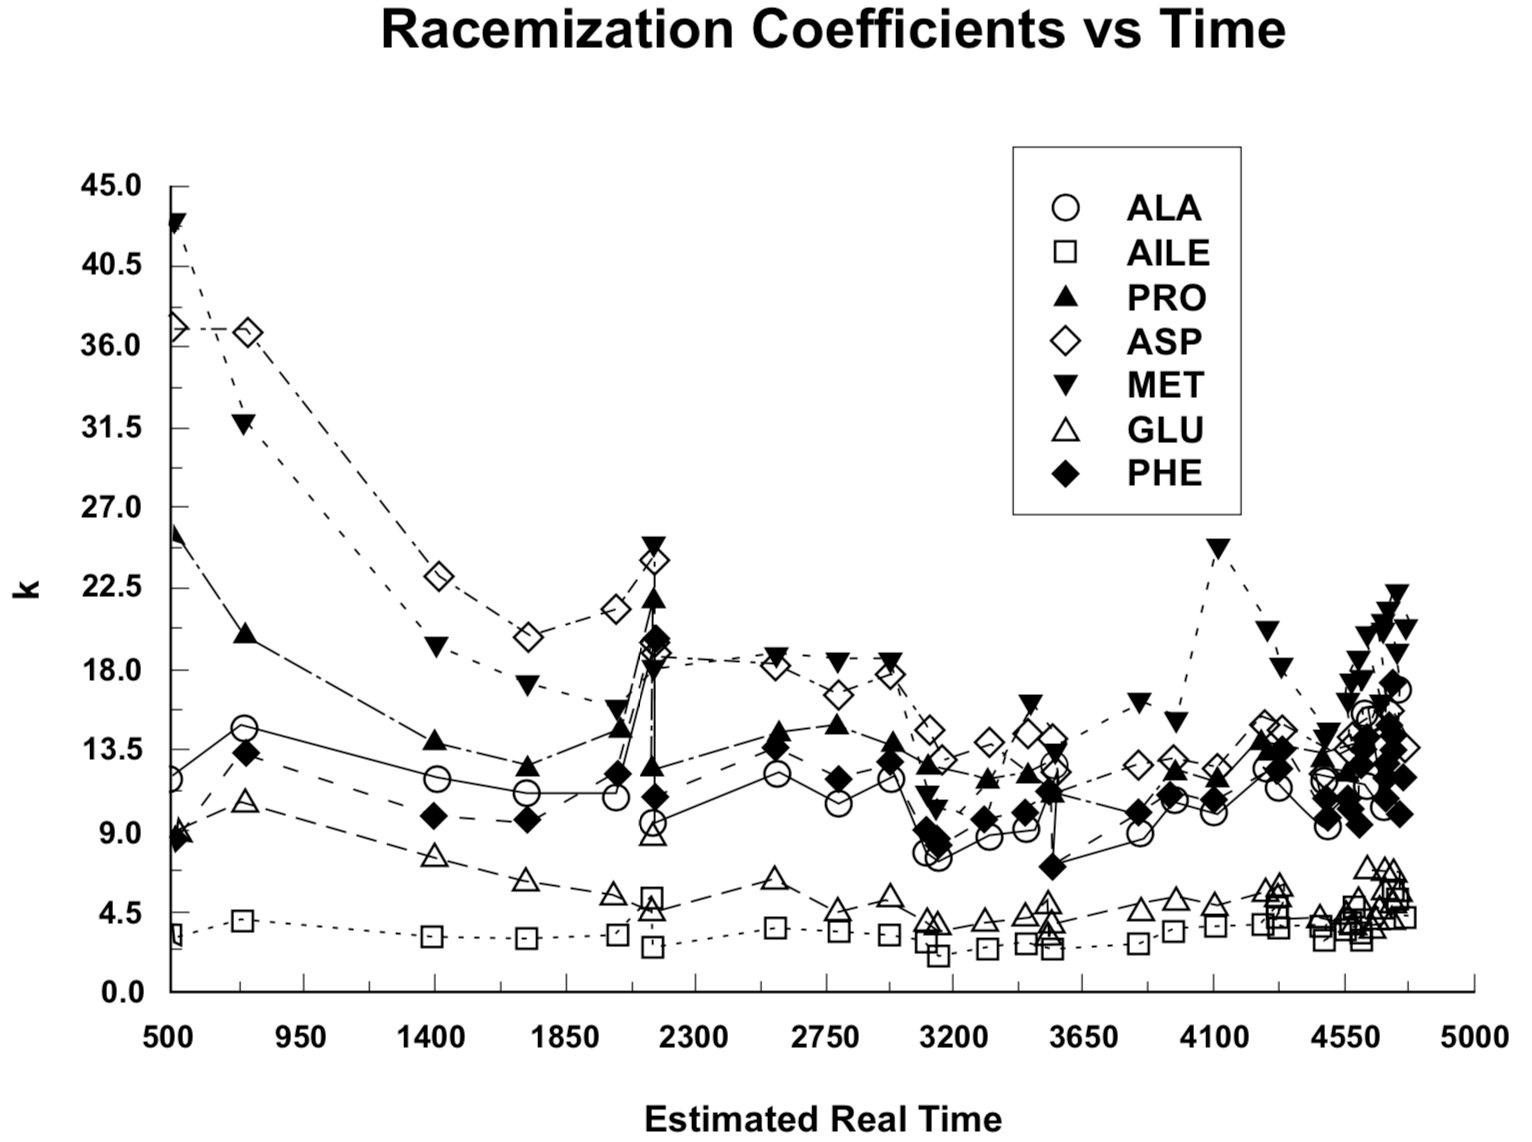
To obtain a more sensitive treatment of the factors involved, we have plotted the racemization/epimerization coefficients, rather than D/L ratios, against presumed real time in Figure 3. If t was at all points a correct representation of real time, and if both the physical and chemical environment were the same for each sample and also unchanged throughout the time range involved, the data points in Figure 3 should describe straight, horizontal lines (constant k) within the range of experimental error involved.
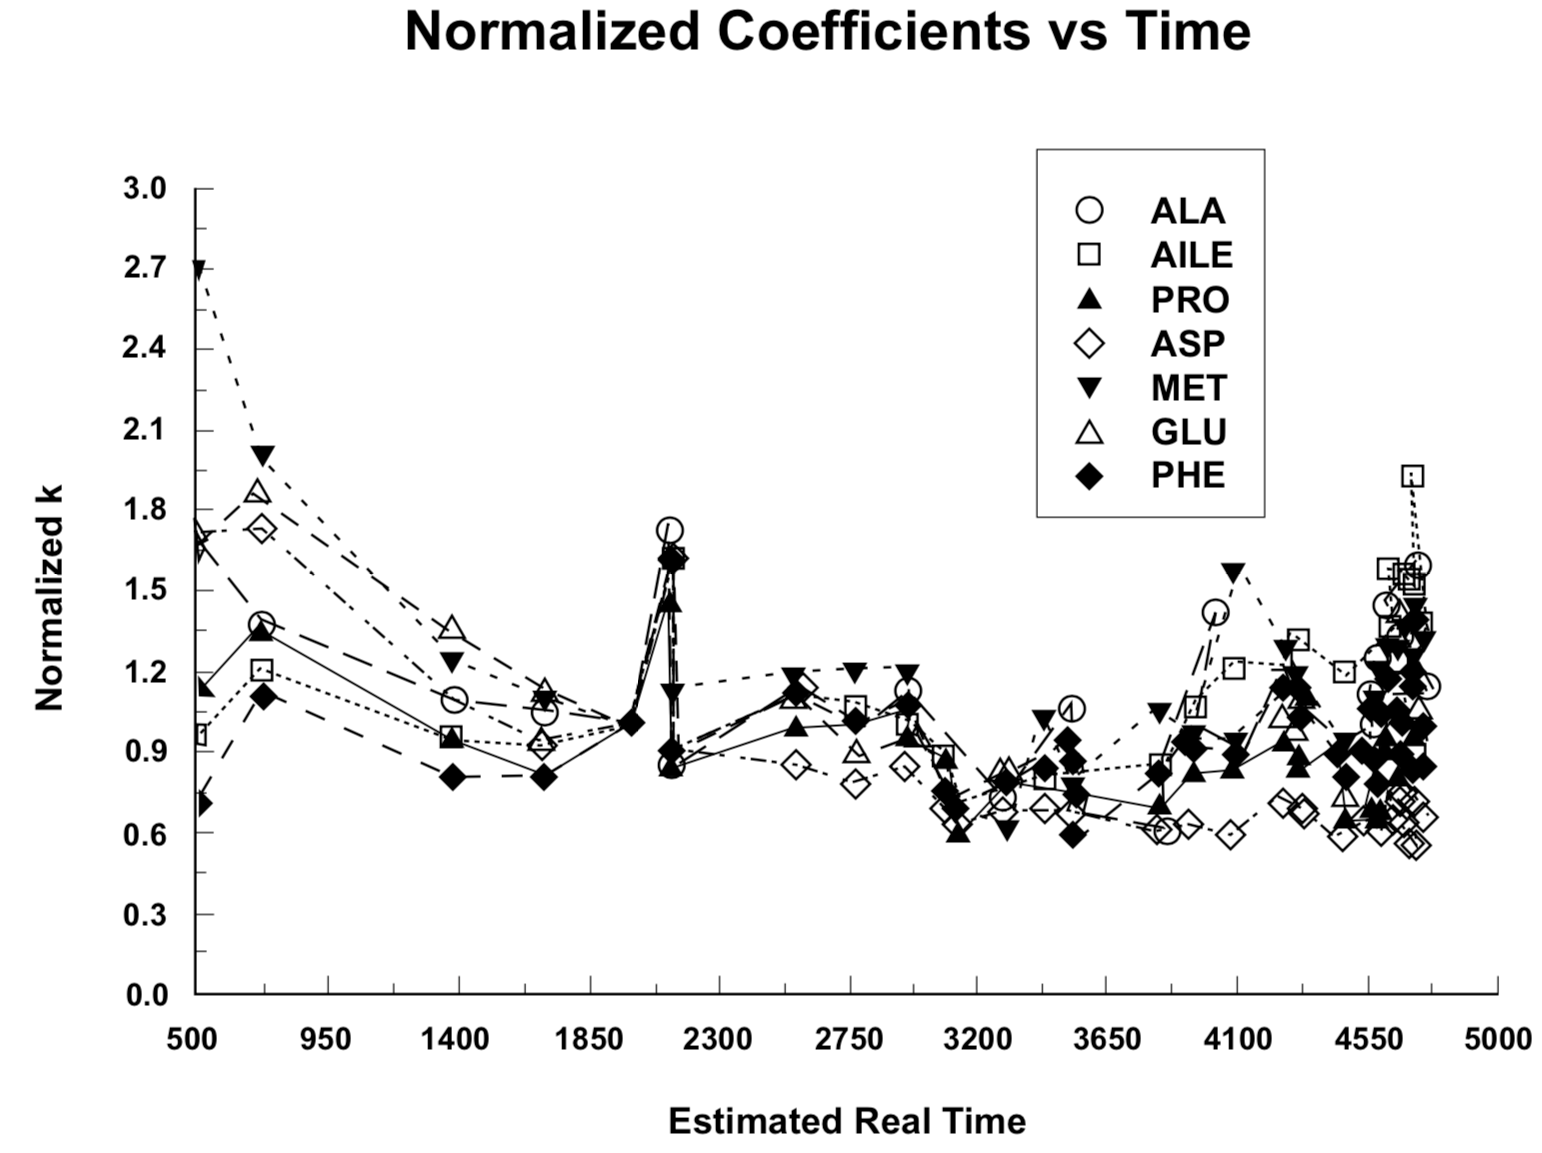
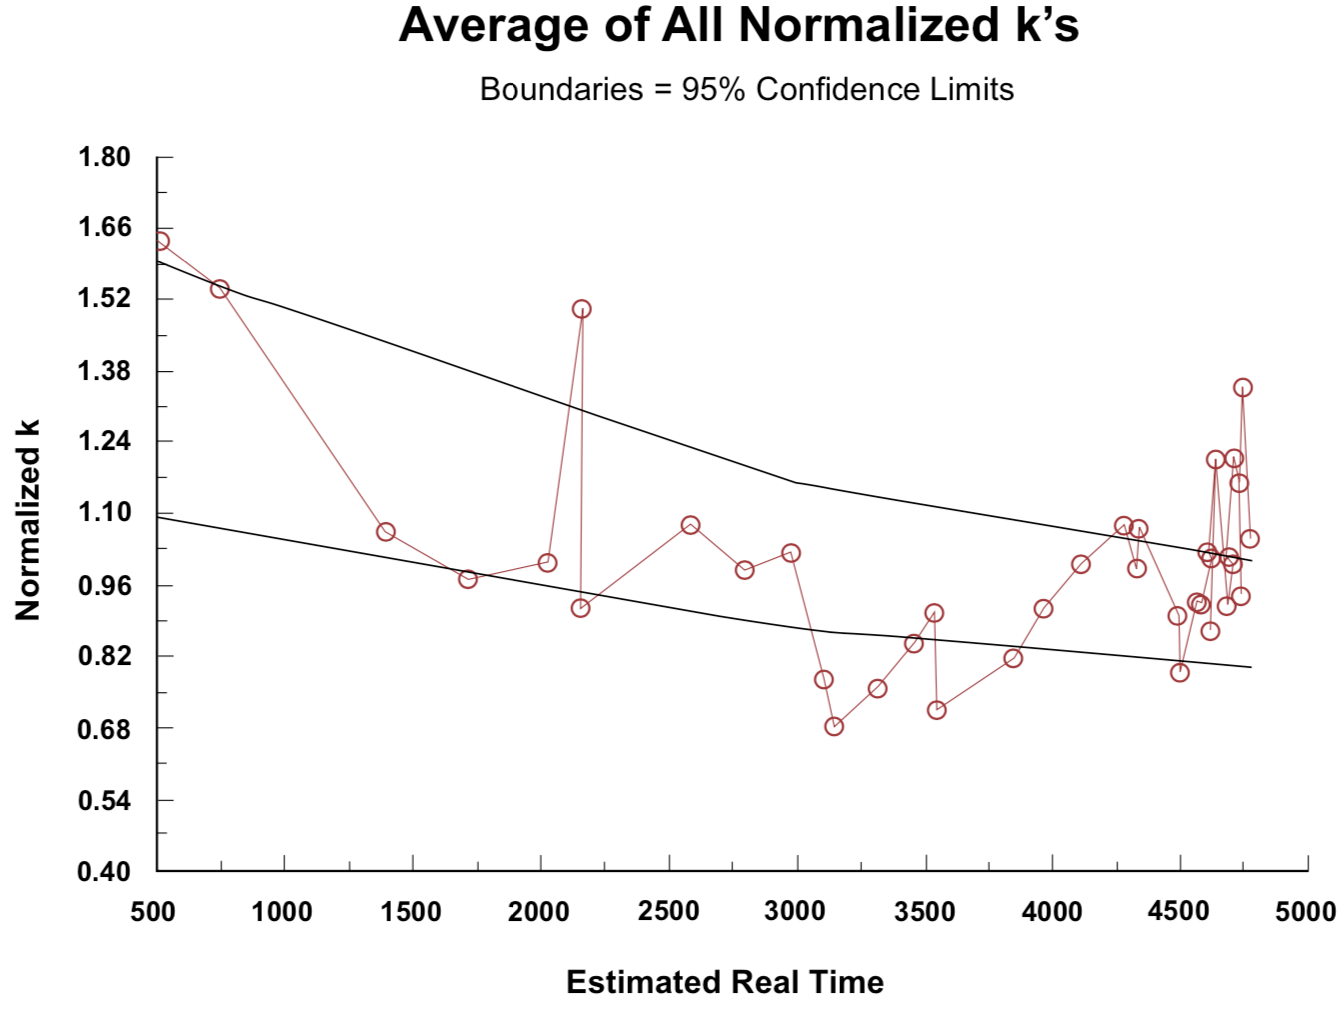
Figure 4. Amino acid racemization/epimerization coefficients, normalized to unity at age 2000 years BP, versus presumed real-time snail shell age.
The normalized racemization/epimerization coefficient trends are represented in Figure 4. In the construction of the plot in Figure 4, the data set for each of the seven amino acids was multiplied by a normalization constant that makes the line pass through 1.0 at t = 2000 (neglecting the higher of the two values for t = 2150 Sample No. 6). The average of the normalized data for all seven amino acids at each value of t in Table 1 was then plotted to obtain Figure 5. Recognizing that due to the Standard Deviation of the C-14 measurement the experimental uncertainty is nearly ±50% for the first group of data points at t = 500, and nearly ±30% for the second group of data points at t = 730, the extent to which the ideal expected constant relationship is demonstrated over a twenty-to-one radiocarbon time range is remarkable. (The uncertainty attributable to C-14 measurement has dropped to ±15% at the third set of data points for t = 1390, and diminishes to ±4% by the end of the plots.)
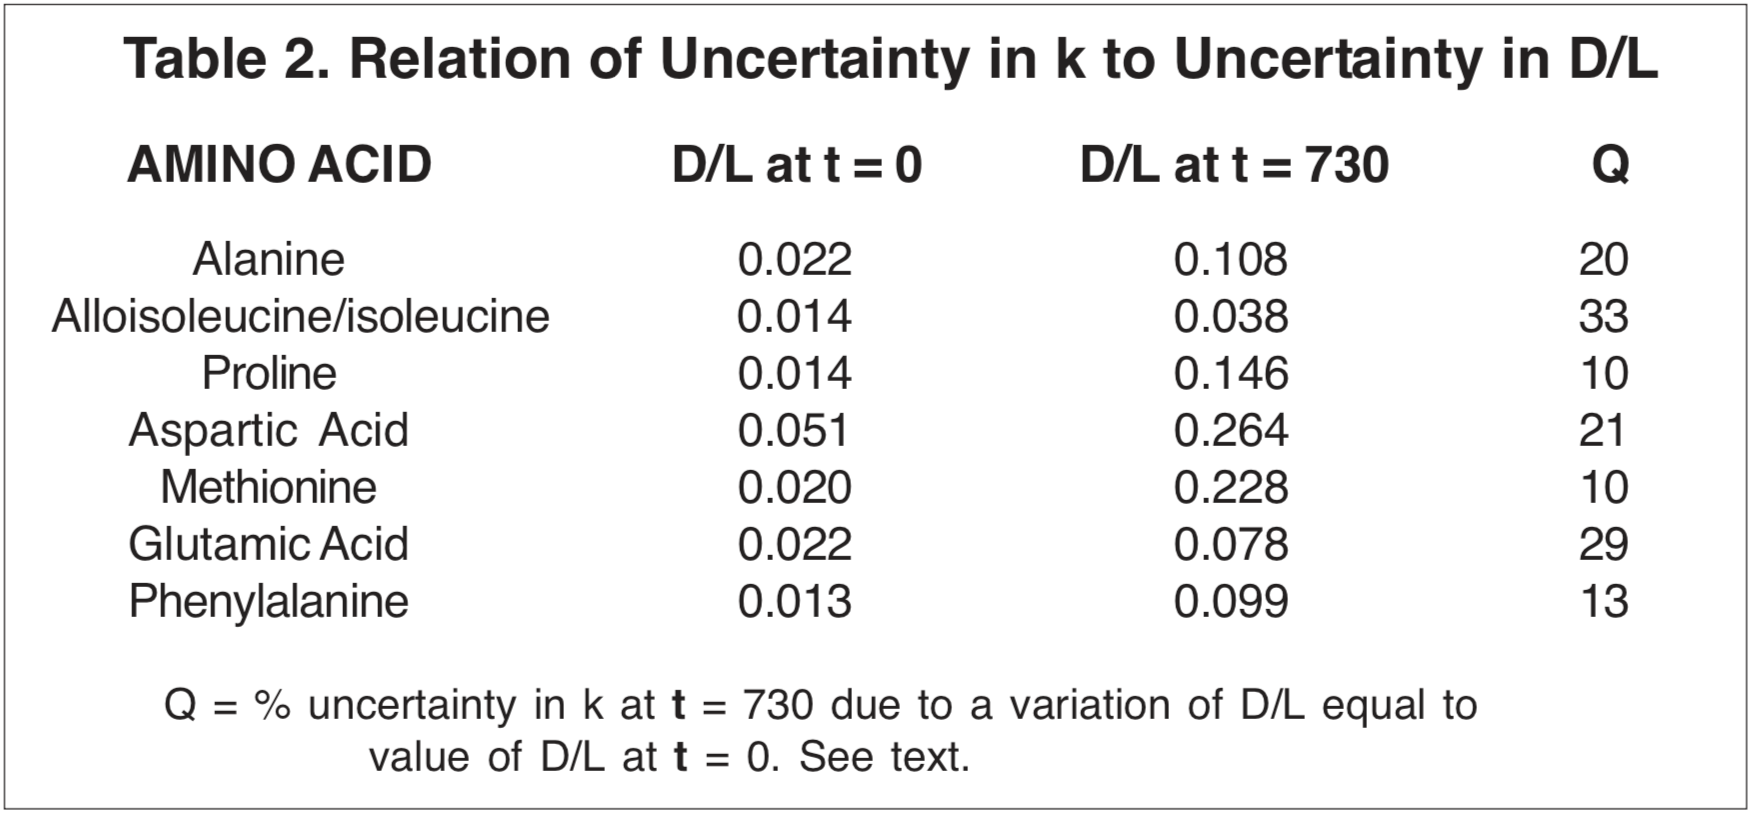
The uncertainty in the values for k that is attributable to uncertainties in the measurement of the D/L ratio can be estimated from the scatter of the data points about a smoothed progression line, if this scatter is greater than what would be expected from uncertainty of t in Equation (2) or (3). But particular consideration should be given to the D/L values for t = 0 reported by Dr. Goodfriend (see Table 2). Notice that the D/L ratios are greater than 0 for t = 0. These values may be representative of uncertainty in any D/L measurement, or may be an indication of error that would result from an unjustified simplistic presumption that D/L = 0 at t = 0. The corresponding uncertainties in k for t = 730 are given in Table 2, as estimated from a linear extrapolation for Equation (2) or (3) from the t = 730 point. For only two amino acids (alloisoleucine/isoleucine and glutamic acid) are these uncertainties in k as great as those due to the uncertainty in t at 730 years (30%). Therefore, t is the greater source of uncertainty. The possible significance of uncertainty due to the t = 0 values diminishes as D/L increases. (Compare alloisoleucine/isoleucine with proline and glutamic acid with methionine in Table 2.)
From these considerations of the possible consequences of uncertainties in the determination of t and D/L, it is evident that the hazard of drawing unwarranted conclusions from the data patterns in Figures 1 and 2 may be minimized by avoiding any judgment that is influenced by data for t = 500 and t = 730.
Racemization/epimerization rates are dependent on a number of environmental factors (Brown 1985, p. 18), the most critical of which is temperature. The differences between samples No. 6, from 17 cm below ground level, and No. 7, from 78 cm below ground level, each with t = 2150, clearly indicate the influence of environmental factors. Sample No. 6 evidently had a higher effective average temperature than sample No. 7. In each case for the data from Table 1 in which a sample from less than 20 cm below ground level is followed (higher C-14 age) by a sample from greater than 75 cm depth (there are four such cases in Goodfriend 1991a), the D/L ratios decrease, indicating a lower average temperature for the most deeply buried specimens.
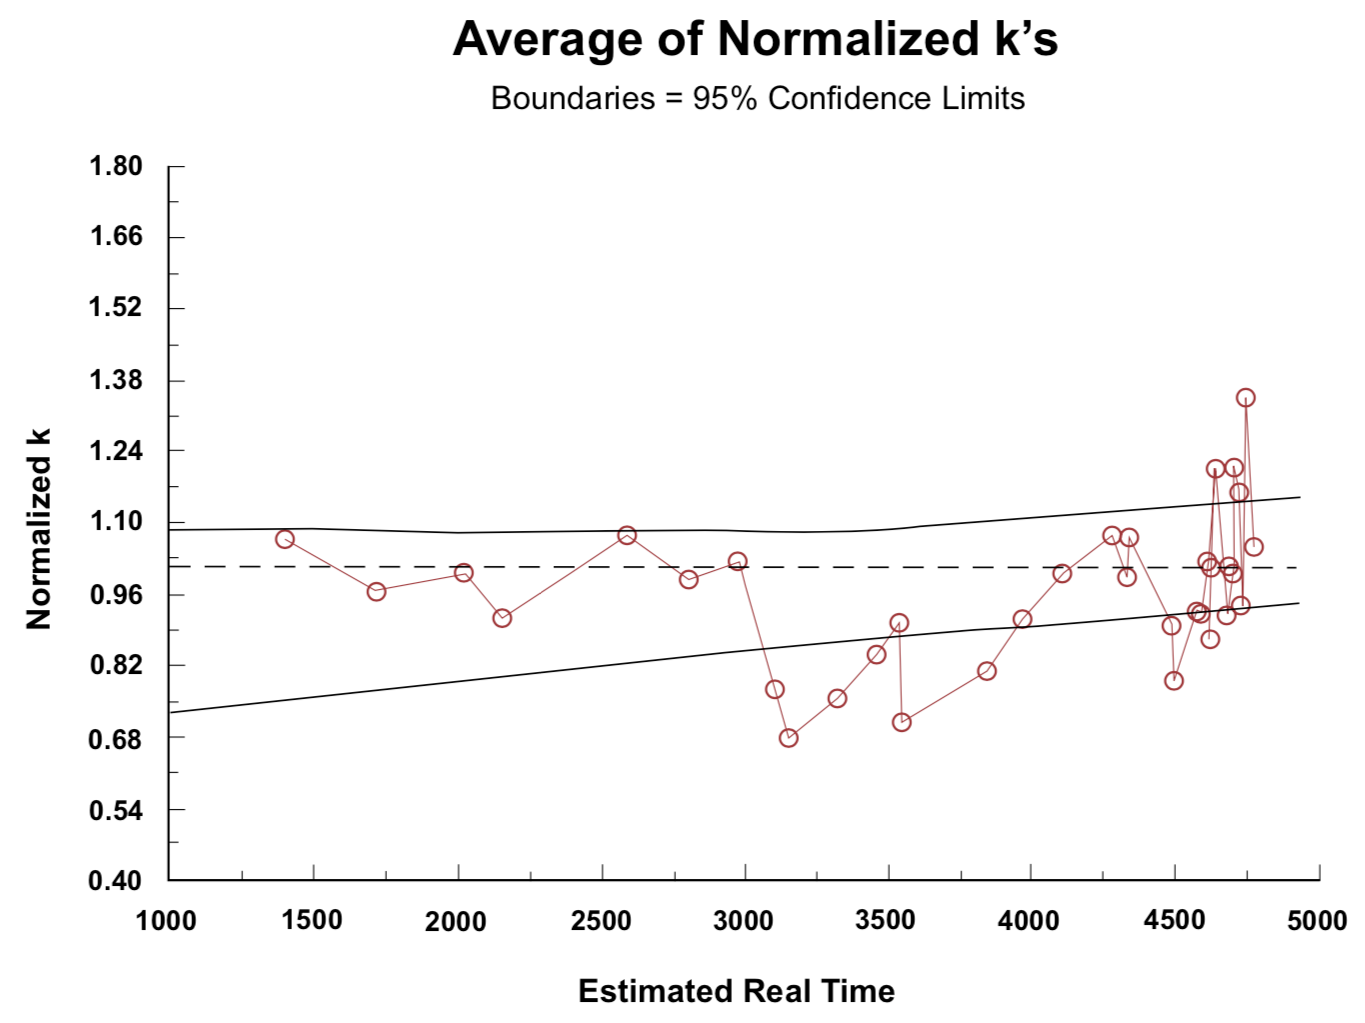
Figure 5. Average of data from Figure 4, with ±95% confidence boundaries.Figure 6. Average of data from Figure 4 with ±95% confidence boundaries, but with data for t = 500, t = 750, and the upper values for t = 2150 (samples 1, 2 and 6) omitted to make long-term trends more apparent.
Figure 6 was obtained by omitting samples No. 1 (±50% uncertainty), No. 2 (±30% uncertainty), and No. 6 (higher storage temperature than for other samples in the t = 2150-year vicinity). This provides a better basis for judging long-term trends than does Figure 5. The 95% confidence boundaries are indicated on Figures 5 and 6. The noticeable dip at t = 4500 in Figures 5 and 6 correlates with at least four of the six samples in this region coming from depths greater than 75 cm and evidently having a lower mean storage temperature than those slightly younger or slightly older. (Two of these six samples are not specified with respect to depth, but have D/L ratios closely similar to the other four.) Any factor that influenced the long-term average temperature such as depth of burial, slope of overlying surface toward the sun, or type of vegetation cover could cause variation from the smooth plot of D/L ratio against time (constant k) that would be expected if all samples came from the same location.
The trends evident in Figures 4, 5, and 6 have an enhanced significance, because each rate coefficient plotted is an average over the time between the present and the lifetime of the shell growth of the snails it represents. The racemization/epimerization rate that characterizes a sample at any time will be strongly dependent on the current temperature, and also dependent on temperature-dependent changes in the chemical bond relationships that have developed over preceding time (Kimber and Hare 1992). For a continuous trend of change, the difference between the most ancient and the recent rate coefficients would be greater than the corresponding difference between a time average and the recent value. The most likely interpretation of the trends evident in Figures 4, 5, and 6 is as an indication of three major temperature epochs. Samples with ages greater than 4200 appear to have experienced an initial warm environment that made their effective temperature greater than the effective average temperature for samples with ages in the 2800-4200 range. The 2800-4200 year range can be identified with the period of continental glaciation (Oard 1990a,b). Glaciation may have been well developed in some high latitude areas before there was a marked change of climate in southern Palestine, so these amino acid data do not provide a basis for estimating a time for the beginning of glaciation. A universal postglaciation warming trend since around 2900 BP has apparently resulted in samples with ages less than 2500 having a higher average temperature than that which characterizes samples in the 2800-4200 year age range.
While commenting on glaciation and ice ages, it is worth noting that among the snail shells treated in this study, those with C-14 age in the 5200-5800 range (real time range 4200-4650, according to the conversion used in this paper) have oxygen isotope ratios which indicate that during this time the average of the temperatures at the sources of water for the food supply was higher than it was subsequently, or previously (Goodfriend 1991b). This has been interpreted to indicate an era of differing weather patterns, during which a higher portion of the annual rainfall in the Negev came with southwest winds out of Africa.
The plot in Figure 6 emphasizes the need for a conversion from C-14 age to real time. If C-14 ages are used, the right end of this plot extends to 10,400, rather than 4765, with ordinate values clustering around 0.46 instead of 1.0. It would be unreasonable for racemization/epimerization coefficients of fossil material to progressively increase with time sufficiently to produce over 10,000 years a two-fold increase in the values indicated by Equations (2) and (3). These equations are based on the assumption of a constant racemization/epimerization rate. If the rate has actually been increasing, the rate at the beginning of a time period would be less than the "average" given by these equations. Accordingly the rates 10,000 years ago would have to be considerably less than one-half their recent value.
The slight upward trend of the 95% confidence band in Figure 6 indicates that presumed real time as given by Equation 1 is too small. Placing the date for the Flood in Equation 1 at 5350 BP, as supported by the Septuagint (see Brown 1990), rather than 5000 BP, produces the horizontal 95% confidence band that would be expected for constant racemization/epimerization rates.
Conclusions
The data treated in this discussion provide support for the following significant conclusions:
Radiocarbon ages give a better representation of real time when interpreted in accord with the chronological guidelines given in the Hebrew scriptures (Nichol et al. 1953, 1978), than when taken as directly equivalent to real time, or when interpreted according to the currently popular dendrochronological model that requires radiocarbon ages to be increasingly less than equivalent real time.
Amino acid racemization/epimerization coefficients have been to a first approximation essentially constant, with small variations that may be accounted for as a result of temperature differences, as expected from simple theoretical considerations.
Based on the trends in Figure 6, mean temperatures in the Palestine area were relatively warm for a few hundred years after the Flood, prior to the development of polar climate zones and continental glaciation; and then became cooler over a span of about 1500 years before the end of continental glaciation and the establishment of a warming trend that has continued over the past 2500 years.
ACKNOWLEDGEMENT
We thank L. J. Gibson for assistance in manuscript preparation.
REFERENCES
Brown, R. H. 1985. Amino acid dating. Origins 12(1):8-25.
Brown, Robert H. 1986. Radiometric dating from the perspective of biblical chronology. In Robert E. Walsh et al. (eds.), Proceedings of the First International Conference on Creationism, pp. 31-57. Creation Science Fellowship, Pittsburgh, Pennsylvania.
Brown, Robert H. 1990. Correlation of C-14 age with the biblical time scale. Origins 17(2):56-65.
Goodfriend, Glenn A. 1991a. Patterns of racemization and epimerization of amino acids in land snail shells over the course of the Holocene. Geochimica et Cosmochimica Acta 55(1):293-302.
Goodfriend, Glenn A. 1991b. Holocene trends on O18 in land snail shells from the Negev Desert and their implications for changes in rainfall source areas. Quaternary Research 35:417-426.
Kimber, R. W. L., and P. E. Hare. 1992. Wide range of racemization of amino acids in peptides from human fossil bone and its implications for amino acid racemization dating. Geochimica et Cosmochimica Acta 56:739-743.
Mitterer, R. M. and N. Kriausakul. 1989. Calculation of amino acid racemization ages based on apparent parabolic kinetics. Quaternary Science Reviews 8:353-357.
Nichol, Francis D., et al. (eds.). 1953, 1978. Seventh-day Adventist Bible Commentary, Vol. 1, pp. 174-196. Review and Herald Publishing Association, Washington, D.C.
Oard, Michael J. 1990a. A post-Flood ice-age model can account for Quaternary features. Origins 17(1):8-26.
Oard, Michael J. 1990b. An ice age caused by the Genesis Flood. ICR Technical Monograph, Institute for Creation Research, El Cajon, California.
Stuckenrath, Robert, Jr., and James E. Mielke. 1970. Smithsonian Institution radiocarbon measurements VI. Radiocarbon 12:192-204.