IMPLICATIONS OF C-14 AGE VS DEPTH PROFILE CHARACTERISTICS
by R. H. Brown Geoscience Research Institute
WHAT THIS ARTICLE IS ABOUT
Intensive analytical treatment of C-14 age profile data indicates that during prehistoric time either the biosphere C-14/C-12 ratio has increased, or the world average sedimentation rate has increased, while peat accumulation rates have decreased. A model based on biosphere C-14/C-12 ratio increase is suggested by the biblical chronologic data in the book of Genesis, and is favored by paleoclimate considerations against a model based on sedimentation rate increase. The currently accepted dendrochronologic framework requires a biosphere C-14/C-12 ratio decrease, and therefore supports a model based on sedimentation rate increase. Aside from dendrochronologic considerations, there is a basis for proposing that sediment, soil, and peat accumulation rates have generally decreased during the prehistoric period following glaciation. Biblical chronologic data taken together with recent Accelerator Mass Spectrometry C-14 data provide a basis for postulating that the biosphere C-14/C-12 ratio has increased more than 70-fold, but less than 500-fold since the global catastrophe described in the 7th and 8th chapters of Genesis. This increase could be due to an increase in the rate of C-14 production and a decrease in the carbon inventory in the carbon exchange system.
The radiocarbon age of organic material in sediments would be expected to increase in a linear relationship with depth of sediment if geologic and geochemical processes have always had the same characteristics as in recent times. The available data on C-14 age profiles indicate that the characteristic relationship is nonlinear in a direction which suggests that the C-14/C-12 ratio was less in the past than it is now.
Introduction
The relationship between radiocarbon age data and the chronological data in the fifth and eleventh chapters of Genesis has been examined in previous issues of ORIGINS [2:6-18, 58 (1975); 6:30-44 (1979); 7:9-11 (1980)]. The first of these treatments utilized a crude quantitative description of C-14 age versus depth profile shape and concluded that the deeper portions of these profiles are most likely to be concave toward the C-14 age axis, showing less sediment per C-14 time unit than shallower deposits. Such profile shape could be due to an increasing C-14/C-12 ratio in the biosphere during the early (prehistoric) stages of sediment accumulation and peat growth, increasing accumulation rates as sediment and peat features developed, or a combination of these circumstances. The conclusion in the 1975 treatment, that "C-14 ages in the prehistoric range should be expected to be progressively in excess of the real time involved", was strongly supported by the sediment data set of 60 profiles, and mildly supported by the peat data set of 39 profiles.
Data Base
The purpose of this presentation is to acquaint ORIGINS readers with a more extensive and more rigorous investigation reported in Radiocarbon (Brown 1986). The report in Radiocarbon is based on 170 sediment, 114 peat, and 25 soil profiles. All sediment and peat features that provided the data base for the 1975 report in ORIGINS are included in the data base for the 1986 Radiocarbon report. An attempt was made to include in the 1986 report all C-14 age vs depth profiles that have been reported in the scientific literature up through most of 1984. I am confident that this goal was adequately, though not fully, realized except for the scientific literature that was produced within the U.S.S.R. and its satellite countries.
Analytical Treatment
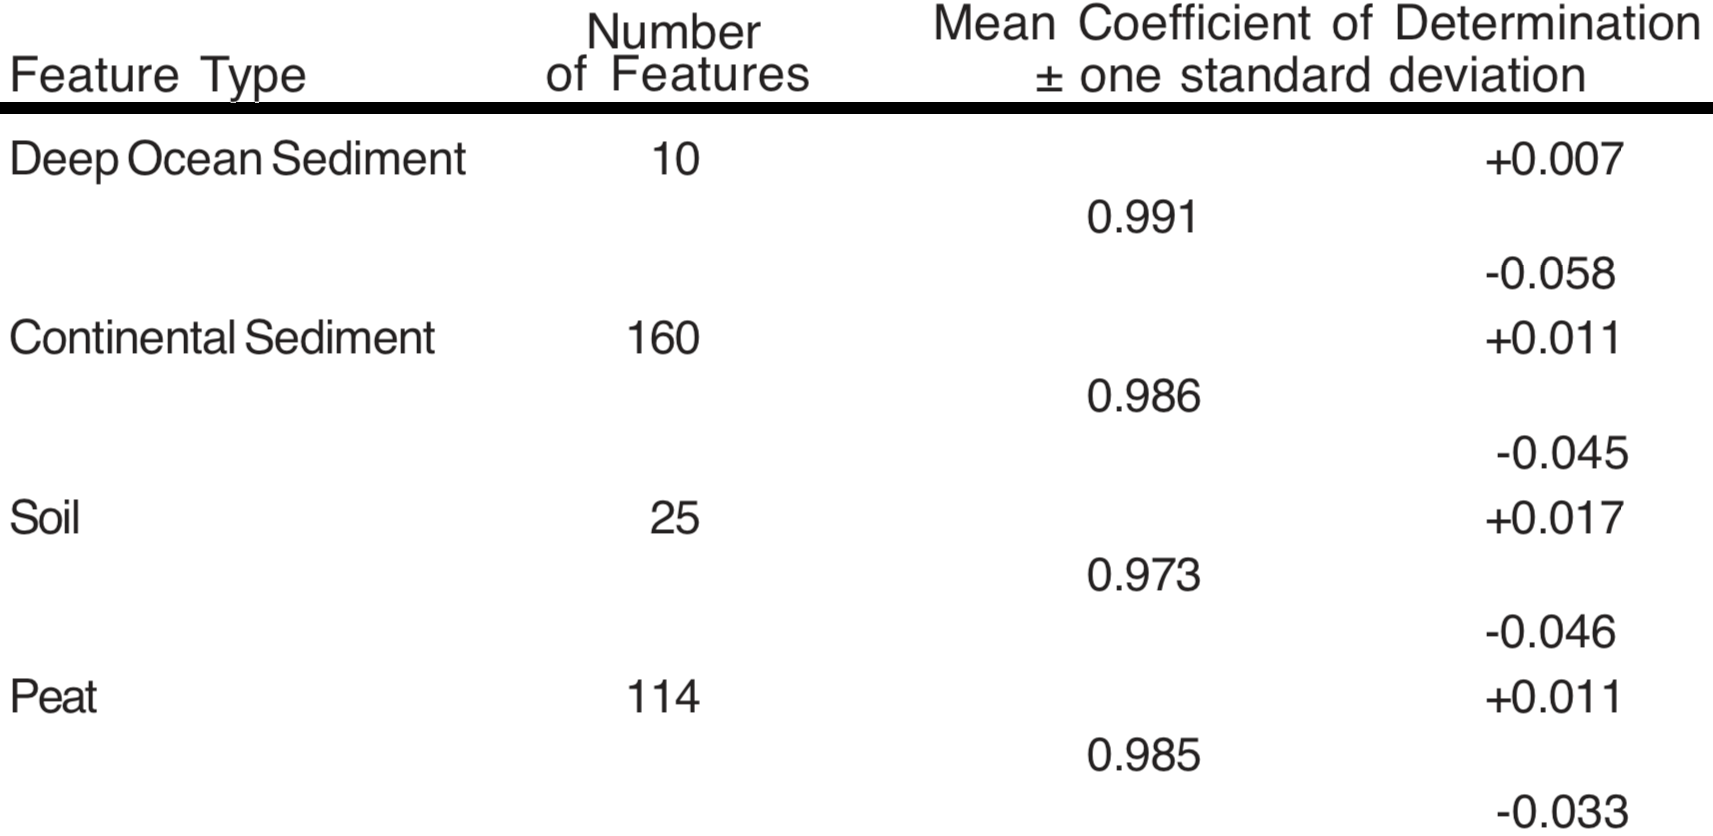
Each set of C-14 age versus depth data in the recent investigation was analyzed using cubic regression for a smooth curve representation of the average data trend. The analysis was limited to profiles which were described by at least 7 data pairs, with the exception of 3 continental sediment and 2 peat profiles, each of which has 6 well-spaced, precisely determined data points. Profiles for which a cubic regression with a Coefficient of Determination (CRCD) of at least 0.70 could not be obtained were not included in the group analysis. Six continental sediment and 5 soil profiles failed to meet the 0.70 CRCD criterion. Sixteen continental sediment, 5 soil, and 9 peat profiles that met the 0.70 CRCD criterion were rejected on the basis of clear evidence that the feature had been disturbed during or since emplacement, or because the data range was too restricted to establish adequately a representative trend. Of the profiles, 170 sediment, 114 peat, and 25 soil survived these restrictions. Some readers may question the adequacy of a relatively simple cubic regression (second-order nonlinearity) to represent the raw C-14 age profile data. Table 1 gives the mean CRCD together with the range of this coefficient that includes 67% of the data set.
TABLE 1. Adequacy of Cubic Regression Fit. Coefficient of Determination = 1.0000 represents a "perfect" fit to the C-14 age versus depth data. The ± limits specify the range which includes 67% of the coefficients of determination.
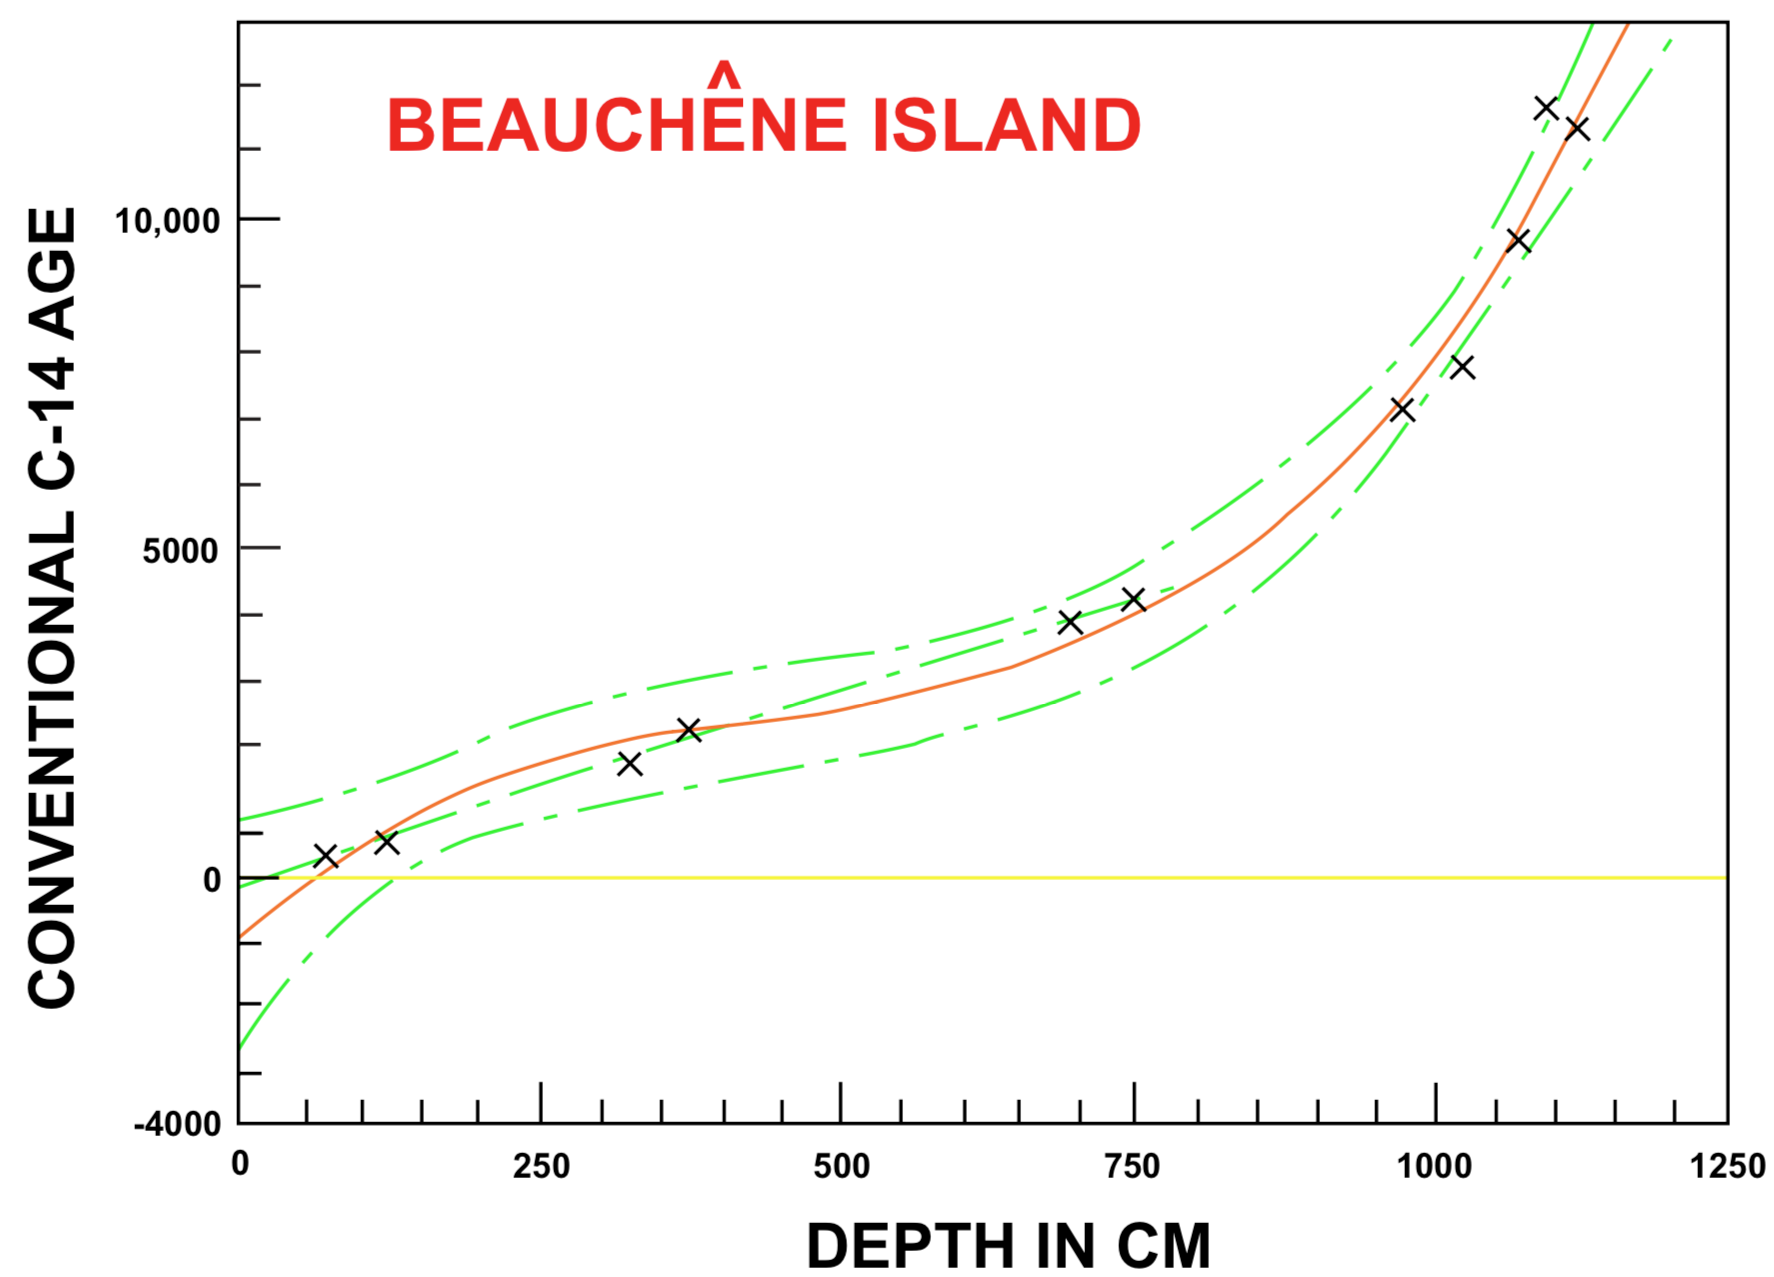
All profiles for which the smooth curve representation was only mildly curved were fitted with both a cubic regression and a linear regression. If the linear regression (straight-line fit) gave a lower Standard Error of Estimation than did the cubic regression, the profile was represented in group analysis by its linear regression. No deep ocean sediment profiles, 19 continental sediment profiles, one soil profile, and thirty peat profiles were better represented by a linear regression. For each profile a plot was made showing the raw conventional C-14 age (5568 year Libby half-life) vs depth data points, the best-fit regression line for the raw data, and the 95% confidence boundaries for the regression line, as illustrated in Figure 1. The slope of the regression line in C-14 years/cm was calculated for 2500-year intervals. If the slope (C-14 years/cm) at either of the extreme data points appeared questionable, the regression line was extrapolated as a straight line of slope compatible with the interior section. (The regression curve fitting process gives the best fit to the input data points, but may yield an incorrect slope of the regression line at the extreme points where there is constraint in only one direction. See Figure 1 for an example.)
FIGURE 1. Peat profile from Beauchêne Island, Falkland Islands (data from Smith and Prince 1985). Dashed adjustment to regression line provides most reasonable estimate of slope and curvature at 2500 14C yr (see also Smith and Clymo 1985).
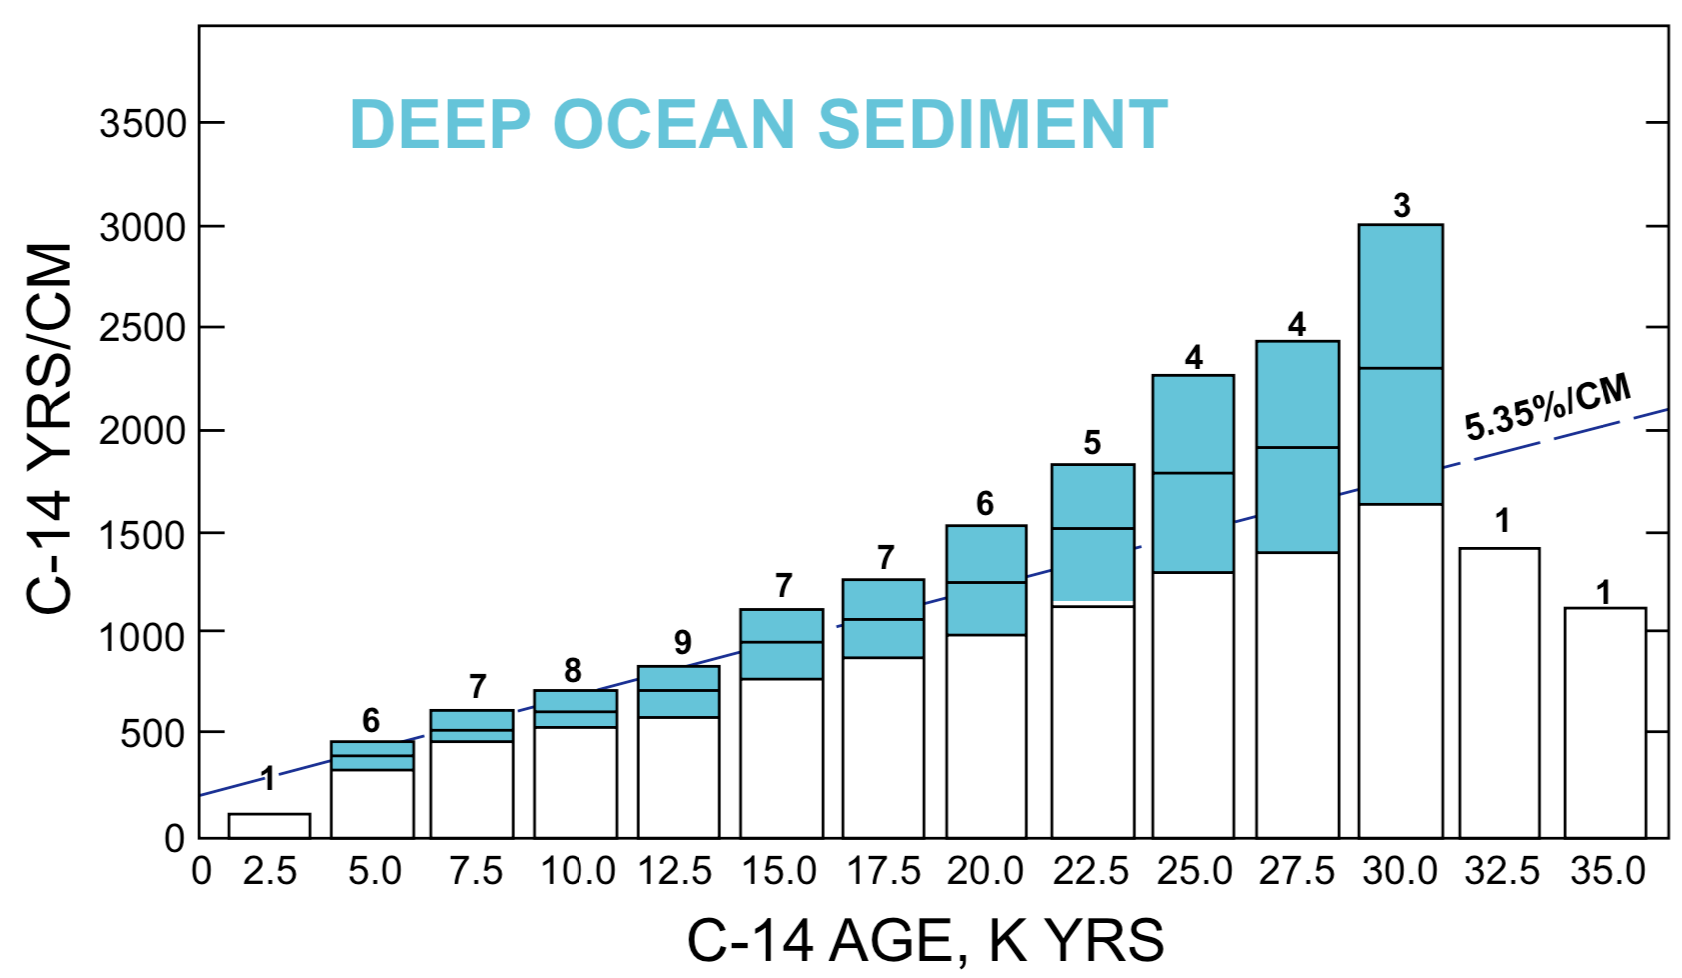
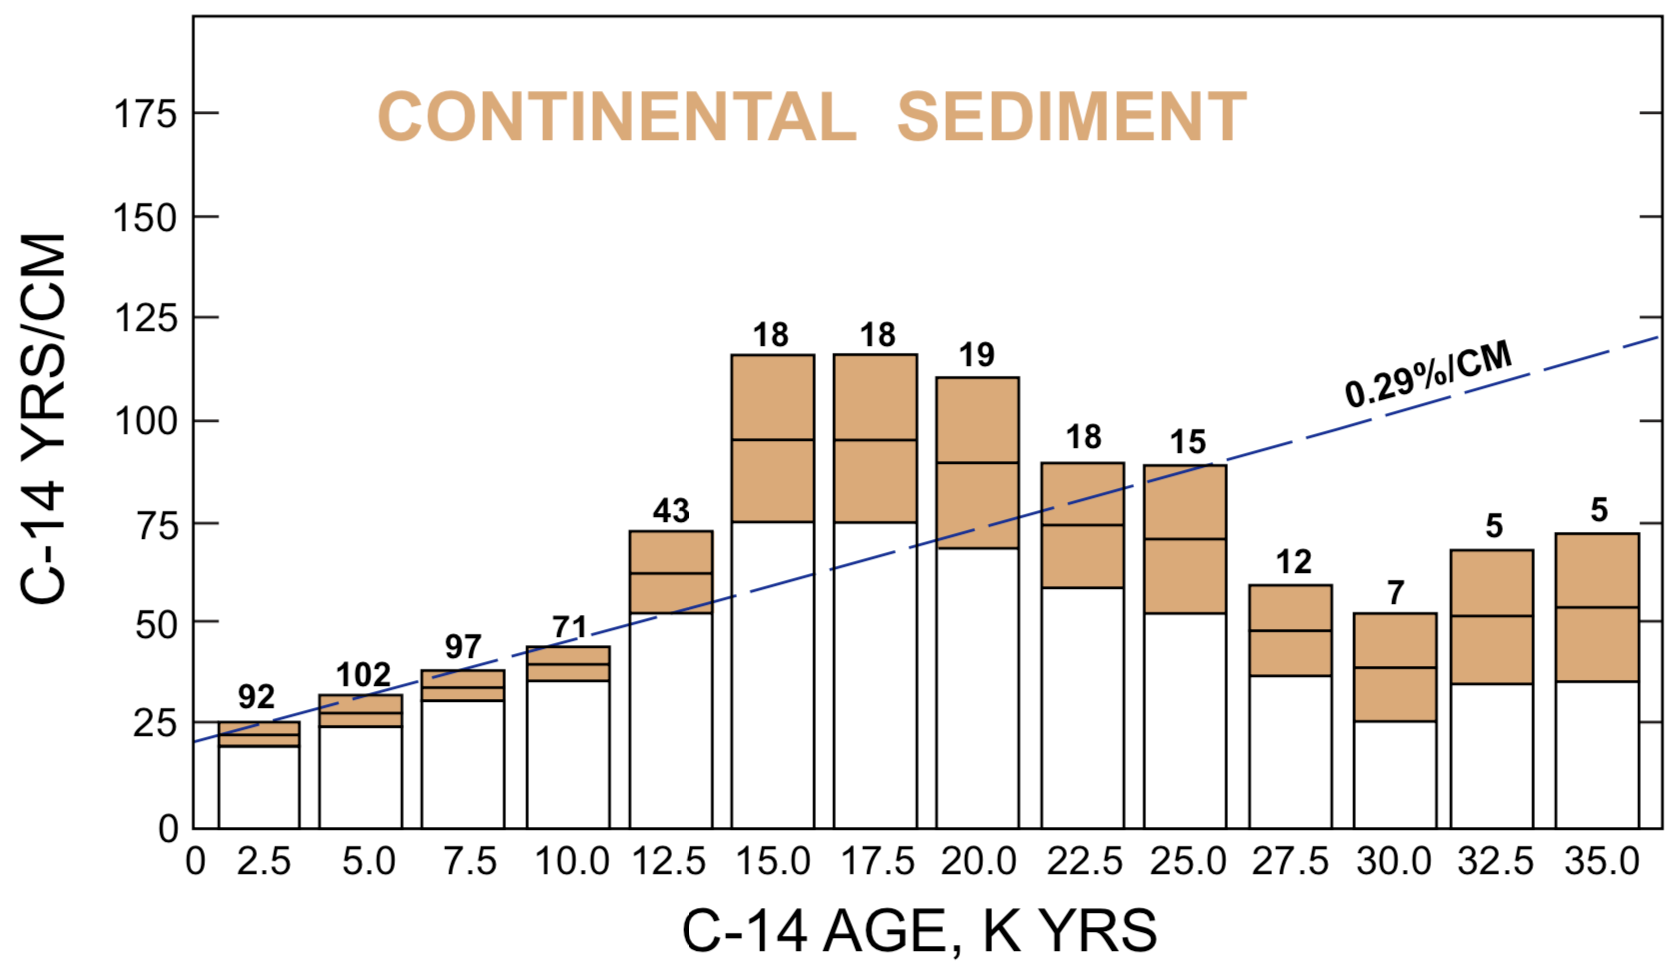
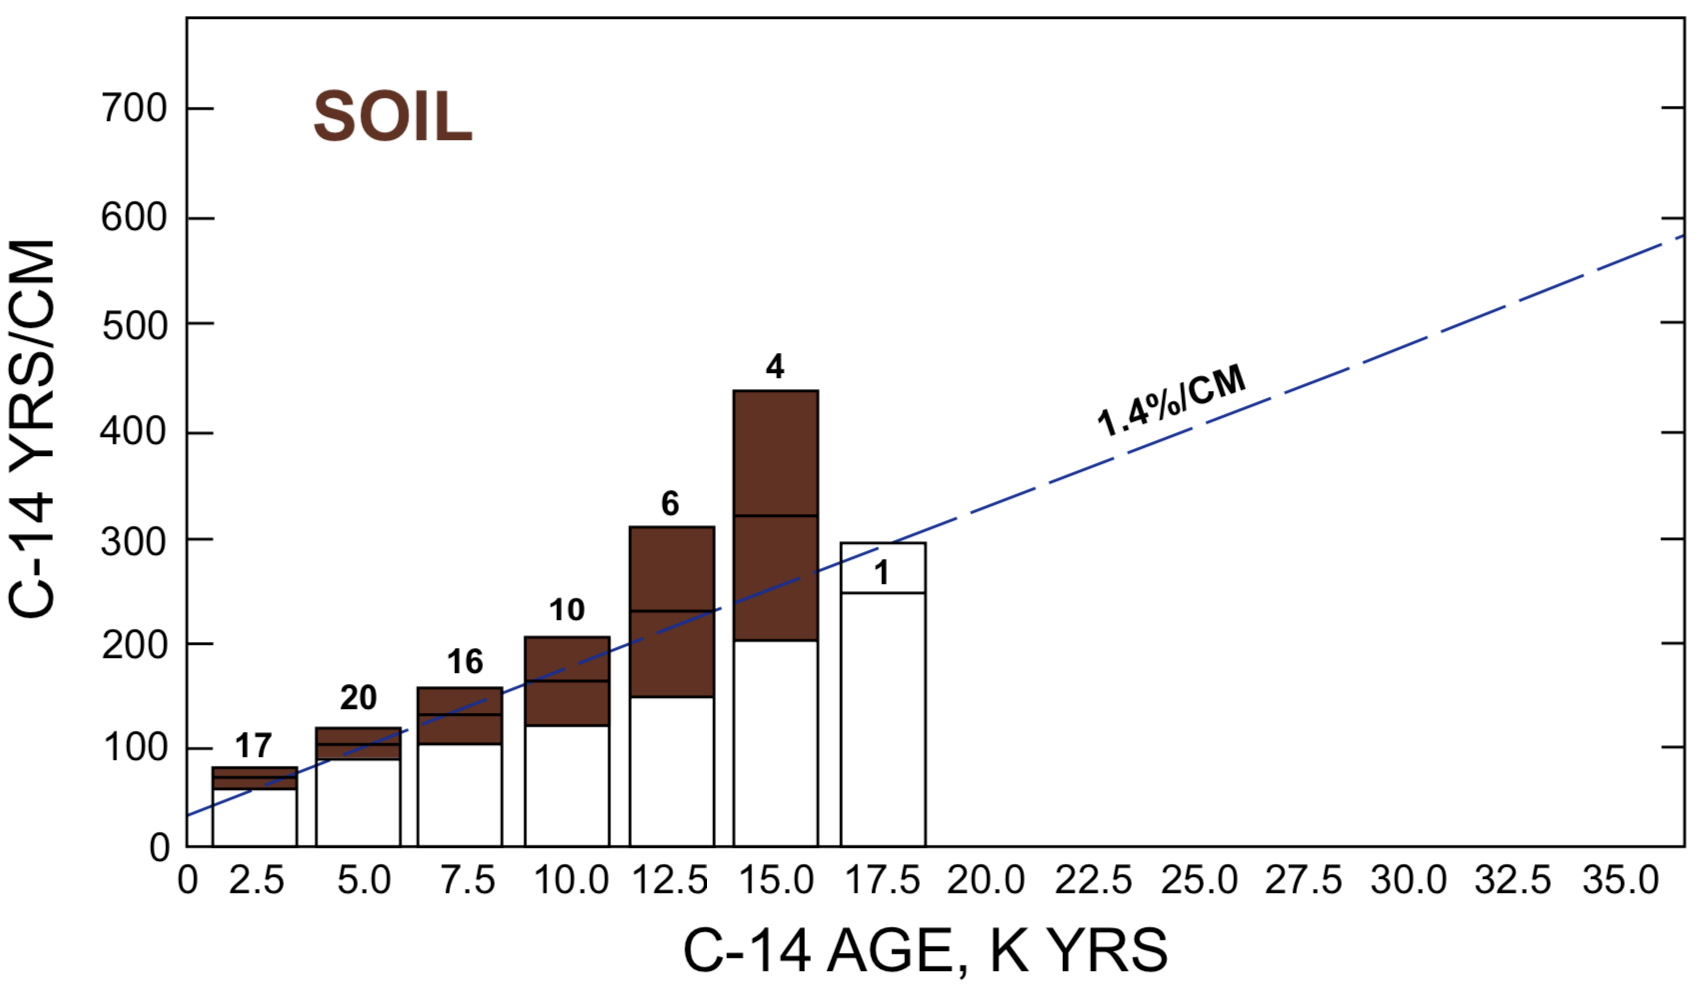
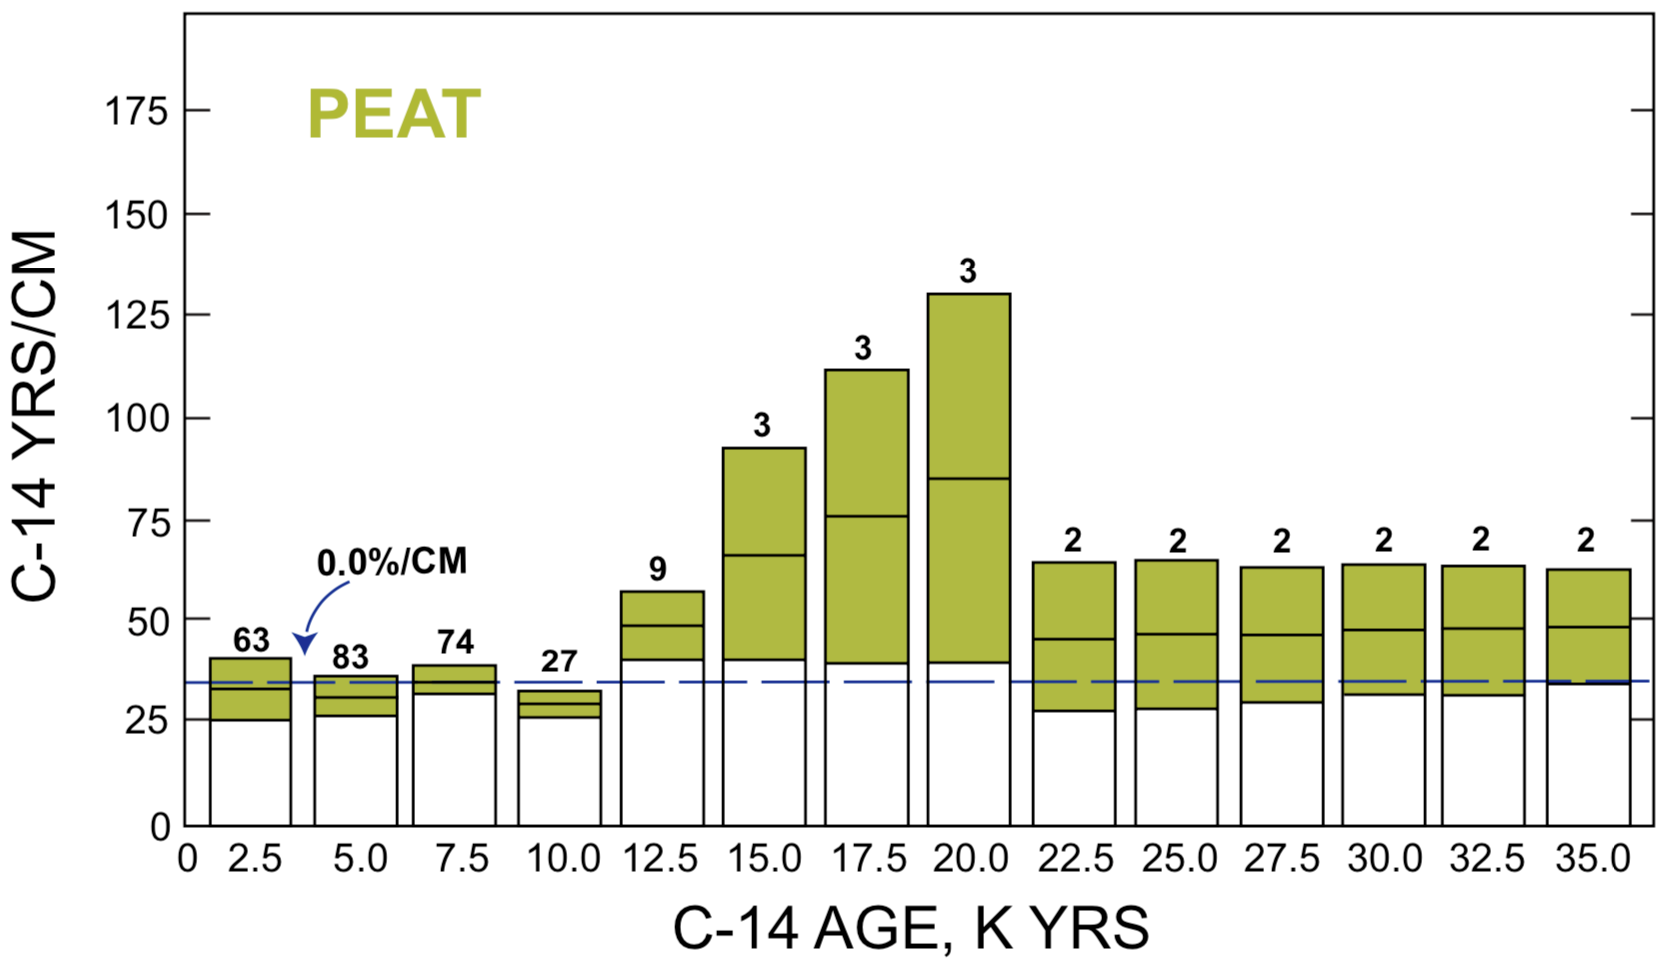
For each of the four feature types (deep ocean sediment, continental sediment, soil, and peat) the mean regression line slope in C-14 years/cm was determined for intervals of 2500 years. These mean values are represented by vertical bars in Figures 2-5. The filled portion of these bars represents the range within which the respective mean value has a statistical expectation of failing with 67 chances out of 100. The numbers at the top of each bar are the number of profiles in the data represented by the bar. Figures 2-5 represent only data for profile sections bounded by C-14 age determinations, i.e., no data from extrapolated regions are included. The line designated %/cm represents the average increase in C-14 years/cm between adjacent bars.
FIGURE 2. Graphic summary of global slope characteristics of deep ocean sediment profiles.FIGURE 3. Graphic summary of global slope characteristics of continental sediment profiles.FIGURE 4. Graphic summary of global slope characteristics of soil profiles.FIGURE 5. Graphic summary of global slope characteristics of peat profiles.
Discussion
The data represented in Figures 2-5 clearly establish a global tendency for C-14 age increment per unit of depth to increase with depth, i.e., for the C-14 age profile to be concave toward the C-14 age axis, as in Figure 1. The three peat bog data sets which include 15,000, 17,500, and 20,000 C-14 years are an inadequate sample for determining global characteristics. Since there are such a large number of samples over the 0-10,000 C-14 year range, it is most reasonable to conclude that within the limits of the currently available data an average peat deposit profile should be expected to be linear. Accordingly, the profile represented in Figure 1 does not represent the most probable C-14 age versus depth (thickness) relationship for a peat deposit. Several factors that might affect the shape of a profile are discussed below.
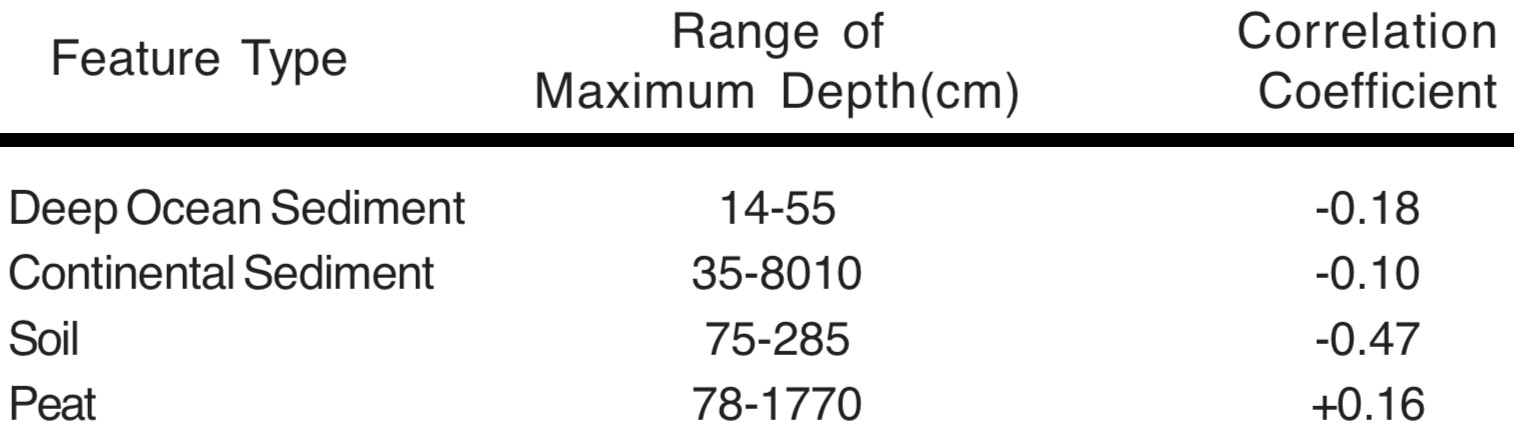
Compaction may be expected to increase the C-14 age span per cm of depth in the lower portion of a deposit and produce a C-14 age profile concave toward the C-14 age axis. If compaction is an adequate explanation for the profiles depicted in Figures 2-4, the average density at profile depths associated with 15,000-year C-14 age must be 3.2, 4.2 and 4.8 times the average density at profile depths associated with 2500-year C-14 age for deep ocean sediment, continental sediment, and soil, respectively (ratio of C-14 years/cm ordinates). Such ratios are unreasonable since they require a sediment density greater than that of either granite or basalt. Furthermore, if compaction is a significant factor, it should be more pronounced among a group of thicker features than among a group of relatively thinner features. The average increase in C-14 years/cm per cm of depth should be greater (correlate positively) for relatively thick features than for relatively thin ones. Table 2 lists the Coefficient of Correlation between average increase per cm in C-14 years/cm and maximum depth for the profiles in the feature types described in Table 1.
TABLE 2. Compaction Analysis. Coefficient of Correlation between average increase per cm in C-14 years/cm and maximum depth for the profile groups described in Table 1.
The small negative correlation for sediments probably has no significance. The negative 0.47 correlation for soil profiles indicates that shallower soil profiles have a distinctly greater tendency to be concave toward the C-14 age axis than do deeper soil profiles. I have no explanation for a difference between soil and sediment profiles in this respect. The more positive correlation for peat profiles with respect to sediment profiles indicates that compaction has been a significant, but not major, factor in peat accumulations.
Another possible cause of C-14 age profile concavity toward the C-14 age axis is contamination (Nambudiri et al. 1980), providing the degree of contamination by more ancient material progressively decreases with time. While allowance should be made for such possibility at some locations over some periods of time, it does not appear to provide a universally adequate explanation. Contamination by material of greater than contemporary age as a feature builds up by natural processes most reasonably should be negligible, uniform in time, or episodic. A uniform rate of contamination would have no effect on the C-14 age profile shape. Episodic contamination would produce a profile discontinuity that gives data points which do not fit the general profile trend. Such anomalous data are occasionally encountered and are easily recognized.
A universally adequate explanation for the sediment and soil C-14 age profile shape tendency seems to require a progressively increasing C-14/C-12 ratio in the supporting environment and/or progressively more rapid accumulation rates. Considerations relative to a C-14/C-12 ratio increase have been presented earlier (Brown 1979). Dendrochronologic correlations with C-14 age (e.g., Kromer et al. 1986) appear to limit changes in C-14/C-12 ratio to only a minor, rather than a dominant, role. The classical grammatical-historical interpretation of the Hebrew scriptures provides constraints on historical time that disallow the currently accepted dendrochronologic models for time prior to around 2000 B.C. (Hasel 1980a,b), and favor an increasing C-14/C-12 ratio as the dominant factor in sediment and soil C-14 age profile shape tendency. The evidence concerning paleoclimate does not indicate a steadily increasing global trend for sedimentation, erosion, and soil buildup rates throughout the late Pleistocene and early Holocene epochs. This is contrary to the possible explanation that the dominant factor in sediment and soil C-14 age profile shape might be changes in accumulation rate (Hecht 1985). The choice between increasing C-14/C-12 ratio and increasing accumulation rate will depend largely on the relationship between one's confidence in a chronology based on the data in the first eleven chapters of Genesis and his confidence in the models for paleoclimate and dendrochronology that are in vogue.
An additional factor that could produce a C-14 age versus depth profile concave toward the C-14 age axis for peat accumulations is decomposition (Clymo 1984). Decomposition allows organic material to be carried away in solution by percolating water. The older (lower) portions would be more depleted than the younger (upper) portion. Also compaction should be a more significant factor for peat profiles than for sediment and soil profiles. The Correlation Coefficient data in Table 2 is consistent with these considerations. Since the group average profile for peat deposits is essentially linear over at least a 10,000 C-14 year range (Figure 5), the global average peat accumulation profile (excluding the consequences of compaction and decomposition which produce a profile convex toward the depth axis) must be concave toward the depth axis over the same range of time. Such a characteristic specifies declining peat accumulation rates, at least over the early portion of the time covered by the last 10,000 C-14 years.
If the C-14/C-12 ratio increases with time, a C-14 age based on a recent C-14/C-12 ratio will be increasingly greater than the corresponding real-time age. Consequently, an accumulation profile of C-14 age versus depth would be less concave toward the depth axis than the corresponding real-time age versus depth profile, and could be reversed to appear convex, as in Figure 1. Accordingly, the actual decline in a peat accumulation rate could be greater than might be inferred from a C-14 age versus depth profile.
To eliminate an increasing C-14/C-12 ratio as a major factor in producing the profile characteristics displayed in this analysis, it would be necessary to have a world-wide climate trend favoring an increase in average sediment and soil accumulation rates. Since most of the peat bogs described in the literature are located in formerly glaciated areas, it seems to me more reasonable to presume that the global averages of both sediment accumulation rates and peat accumulation rates have declined over at least the early part of the Holocene.
C-14/C-12 Ratio Increase Limit
If there has been a C-14/C-12 ratio increase in the biosphere, is there a basis for determining a probable value for this increase? Such a determination can be made if one has appropriate samples of known real-time age, equipment capable of determining the residual C-14/C-12 ratio in these samples, and techniques for determining the amount of C-14 contamination in them. Contamination could be due to a mixture of carbonaceous material older than the real-time age of the sample (C-14/C-12 ratio lower than the "true" value), or to transfer from contact with younger carbonaceous material (C-14/C-12 ratio greater than the "true" value).
The data in the first eleven chapters of Genesis specify a major global catastrophic event that occurred within about ±500 years of 5000 years ago. Remains of organisms buried during this catastrophe would now be characterized by 51-58% of the C-14/C-12 ratio that characterized them at death. Since the C-14 in Earth's biosphere is formed by interaction of cosmic ray protons with nitrogen atoms in the upper atmosphere, it is most reasonable to presume that the C-14/C-12 ratio in the pre-flood biosphere was greater than zero, specifically 72-96% greater (since 1/.51 = 1.96 and 1/.58 = 1.72) than that which now characterizes the remains of organisms buried during the Noachian flood.
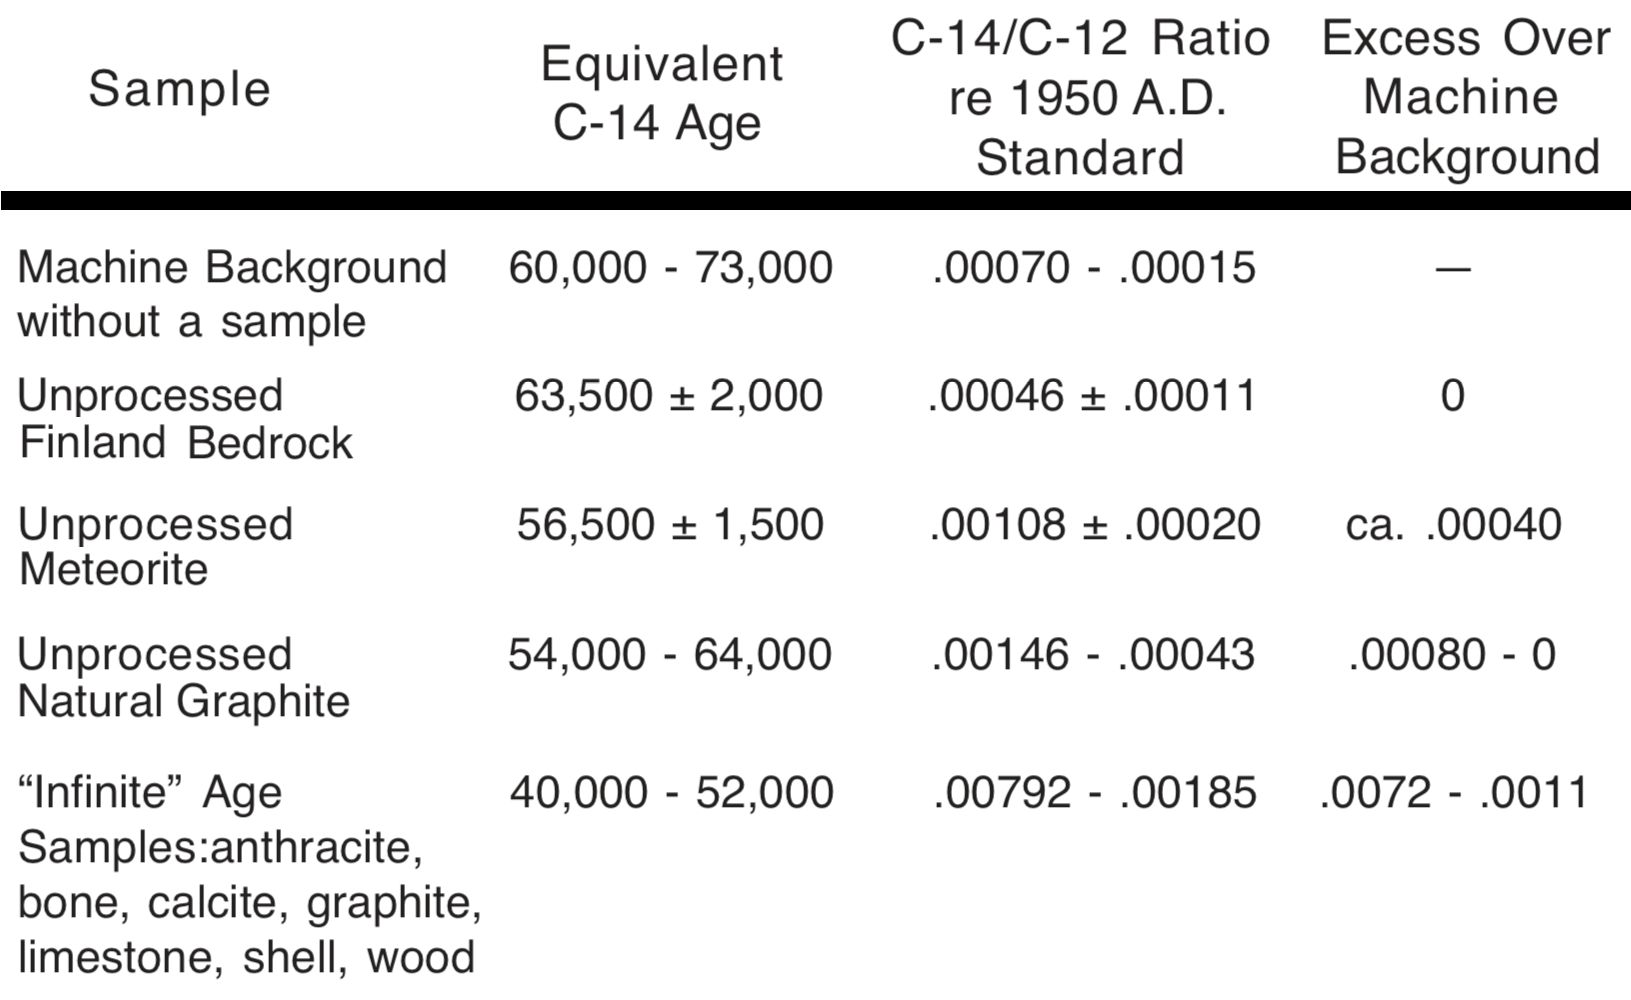
The Twelfth International Radiocarbon Conference featured reports from seven laboratories on the present capabilities of the nuclear accelerator mass spectrometry (AMS) technique for direct counting of C-14 atoms [Radiocarbon 28(2A):177-255 (1986)], the most refined and sensitive technique for C-14 age determination. Table 3 summarizes the C-14 age threshold data in these reports. Since column 4 combines data from seven different laboratories, the numbers given therein should be considered as only rough estimates of what might be expected in any particular laboratory. The meteorite listed in Table 3 would be expected to contain a trace of C-14 formed by spallation reactions with cosmic rays before its entry into Earth's atmosphere.
TABLE 3. AMS Data for "Infinite" C-14 Age Samples. Data from seven laboratories reporting in Radiocarbon 28(2A):177-244. Column four is derived from column three.
Assuming that "infinite" age samples are components of deposits made during the flood episode, and adding 72-96% to estimate C-14 activity at the time of burial/formation, the .0072-.0011 range in column 4 of Table 3 becomes .014-.002, or 1/71-1/500. The 1/71-1/500 range fraction of modern C-14 concentration could be entirely contamination during sample handling and preparation. There is also a possibility that it could be largely residual C-14. If residual C-14 is present, the 1/71-1/500 range probably represents varying proportions of residuum and contamination. From the perspective of a C-14 age model that includes the historical and chronological data in the first eleven chapters of Genesis, one can postulate that since the Noachian flood the biosphere C-14/C-12 ratio has increased more than 70-fold, yet probably less than 500-fold. Modeling considerations for such an increase have been discussed in Brown (1979).
CONCLUSIONS
In the opinion of the writer, the extended and more intensive investigations reported here provide increased credibility for the conclusion offered in my 1975 treatment, viz., that C-14 ages in the prehistoric range should be expected to be progressively in excess of the real time involved.
While confidence in the historical and chronological data in the first eleven chapters of Genesis must be based on considerations which are independent of radioisotope-age data and accessible to individuals who are not in a position to understand such data , every effort should be made to develop a composite view (model) which harmonizes the data from these two sources. Those who seek such harmonization on a soundly logical and broad scientific base may find in the quantitative analysis presented here encouragement for assignment of the total range of C-14 dates for plant and animal remains to a 5000-year span of real time since the world cataclysm portrayed in Genesis 7 and 8.
LITERATURE CITED
Brown, R. H. 1975. C-14 age profiles for ancient sediments and peat bogs. Origins 2:6-18.
Brown, R. H. 1979. The interpretation of C-14 dates. Origins 6:30-44.
Brown, R. H. 1980. Re: The interpretation of C-14 dates. Origins 7:9-11.
Brown, R. H. 1986. 14C depth profiles as indicators of trends of climate and 14C/12C ratio. Radiocarbon 28(2A):350-357.
Clymo, R. S. 1984. The limits of peat bog growth. Royal Society (London) Philosophical Transactions B303:605-654.
Hasel, G. F. 1980a. Genesis 5 and 11: chronogenealogies in the biblical history of beginnings. Origins 7:23-27.
Hasel, G. F. 1980b. The meaning of the chronogenealogies in Genesis 5 and 11. Origins 7:53-70.
Hecht, A. D. (ed.). 1985. Paleoclimate analysis and modeling. John Wiley & Sons, New York.
Kromer, B., M. Rhein, H. Schock-Fischer, K. O. Münnich, M. Stuiver, and B. Becker. 1986. Radiocarbon calibration for the 6th to 8th millennia B.C. Radiocarbon 28(2B):954-960.
Nambudiri, E. M. V., J. T. Teller, and W. M. Last. 1980. Pre-Quaternary microfossils a guide to errors in radiocarbon dating. Geology 8:123-126.
Smith, R. I. L. and R. S. Clymo. 1984. An extraordinary peat-forming community on the Falkland Islands. Nature 309:617-620.
Smith, R. I. L. and P. A. Prince. 1985. The natural history of Beauchêne Island. Biological Journal of the Linnean Society 24:233-284.