This article discusses the basic principles and assumptions of radiocarbon age dating. The author points out the difference between real time and radiocarbon age determinations which have to be adjusted to agree with Bristlecone Pine chronology or biblical chronology. Also, a variety of models for the past history of the earth that might affect the accuracy of radiocarbon ages is evaluated. Variation in the intensity of cosmic rays which produce C-14 is not considered by the author to be a significant source of discrepancy, since evidence indicates that in the past there has not been a significant change in the cosmic ray intensity. Changes in the geomagnetic field which diverts cosmic rays might make C-14 dates appear as much as 11,000 years too old. The influence of changes in the magnetic field of the sun on cosmic rays produces a negligible effect. Higher upper atmosphere water vapor content in the past would produce little effect, since a model based on our present knowledge of molecular relation- ships would allow for only limited changes. The author suggests that the most significant change in the relationship of C-14 dates to real time could come from a dilution of the C-14 by a significantly larger biosphere in the past. An increase of more than two orders of magnitude in this biosphere could make C-14 dates appear 51,000 years too old.
The Radiocarbon Age Concept
The radiocarbon "date" or age for a specimen is a statement of the length of time that would be required for a specimen from an idealized contemporary environment to lose by spontaneous radioactive transformation sufficient carbon-14 (C-14) to have the same C-14 concentration as found in the test specimen. Radiocarbon age is a convenient and useful way to express the concentration of C-14 in natural organic and sedimentary material. The idealized contemporary environment reference level is 1.18×10⁻¹² C-14 atom per C-12 atom (one C-14 for 848 billion C-12 atoms), which is equivalent to an average of 13.6 disintegrations of C-14 per minute per gram of carbon.
The better-equipped radiocarbon dating laboratories using the conventional gas or scintillation counting technique are capable of detecting concentrations of C-14 as low as 1.4×10⁻¹⁵ (one atom of C-14 per 700 thousand billion C-12 atoms). To reach a concentration this low by radioactive decay from the contemporary reference level would require in the order of 55,000 years at the rate C-14 now spontaneously converts to nitrogen-14 (N-14). Accordingly, the maximum age range of radiocarbon dating by conventional disintegration rate techniques is said to be approximately 55,000 years. Techniques under development for directly counting C-14 atoms by means of nuclear accelerators hold promise of extending this range to the vicinity of 70,000 years (Bennett 1979). "Infinite age" is commonly assigned to a specimen that has a C-14 concentration below the detection threshold of the procedures by which it was analyzed. In practice radiocarbon laboratories are reluctant to specify a radiocarbon age greater than 40,000 due to uncertainties with respect to contamination from younger C-14.
A radiocarbon age can have meaning in terms of real time only over time periods during which there has been no introduction of C-14 into the specimen and no loss of C-14 other than by spontaneous radioactive decay. Another way of stating the same restriction is to say that there has been no chemical contamination, that the specimen has been chemically isolated. Under this restriction a radiocarbon age will be directly equivalent to a real-time age if the C-14 concentration in the specimen was initially at the contemporary reference level, and if C-14 radioactive decay has not varied from its present rate. There are no theoretical considerations or experimental data that suggest there has been a significant variation in the decay rate (half-life) (Brown 1974). The initial C-14 concentration must be assumed on a speculative basis, unless calibration by a reliable independent dating technique is available.
Conversion of Radiocarbon Age into Corresponding Real Time
Work that has been done to determine the initial C-14 concentration in the past and make possible a conversion of radiocarbon age into real-time age has been reviewed in Origins, Volume 2, Number 1 (Brown 1975a). Evidence is given there which strongly suggests that in the more remote ancient times the initial C-14 concentration was much lower than has been the case over the past three or four thousand years. Additional evidence of this nature has been presented in the Creation Research Society Quarterly (Brown 1975b).
Since this material was published additional analysis has been made of accumulation rates for over 280 peat and sediment features described in Radiocarbon, volumes 8-17 (1966-1975). For the time range represented by C-14 ages 0-4000 the worldwide average accumulation rate for the sedimentary features was determined to be 1.295±0.317 mm per C-14 year. For peat bogs the corresponding average accumulation rate was determined to be 0.726±0.125 mm per C-14 year. For the time range represented by C-14 ages 15,000 - "infinite," the corresponding accumulation rates were found to be 0.333±0.166 mm per C-14 year and 0.203±0.091 mm per C-14 year, respectively. When comparing the 0-4000 with the 15,000 - "infinite" C-14 age, these results specify a sediment accumulation rate ratio of 3.89±2.14 and a peat accumulation rate ratio of 3.58±1.72. The magnitude of these ratios, particularly that for sediments, rules out compaction as a satisfactory explanation for the apparently lower accumulation rates in time greater than that which is associated with a C-14 age of 15,000. One must account for the apparent lower accumulation rates as an indication of less favorable conditions for erosion, sedimentation, and peat growth or as an indication of a lower C-14 concentration in the early biosphere.
A specimen that began its existence with a C-14 concentration lower than the standard contemporary reference level would reach the C-14 concentration it has at present in less time than is suggested by its conventional radiocarbon age.
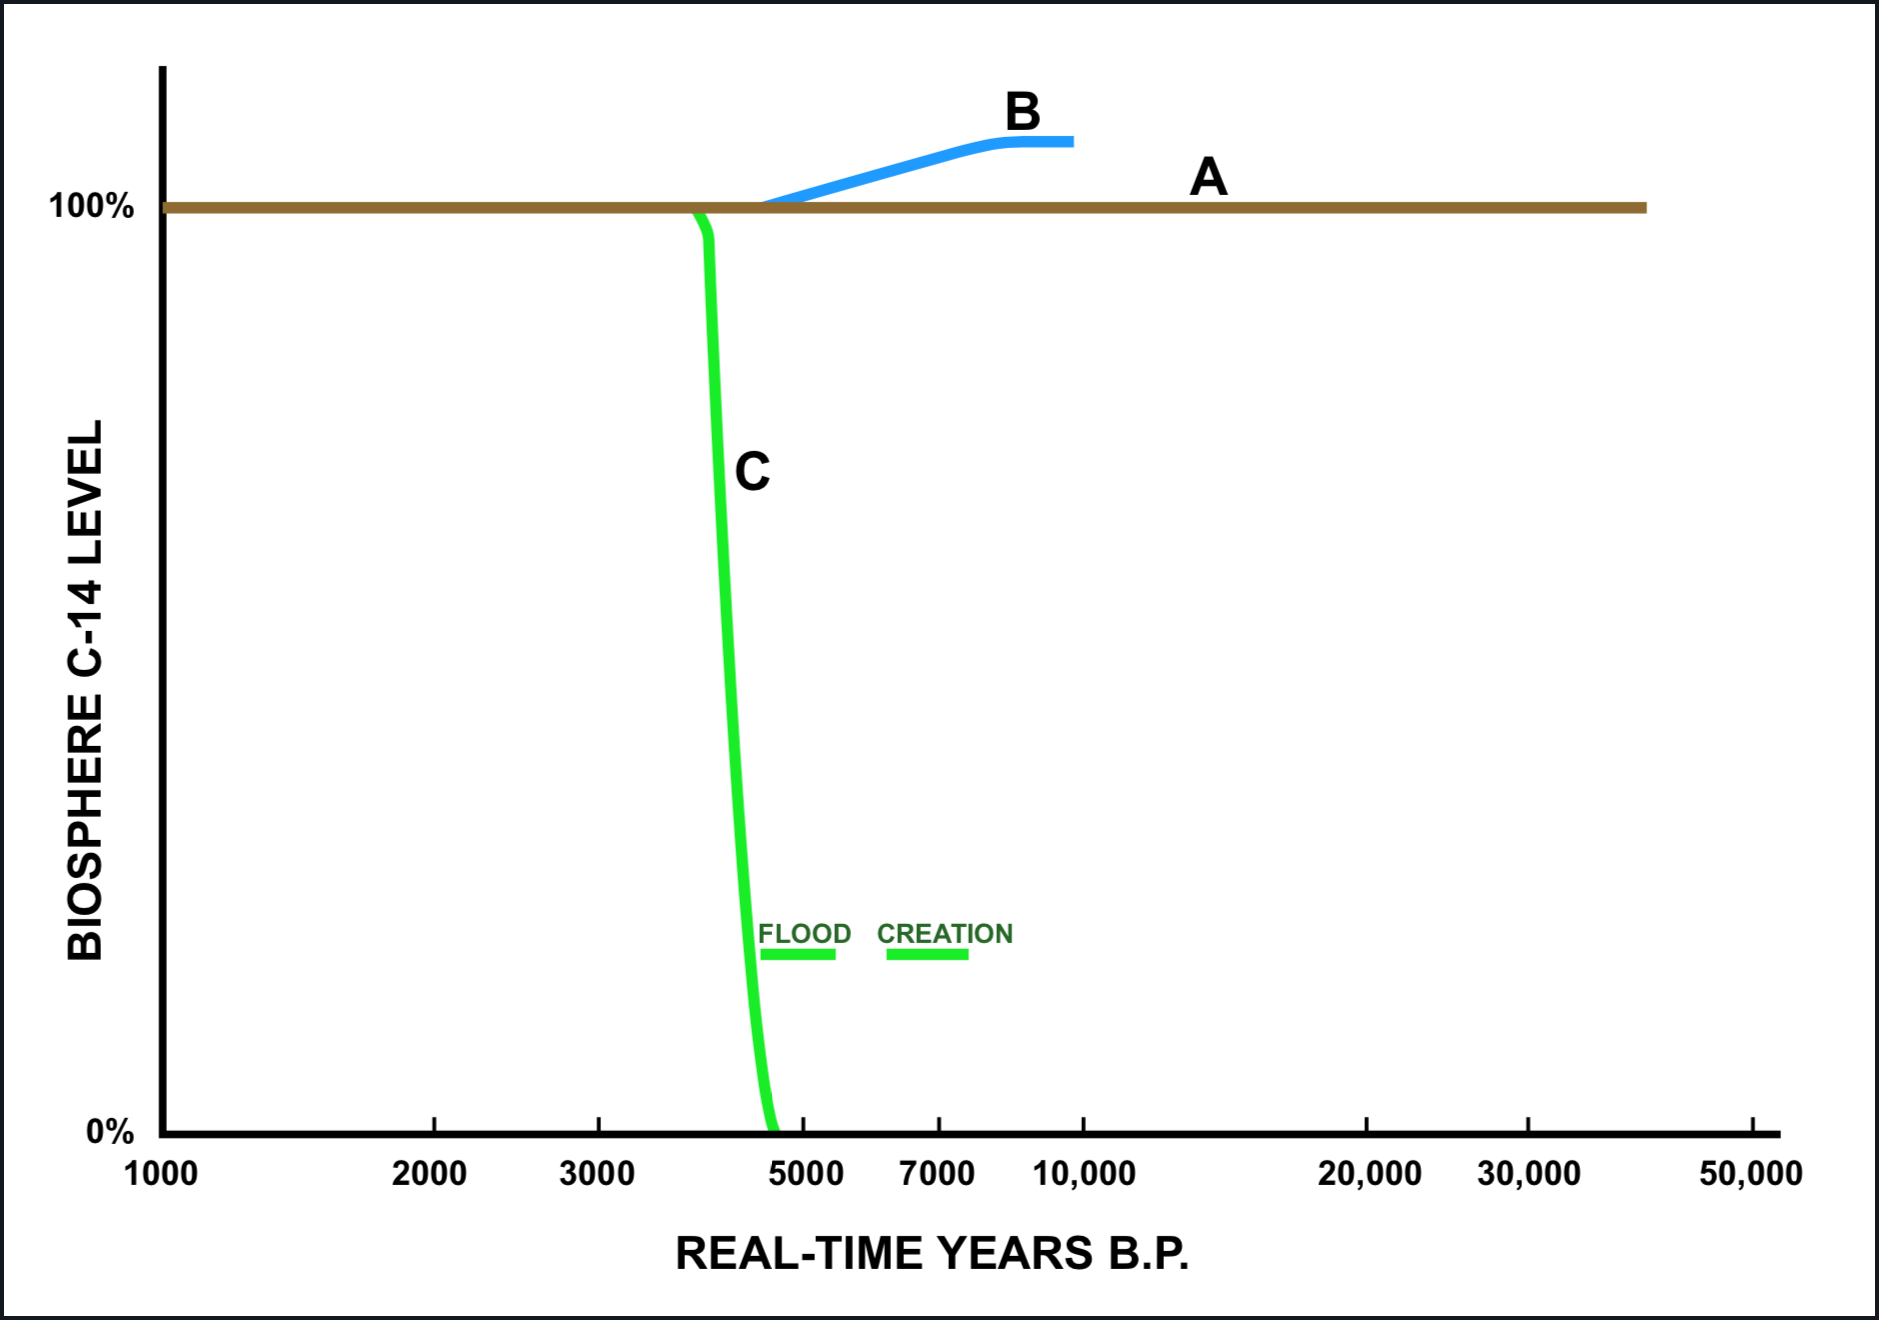
Figure 1 depicts a first-approximation for the initial C-14 concentration, according to three models for converting radiocarbon age into a real-time age. The contemporary reference level is specified as "100%" in this figure. Curve A represents the situation as it would have been if the initial C-14 concentration had been essentially the same as the contemporary reference level throughout the full range of radiocarbon dating. Curve B represents the initial C-14 concentration required by the currently accepted Bristlecone Pine dendrochronology (Ralph et al. 1973). Curve C depicts a situation that would be compatible with the chronological implications of the first eleven chapters of Genesis, taking into account the demonstrated approximate equivalence between radiocarbon ages and real-time at least as far back as 3500 B.P. and the absence of detectable concentrations of C-14 in material that can confidently be considered to have been buried at the time of the flood (anthracite coal, deep-well oil, most natural gas, e.g.). The horizontal bars designated "Flood" and "Creation" span the time range between the dates for these events as estimated by a straightforward application of the data in the Masoretic text (left end) and the Septuagint text (right end).
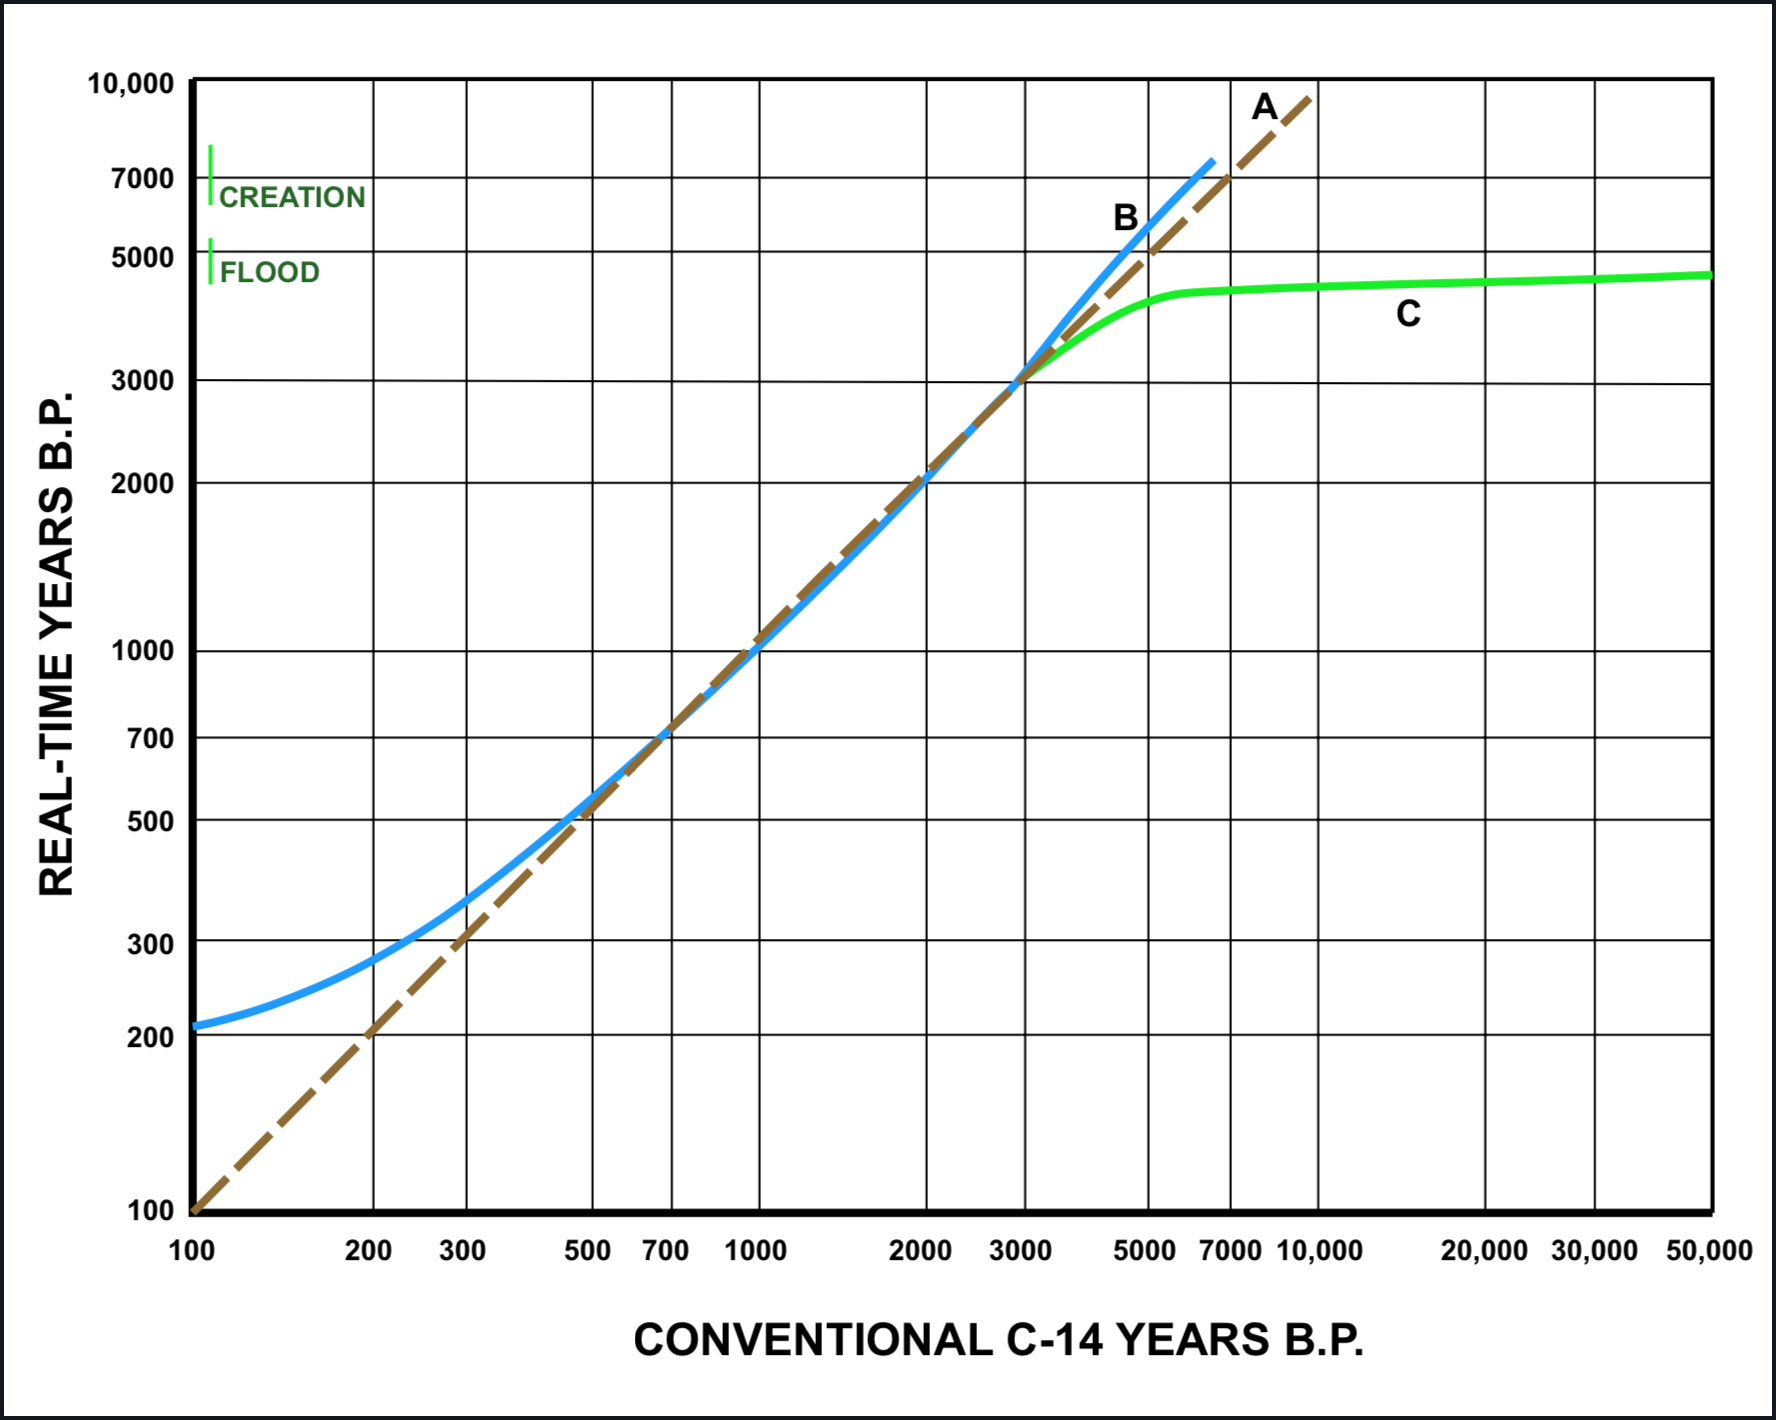
FIGURE 1. Models for Biosphere C-14 Level. The idealized contemporary reference level is specified as "100%." A: Strictly uniform conditions model. B: First approximation for current Bristlecone Pine dendrochronology model. C: First approximation for biblical chronology model requirements.FIGURE 2. Radiocarbon Age Conversion. First-approximation conversion of conventional C-14 age into real-time age for the models depicted in Figure 1.
Figure 2 is a chart for first-approximation conversion of conventional radiocarbon ages into real time according to each of the models represented in Figure 1. This chart makes no distinction between the "B" model and the "C" model over the range for which dendrochronological calibration is indisputable. The B curve is a smoothed trend line for the MASCA (Museum Applied Science Center for Archaeology) radiocarbon age conversion data. For greater detail the MASCA charts and tabulations should be consulted (Ralph et al. 1973).
Possibly the first intensive effort to provide a scientific base for interpretations of radiocarbon ages as suggested by the C curves in Figures 1 and 2 was made in the early 1960s by Henry F. Pearl (1963). Other efforts include Whitelaw (1968) and Clementson (1974).
Variability of Initial C-14 Concentration
The model depicted by line C in Figures 1 and 2 translates conventional radiocarbon ages from "infinity" to approximately 3500 into a real-time age range no more than about 1800 years. Some support for this model has already been cited (Brown 1975a, 1975b, and above). Are there reasonable factors that could account for so great a compression of the radiocarbon age range? The reasonableness of the following effort to answer this question may depend in part on the confidence of the reader in the historical authenticity of the first eleven chapters of Genesis.
Influence of Cosmic Ray Intensity Variation on C-14 Ages
Since C-14 is cosmogenic, i.e., formed by interaction with primary cosmic radiation, there is a possibility that changes in the cosmic ray intensity have brought changes in the biosphere C-14 concentration, as has been the case with nuclear weapon tests. An encounter between a primary cosmic ray particle and an atom often results in the atom being broken up into smaller atoms. Some of these smaller atoms are unstable, i.e., radioactive. Cosmogenic radioactivity in meteorites and rocks from the moon provides a measure of cosmic ray intensity in the past. After exposure of a meteoroid or moon rock to a constant cosmic ray intensity for a time equal to about four half-lives, a cosmogenic radioactive nuclide formed therein reaches an equilibrium concentration at which the number of new atoms formed within a given period of time is equal to the number that experience radioactive decay during the same time. The half-lives for the more than 20 cosmogenic radionuclides found in meteorites and moon rocks cover the range from 5.7 days to 3.7 million years (Shedlovsky et al. 1967; Trivedi and Goel 1973). Within the uncertainty of experimental determinations, these nuclides (manganese-52, aluminum-26, beryllium-10, manganese-53, e.g.) are found to be in equilibrium with the present intensity of cosmic radiation. From these observations it is apparent that the present cosmic ray intensity is essentially the same as the average that has been maintained for longer than any period that can be covered by radiocarbon dating. The experimental data also indicate that any short-time variation of the galactic cosmic ray intensity about the average that may have occurred during this time has been within a factor of two (Forman and Schaeffer 1979).
A change in the C-14 concentration by a factor of two would shift the radiocarbon time scale by only 5730 years one half-life. Therefore fluctuations that may have occurred in the cosmic ray intensity cannot be expected to have produced a discrepancy of more than about 5700 years between any radiocarbon age and equivalent real time. In my judgment there is not a sound basis for assigning any C-14 age discrepancy to the cosmic ray intensity factor.
Influence of Geomagnetic Field on C-14 Ages
Only the cosmic ray particles that reach Earth's atmosphere are effective in producing C-14 in the biosphere. The magnetic field of the Earth deflects a large proportion of the incoming cosmic ray particles so that they do not interact with the atmosphere. It has been reliably estimated that if the present geomagnetic field were to completely disappear the C-14 production rate would double (Kigoshi and Hasegawa 1966; Lingenfelter and Ramaty 1970). An eleven-fold increase in the geomagnetic field would reduce the C-14 production rate to one-fourth its present value. An increase in the order of 100-fold would be required to bring the production rate near zero.
Since ionizing radiation is harmful to organisms it is to be expected that when life was originally placed on this planet a mechanism for protection from radiation damage was provided. This protection could have been afforded by a capability for healing radiation damage to tissue, a capability that has largely diminished by the present time. It seems more reasonable to presume that such protection was provided, at least in a large measure, by a radiation shield that isolated the biosphere from cosmic radiation.
One can postulate that prior to a catastrophic event such as the Genesis flood the geomagnetic field was strong enough to hold the production of C-14 in the atmosphere to a negligible level. Since the mechanism by which the geomagnetic field is maintained is not understood, there is little restraint against postulating that this field may have been 100-fold greater in the world that was destroyed during the flood episode. But there is no evidence (paleomagnetism of sediments and intrusives in Cambrian and Precambrian formations) that the geomagnetic field strength has ever been so great. With the evidence presently available, it seems to me wisest to suggest that the geomagnetic field was probably greater before the flood than it is at present, but possibly no greater than sufficient to hold the worldwide C-14 production rate to in the order of one-fourth its present value. A factor of one-fourth would reduce the real-time equivalence of the radiocarbon time scale range by two half-lives 11,460 years.
Magnetic field effects produced by the sun also influence the rate at which cosmic ray particles interact with Earth's atmosphere. Solar magnetic effects are considered to be a primary cause of the observed fluctuations of radiocarbon age about the average trend that is indicated by the B curve in Figure 2 (Lingenfelter and Ramaty 1970; compare the curves in Ralph et al. 1973). There does not appear to be any need to consider solar magnetic effects in seeking an explanation for order-of-magnitude discrepancies.
Influence of Upper Atmosphere Water Vapor Content on C-14 Ages
A magnetic field is not the only means by which the biosphere could have been shielded from the harmful effects of cosmic radiation. The destruction of the original surface features of our planet in the flood experience could have been accompanied by a reduction in the water content of the atmosphere that resulted in conditions more favorable to C-14 production. From Genesis 2:5, 6 it has appeared to many Bible students that in the preflood world moisture requirements of plants were met by a subsoil water supply and heavy dew. Heavy dew implies an atmosphere nearly saturated with water vapor (near 100% relative humidity) during most of a typical 24-hour cycle. Such a condition would provide a comfortable climate if the temperature remained cool.
Over the region in which most biosphere C-14 is presently produced 20 km to 75 km above sea level the barometric pressure varies from approximately 55 mm Hg to 0.025 mm Hg, and the temperature varies from -56ºC to -75ºC, respectively, with a temperature maximum of about +10ºC at the 47-53 km level (Handbook of Chemistry and Physics 1970). At these temperatures the saturated vapor pressure of water (or ice) ranges from 0.0138 mm Hg up to 9.2 mm Hg and then down to 0.00105 mm Hg. At the 47-53 km level the ratio of water molecules at +10ºC saturation to nitrogen and oxygen molecules would range between 7.5/1 and 15/1. At the 20 and 75 km levels the corresponding ratio is 0.0025/1 and 0.042/1 respectively. At sea level only 3.6% (ratio of 1/28) of the atmosphere molecules are H2O under conditions of complete water vapor saturation (100% relative humidity) at 27ºC (81ºF).
To estimate C-14 production in a hypothetical preflood atmosphere, let us assume relative humidity near 100% at all levels and a temperature profile similar to that which is now characteristic of the atmosphere in the 20-75 km region. We do not have enough information to construct an atmosphere model that meets the specifications of Genesis 1:6, 7, and are confident that the present temperature profile would be incorrect for such a model, but offer the following as an indication of the limited influence atmospheric water vapor can have on C-14 production. Let us compare an atmosphere with a maximum ratio of H2O molecules to N2 + O2 molecules of 1/28 with an atmosphere for which this ratio ranges between 0.0025/1 and 7.5/1, 7.5/1 and 15/1, and 15/1 and 0.042/1. For a rough estimate the latter can be assumed to have a weighted average of 6/1, giving a comparison between atmospheres with water molecule ratios of 1/28 at sea level and 6/1 higher up in the biosphere.
Neutrons released by the breakup of nitrogen and oxygen atoms as a result of an encounter with a primary cosmic ray particle may convert nitrogen-14 into carbon-14, hydrogen-1 into hydrogen-2, nitrogen-14 into nitrogen-15, or oxygen-16 into oxygen-17. The probabilities for these reactions, expressed in the standard nuclear reaction probability units, are respectively: 1.82, 0.332, 0.075, and 0.000,18 barns. The reactions with other isotopes of nitrogen, hydrogen and oxygen are too infrequent to be of concern in this discussion. Given an equal number of encounters of neutrons (thermal) with nitrogen and hydrogen, the ratio of C-14 to H-2 production will be 1.82/0.332 = 5.5/1.
Since standard air contains 78% nitrogen molecules, the ratio of water molecules in the atmosphere mixtures we are comparing become 1/22 and 6/0.78, rather than 1/28 and 6/1. For a rough estimate it will suffice to use 1/22 and 8/1. In order to compare the nitrogen molecules with hydrogen molecules equivalent we should use the ratios 22/1 and 1/8, since each water molecule contains two hydrogen atoms, and each nitrogen molecule is composed of two nitrogen atoms.
With the foregoing stipulations we have a C-14 to H-2 production ratio of 5.5/1 × 22/1 = 121/1 in an atmosphere that has the same composition as 100% moisture-saturated sea-level air. Of the C-14 and H-2 atoms produced under these circumstances 99.2% would be C-14 [1]. In 100% moisture-saturated air for the average conditions hypothesized at 20-75 km altitude this ratio is 5.5/1 × 1/8 » 0.7/1. Under such circumstances approximately 40% of the combined C-14 and H-2 production would be C-14. The reader should be cautioned again that the atmospheric model presented here is extremely crude; it requires impossible values of total gas pressure in the 47-53 km region, and unreasonably large H2O/(N2 + O2) ratios. A reduction from 99.2% to 40% is in the ratio 1/2.5 = 1/21.3, which would correspond with a 1.3 half-life compression of the real-time range of the C-14 age scale, only about 7500 years. A more realistic model for a water vapor saturated preflood atmosphere would prescribe a smaller C-14 age correction.
Influence of Biosphere Carbon Inventory on C-14 Ages
The most significant line of reasoning concerning possible mechanisms for a compression of the C-14 age scale is based on estimates of the amounts of non-radioactive carbon in which C-14 has been distributed. C-14 can be compared with red coloring used to make white cake into pink cake. The larger the amount of cake batter into which a given amount of coloring is placed, the less pink the cake will be. It has already been pointed out that the ratio between C-14 and C-12 in the contemporary reference atmosphere is 1/(848 billion). Since the beginning of the industrial revolution this ratio has progressively reduced as a result of burning fossil fuels (Wilson 1978; Nozaki et al. 1978). The combustion of fossil fuel introduces into the atmosphere CO2 that does not contain C-14 and restores to the biosphere carbon from a more luxuriant period in the past.
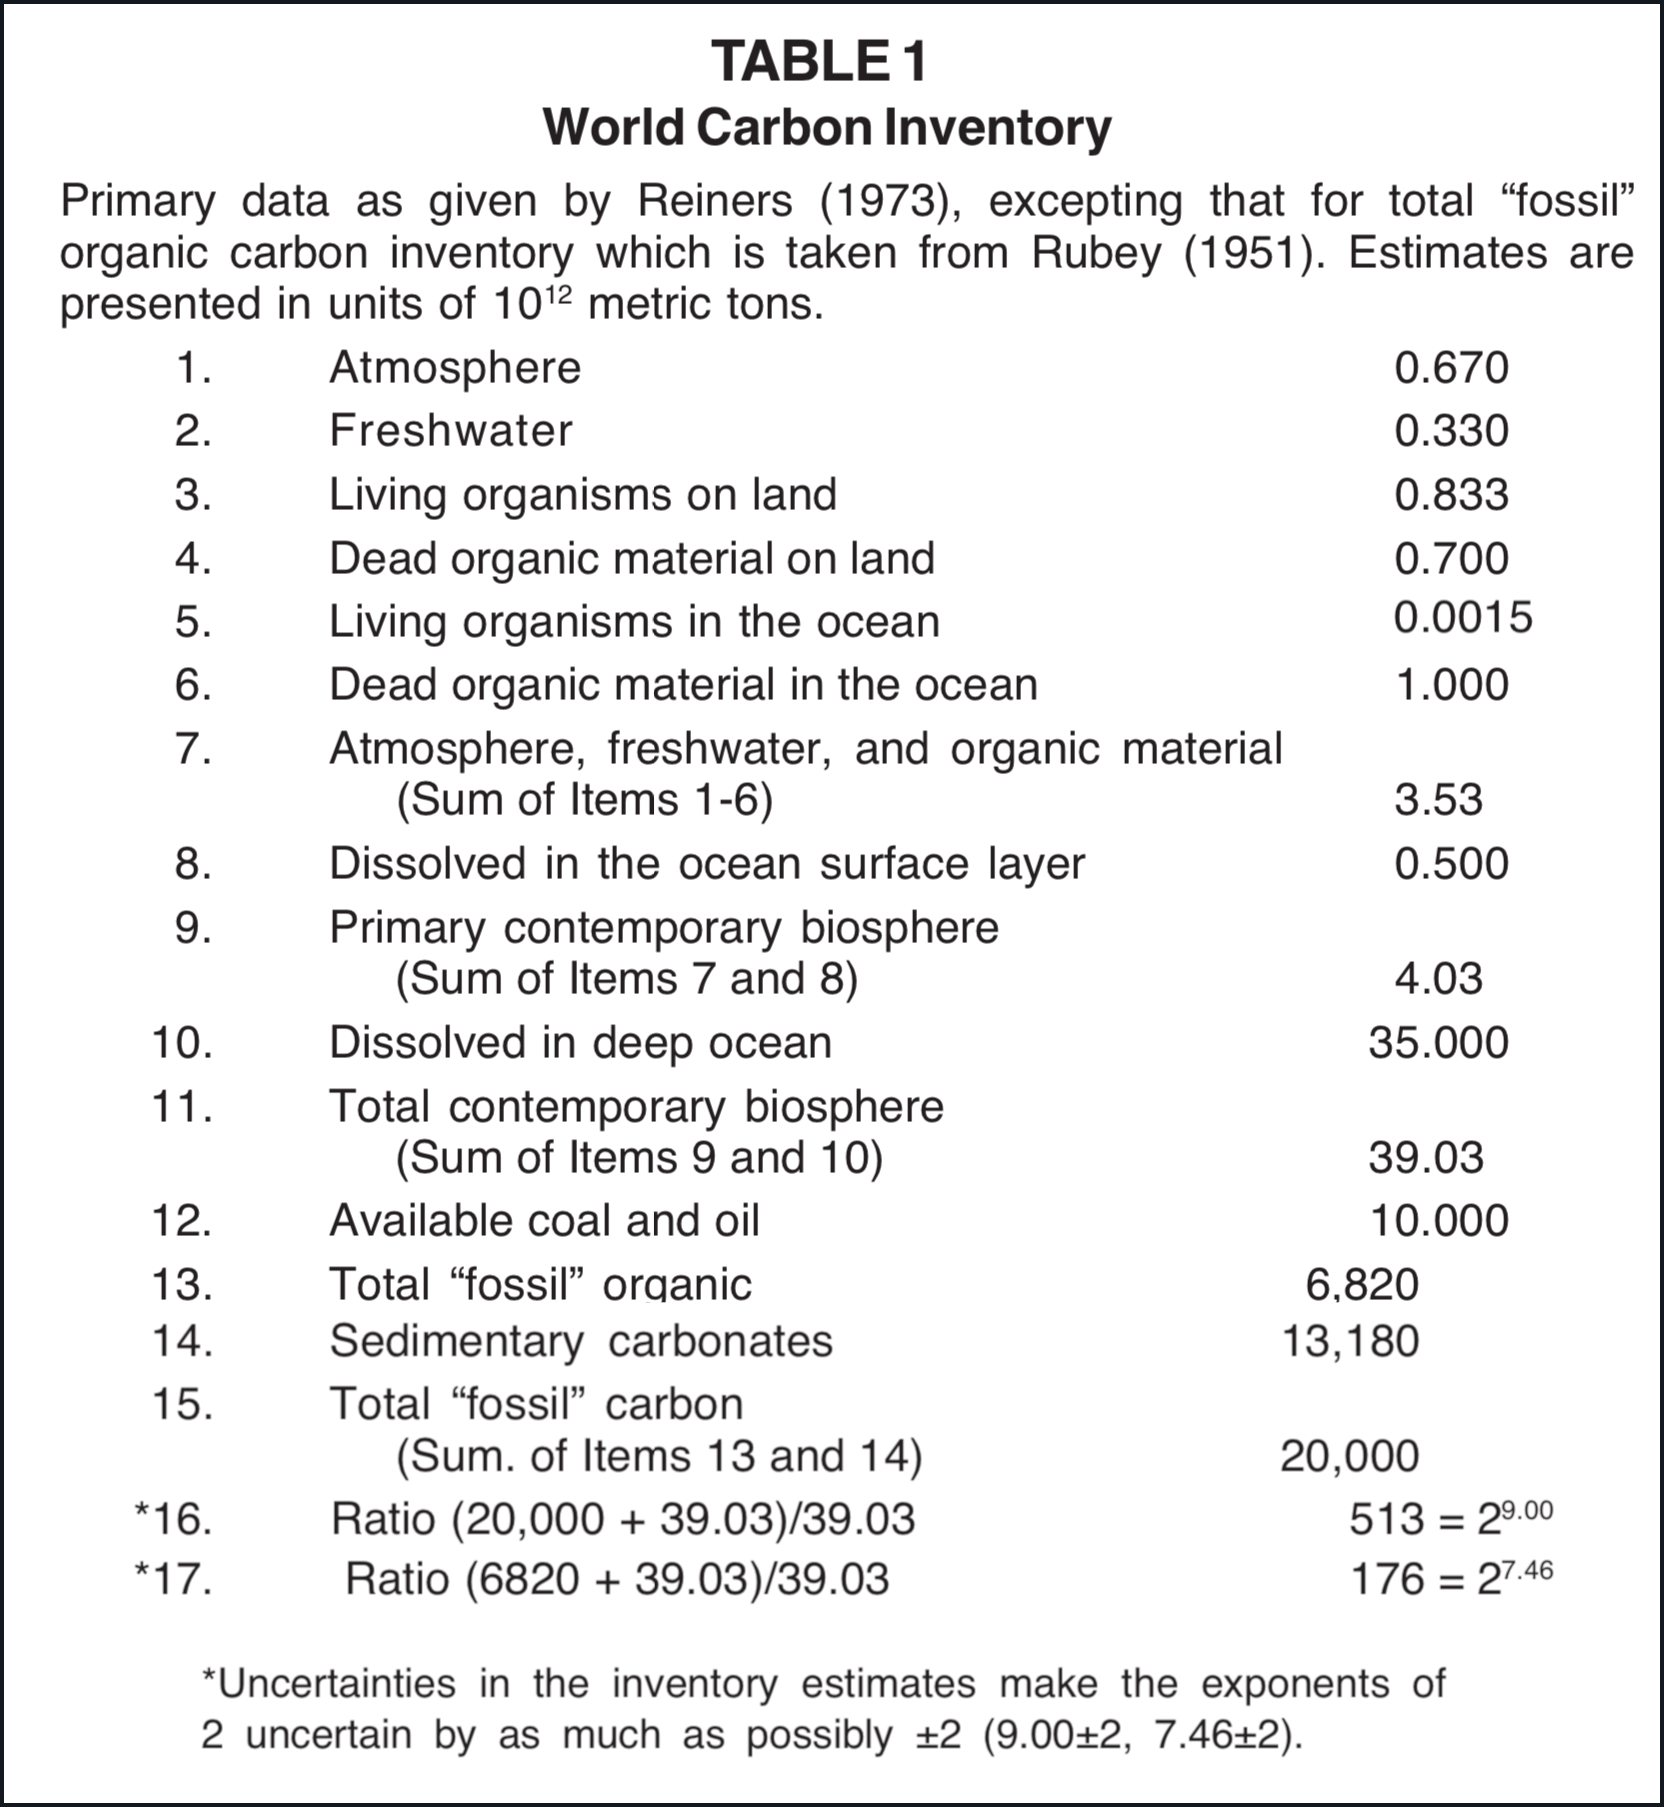
Estimates that have been made of the world carbon inventory are in general agreement (Borchert 1951; Rubey 1951; Revelle and Suess 1957; Bolin 1970; Fairhall and Young 1970; Reiners 1973; Woodwell et al. 1978; and Hall 1979). The estimate that developed out of the 24th Brookhaven Symposium in Biology in 1972 (Reiners 1973) is utilized in Table 1. The estimate for the total "fossil" organic carbon inventory given in Table 1 is taken from William Rubey (1951). The term fossil is here used within quotation marks to indicate that some of the buried organic carbon may be primordial rather than associated with organisms. According to the data given by Reiners, the total carbon inventory in the present biosphere is less than one five-hundredth of the total "fossil" carbon inventory. On the basis of the estimate given by Rubey, the ratio of total carbon inventory in the present biosphere to the total "fossil" organic carbon inventory is 1/176.
Presuming that the fossil carbon was removed from the biosphere by the flood, one can postulate that the preflood biosphere contained in the order of 500 times more carbon than does the contemporary biosphere. If the same world inventory of C-14 as is now maintained were distributed in this preflood biosphere the level of C-14 activity would have been about 1/500 the contemporary reference level. Since 500 = 28.97 approximately nine C-14 half-lives or 51,000 years of the radiocarbon time scale can be accounted for in this way.
Even if one assumes that no sedimentary carbonates were formed during and after the flood and that all present "fossil" organic carbon was buried by the flood, the reduction in the active biosphere carbon inventory resulting from flood burials is 176-fold, according to Table 1. On this basis the apparent C-14 age of plant and animal material at the time of the flood would be 42,730 (7.46 × 5730), assuming that the world C-14 inventory at that time was the same as has been characteristic of contemporary times. Since the chronological data in the Bible places the flood approximately 5000 years ago, at the present time this material would have a C-14 age in the order of 48,000. The remaining difference between 48,000 and "infinite" (50,000 - 55,000 in practice) C-14 age can be accounted for by assuming that some sedimentary carbonates were formed during and following the flood. One only has to postulate that about 1/6 of the sedimentary carbonates were formed during and after the flood to account for a 45,000 reduction totally on the basis of carbonate precipitation and organism burial [2].
Summary of C-14 Time-Scale Adjustment Factors
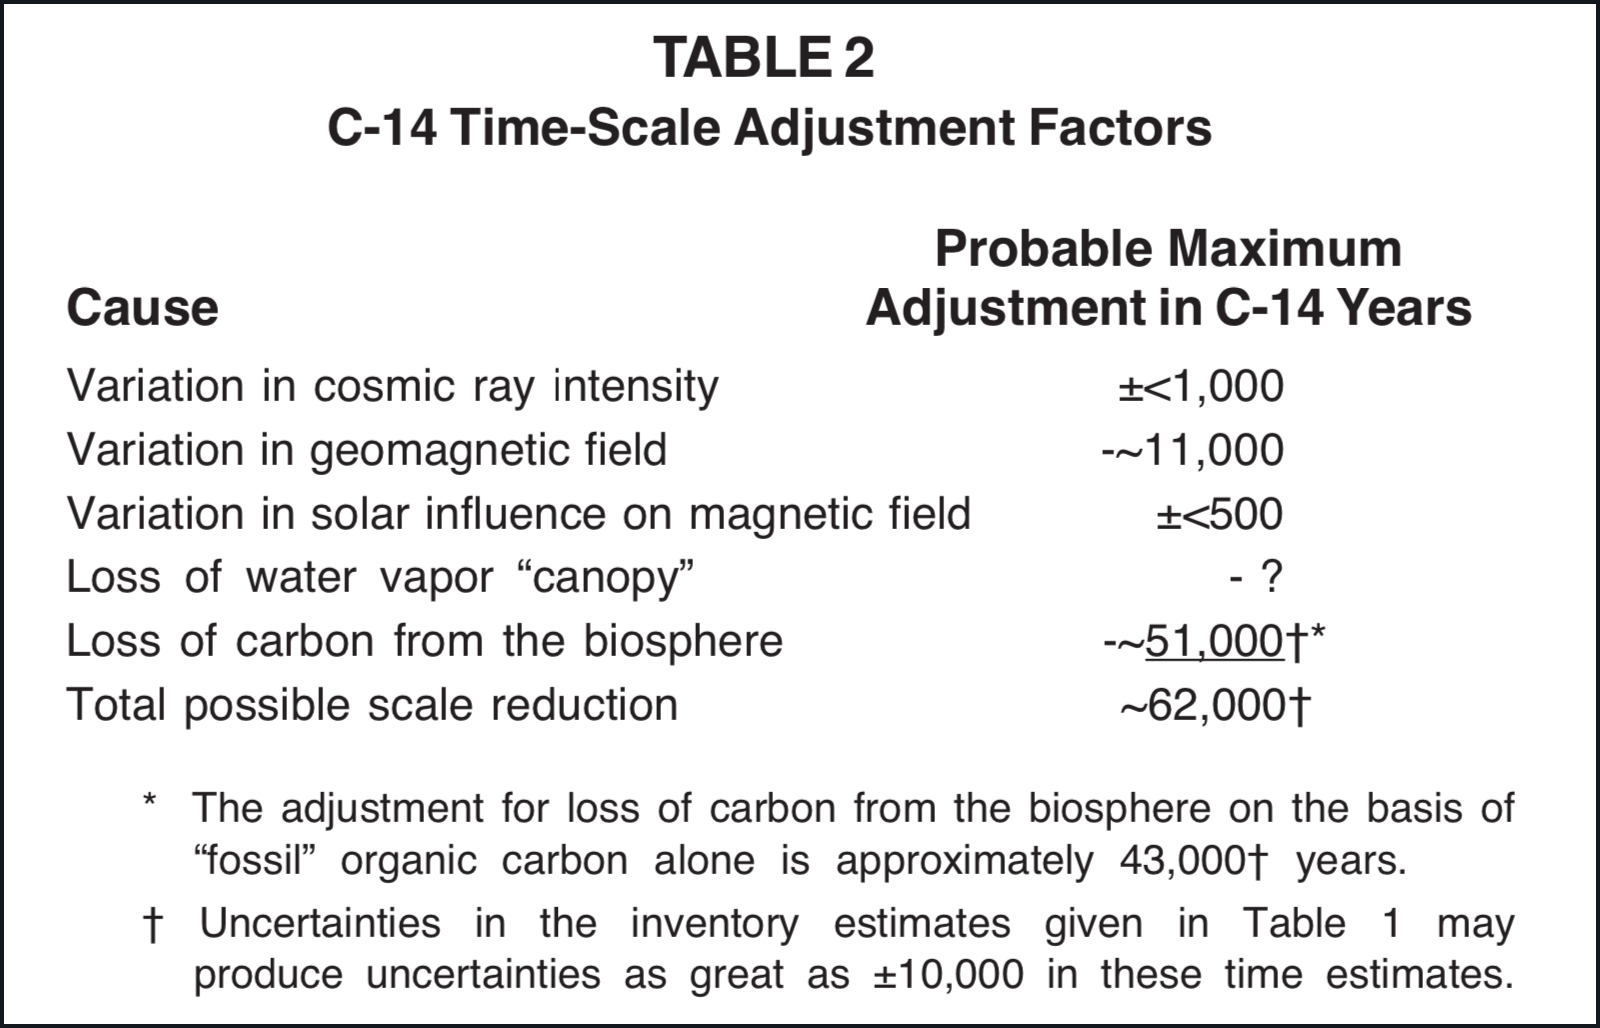
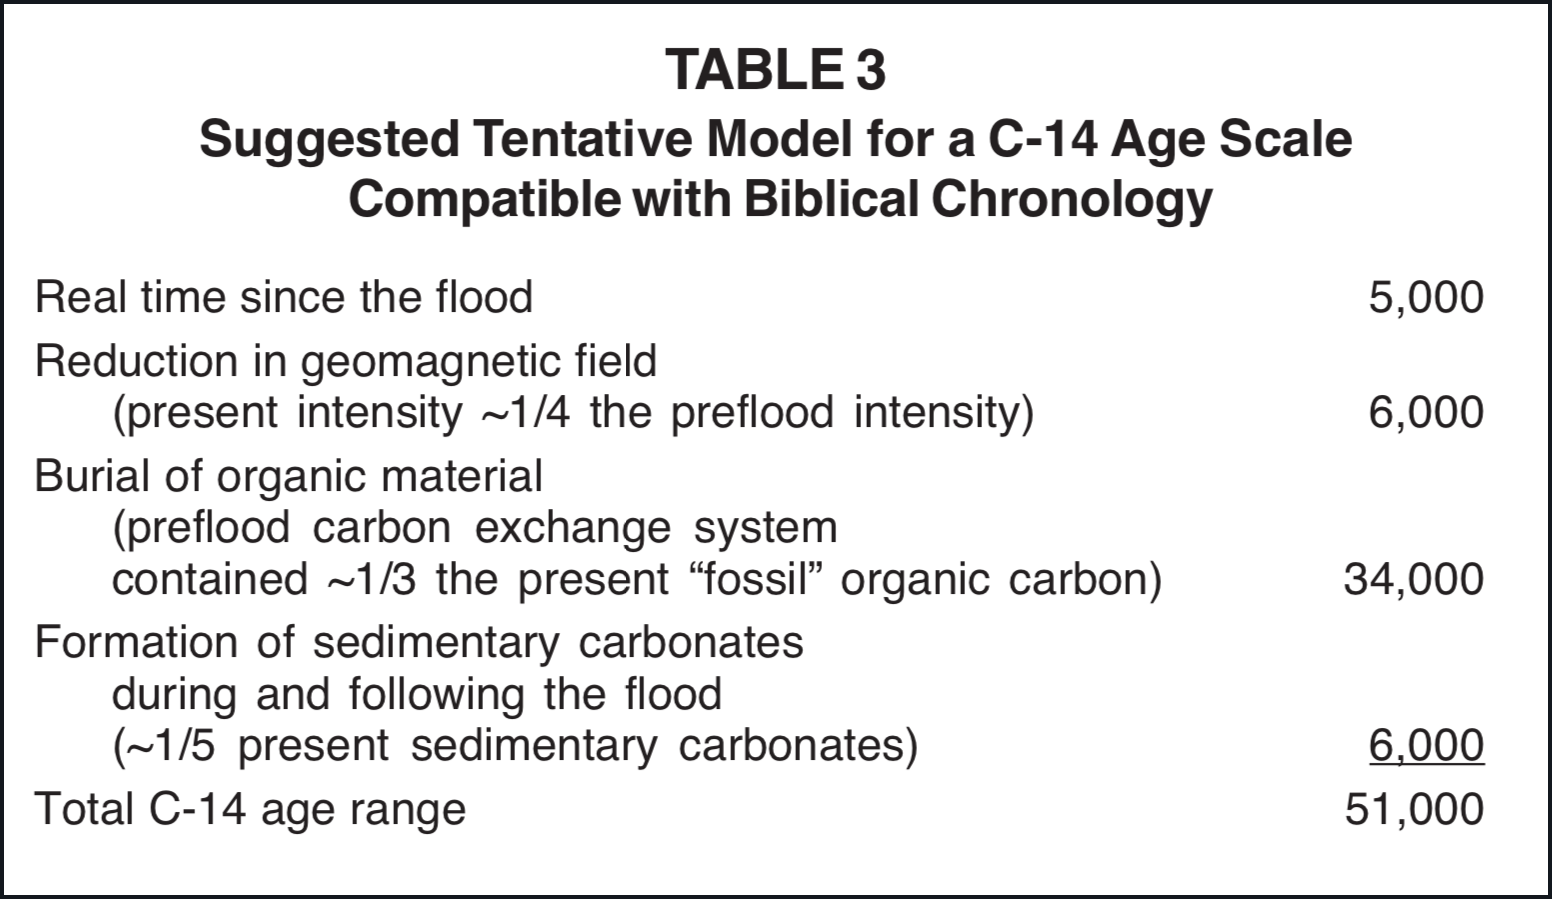
The physical possibilities for an adjustment of the radiocarbon time scale to chronological requirements implied in the Bible, as discussed in this paper, are summarized in Table 2. Since a scale reduction of only 45,000 C-14 years is required by the C Model depicted in Figures 1 and 2, it is apparent that this model does have a reasonable physical science base. Although the estimates summarized in Table 2 are at best only rough approximations, they seem to clearly establish that geomagnetic field reduction, upper atmosphere water vapor depletion, and biosphere carbon loss that are likely to have been associated with the flood can account for changes in the C-14 concentration that would be adequate for a conversion of radiocarbon ages into real time in a manner that is in agreement with the chronological boundary conditions given in the Bible. Table 3 suggests one way in which these factors might be combined to account for the total C-14 age range.
The model suggested in Table 3 requires a preflood biosphere carbon inventory nearly 130× greater than that of the contemporary biosphere. Many individuals do not consider so great a biosphere carbon inventory to be reasonable. It is unquestionable that a world with a biosphere containing this much carbon would be distinctly different from our present world. It is reasonable to presume that in the preflood world organisms were larger and more abundant and that the portion of the planetary surface capable of supporting luxurious growth was possibly two orders of magnitude greater than at present (e.g., see Table 4-2 of Whittaker 1970), but it should be recognized that if the 130× increase is to be accounted for entirely by carbon in organic compounds, an increase of much more than 1000× is required. I do not believe that sufficient certain knowledge concerning the preflood world is available to either eliminate or adequately model this possibility.
In selecting the last two items of Table 3, 39.03×10¹² metric tons of carbon was used for the contemporary biosphere reference, as for items 16 and 17 of Table 1. For the purpose of estimating C-14 concentrations this procedure probably places excessive emphasis on the deep ocean (Table 1, Item 10). With the presently available data on C-14 concentration the deep ocean should probably be assigned a weight factor of approximately 85% in comparison with the upper biosphere as a C-14 reservoir (Broecker 1974, p. 66). Accordingly the denominator in items 16 and 17 of Table 1 would be 0.85 × 35,000 + 4.03 = 33.8 rather than 39.03. This adjustment would permit use of slightly smaller fractions of "fossil" carbon and/or sedimentary carbonate for the last two items of Table 3.
Conclusion
From the foregoing considerations it appears that data now available for the concentration of C-14 in the biosphere together with reasonable estimates for the active and fossil carbon inventory provide justification for confidence that C-14 age data for time prior to approximately 3500 B.P. are associated with a transition between the pre-biblical-flood biosphere and the contemporary biosphere.
FOOTNOTES
[1]High altitude rocket soundings have provided data which indicate that the present water vapor concentration at altitudes above 10 km is less than 20 parts per million (Harries et al. 1976; Scholz et al. 1970), more typically less than 5 parts per million (Evans 1974). The production of H-2 by neutron capture is negligible in comparison with the production of C-14 under these circumstances.
[2]39.03/(39.03 + 6820 + 13,180/6) = 1/232. 232 = 27.86. 7.86 + 5730 years = 45,027 years.
REFERENCES
Bennett, C.L. 1979. Radiocarbon dating with accelerators. American Scientist 67:450-457.
Bolin, Bert. 1970. The carbon cycle. Scientific American 233:124-132.
Borchert, H. 1951. Zur Geochemie des Kohlenstoffs. Geochimica et Cosmochimica Acta 2:62-75.
Broecker, Wallace S. 1974. Chemical oceanography. Harcourt, Brace, Jovanovich, New York.
Brown, R.H. 1974. Non-Poisson distributions observed during counting of certain carbon-14-labeled organic (sub)monolayers. Review of a paper by John L. Anderson. Origins 1(2):99-100.
Brown, R.H. 1975a. C-14 age profiles for ancient sediments and peat bogs. Origins 2(1):6-18.
Brown, R.H. 1975b. Can we believe radiocarbon dates? Creation Research Society Quarterly 12(1):66-68.
Clementson, Sidney P. 1974. A critical examination of radiocarbon dating in the light of dendrochronological data. Creation Research Society Quarterly 10(4):229-236.
Evans, W.F.J. 1974. Rocket measurements of water vapor in the stratosphere. Proceedings of the International Conference on Structure, Composition and General Circulation of the Upper and Lower Atmospheres and Possible Anthropogenic Perturbations. The University of Melbourne, Melbourne, Australia. January 14-25, 1974. Vol. 1, pp. 244-256.
Fairhall, A.W. and Young, J.A. 1970. Radiocarbon in the environment. In Robert F. Gould, ed. Radionuclides in the Environment, pp. 401-418. American Chemical Society, Washington, D.C.
Forman, M.A. and Schaeffer, O.A. 1979. Cosmic ray intensity over long time scales. Reviews of Geophysics and Space Physics 17:552-560.
Hall, D.O. 1979. Plants as an energy source. Nature 278:114-117.
Handbook of Chemistry and Physics. 1970. 51st ed. Standard atmosphere, pp. F-146 F-151. The Chemical Rubber Company, Cleveland.
Harries, J.E., Moss, D.G., Swann, H.R.W., Neill, G.F., and Gildwarg, P. 1976. Simultaneous measurements of H20, N02 and HNO3 in the daytime stratosphere from 15 to 35 km. Nature 259:300-302.
Kigoshi, Kunihiko, and Hasegawa, Hiroichi. 1966. Secular variation of atmospheric radiocarbon concentration and its dependence on geomagnetism. Journal of Geophysical Research 71:1065-1071.
Lingenfelter, R.E., and Ramaty, R. 1970. Astrophysical and geophysical variations in C-14 production. In Ingrid U. Olsson, ed. Radiocarbon Variations and Absolute Chronology, pp. 513-537. John Wiley and Sons, New York.
Nozaki, Y., Rye, D.M., Turekian, K.K., and Dodge, R.E. 1978. A 200 year record of carbon-13 and carbon-14 variations in Bermuda coral. Geophysical Research Letters 5:825-828.
Pearl, Henry F. 1963. A re-evaluation of time-variations in two geochemical parameters of importance in the accuracy of radiocarbon ages greater than four millenia. Unpublished Master's thesis. Pacific Union College, Angwin, California.
Ralph, E.K., Michael, H.N., and Han, M.C. 1973. Radiocarbon dates and reality. MASCA Newsletter 9(1). Applied Science Center for Archaeology, University of Pennsylvania, Philadelphia.
Reiners, William A. 1973. A summary of the world carbon cycle and recommendations for critical research. In Carbon and the Biosphere, p. 369. CONF - 720510, National Technical Information Service, U.S. Department of Commerce, Springfield, Virginia.
Revelle, R. and Suess, H.H. 1957. Carbon dioxide exchange between atmosphere and ocean and the question of an increase of atmospheric CO2 during the past decades. Tellus 9:18-27.
Rubey, William W. 1951. Geologic history of sea water: an attempt to state the problem. Geological Society of America Bulletin 62:1111-1148.
Scholz, T.G., Ehhalt, D.H., Heidt, L.E., and Martell, E.A. 1970. Water vapor, molecular hydrogen, methane, and tritium concentrations near the stratopause. Journal of Geophysical Research 75:3049-3054.
Shedlovsky, Julian P., Cressy, Phillip J., Jr., and Kohman, Truman. 1967. Cosmogenic radioactivities in the Peace River and Harleton chondrites, Journal of Geophysical Research 72:5051-5058.
Trivedi, B.M.P., and Goel, D.S. 1973. Nuclide production rates in stone meteorites and lunar samples by galactic cosmic radiation. Journal of Geophysical Research 78:4885-4900.
Whitelaw, Robert L. 1968. Radiocarbon confirms Biblical creation (and so does potassium-argon). Creation Research Society Quarterly 5(2):78-83.
Whittaker, R.H. 1970. Communities and ecosystems. The Macmillan Company, New York.
Wilson, A.T. 1978. Pioneer agriculture explosion and CO2 levels in the atmosphere. Nature 273:40-41.
Woodwell, G.M., Whittaker, R.H., Reiners, W.A., Likens, G.E., Delwiche, C.C., and Botkin, D.B. 1978. The biota and the world carbon budget. Science 199:141-146.